 IST,
IST,
VI. Price Situation
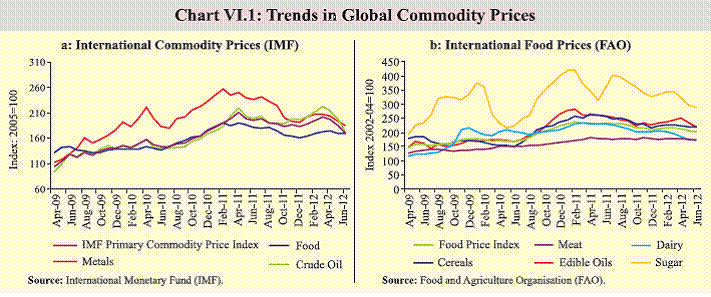
Headline inflation persisted above 7 per cent during Q1 of 2012-13 due to a rebound in food inflation as well as high fuel inflation even as non-food manufactured products inflation declined to below 5 per cent. The softening impact of growth moderation on inflation was partly offset by structural rigidities in the supply of food as well as the exchange rate depreciation. The benefits from the decline in global commodity prices were also partly offset by the falling rupee. The near-term inflation trajectory could remain sticky and conditioned by a number of risks that emanate from the unsatisfactory progress and distribution of the south-west monsoon, higher MSPs announced for kharif crops and the impact of the exchange rate pass-through. The path of inflation could also be impacted by the timing and magnitude of administered price revisions even though such adjustments have become necessary to reduce pressure on the medium-term inflation from expansionary fiscal policy. Continued pressure from wages and the structural nature of protein-food inflation could also keep inflation high even with moderation in overall growth. Added monetary easing by major economies as falling inflation provides space VI.1 Continuing uncertainty about how the sovereign debt crisis might play out along with newer indications of weakening growth, both in Advanced Economies (AEs) as well as Emerging and Developing Economies (EDEs) resulted in a decline in global commodity prices and moderation of global inflation. Demand pressures in the AEs are likely to remain muted for an extended period of time due to negative output gaps and subdued wages in the face of continued high unemployment in most economies. Inflation is also edging lower in most EDEs, largely helped by lower international primary commodity prices, given the higher share of primary commodities in their overall consumption. However, the ultimate impact of falling commodity prices on the EDEs is also conditioned by the exchange rate movements of their currencies. Volatility in commodity prices and exchange rate movements are likely to impart greater volatility in inflation for EDEs as compared with AEs. VI.2 In view of the amplified risks to growth and weakening inflationary pressures, many central banks undertook further monetary policy easing, although most of them remained wary of additional quantitative easing. The US Fed decided to extend “Operation Twist” till December 2012. The European Central Bank in June 2012 broadened the collateral acceptable at its window and in July 2012 reduced its policy rate. However, the Bank of England decided to increase its quantitative easing asset purchase programme. The People’s Bank of China reduced the reserve requirements ratio in May 2012 and further cut its policy rate in June and July 2012. CPI inflation in all these countries has fallen and is currently below 3 per cent, thus providing monetary space to address growth risks (Table VI.1). Global commodity prices declined on amplified risks to global growth and improved supply prospects VI.3 International prices of most commodities weakened during Q1 of 2011-12 due to growing economic uncertainties and weakening growth (Chart VI.1). Though the benefit from lower global commodity prices to India was partly offset by the depreciation of the rupee, as in the case of many EDEs, overall it has had a softening impact on global inflation. Global crude oil prices moderated on sovereign debt fears and the continued rise in production and build-up of inventories. Brent crude prices fell by about 25 per cent during Q1 of 2012-13. Compared with the average price of US$ 111.9 per barrel during 2011-12, the average Indian basket crude oil prices moderated to US$ 106.9 per barrel during Q1 of 2012-13. Prices declined to US$92 per barrel during the second fortnight of June 2012 before recovering to US$102.3 per barrel as on July 26, 2012. The recent increase has been both on account of aggravated geo-political tensions and monetary policy stimulus to revive growth by a number of central banks.
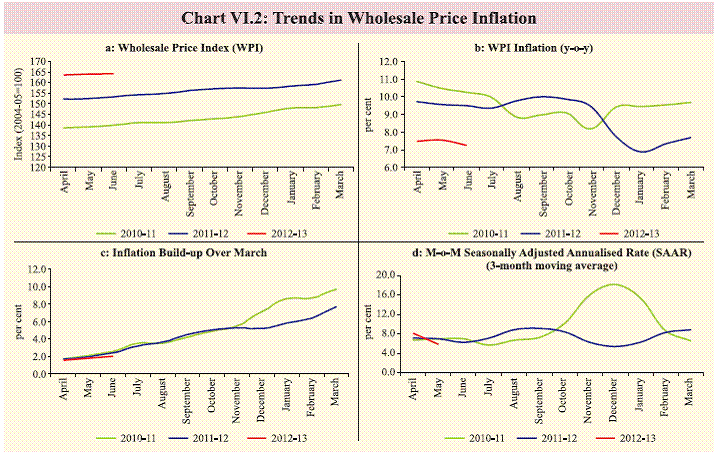
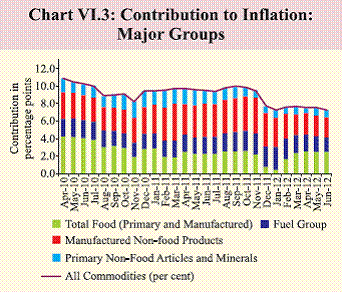
VI.4 Metal prices declined on concerns about moderation in global demand with the focus on Europe and China. Global food prices also moderated in recent months as is evident from the decline of the Food and Agricultural Organisation (FAO) food price index by about 7 per cent during Q1 of 2012-13. However, drought in the US and unfavourable weather conditions in Europe and other major crop producing countries are likely to impact food production negatively during 2012-13, which could put upward pressure on global food prices. Moreover, global commodity prices could come under further pressure if demand in the EDEs recover or excess global liquidity spills over to the commodity markets. Inflation pressures persist in India despite weakening of growth momentum VI.5 Headline wholesale price index (WPI) inflation declined from a high of 10 per cent in September 2011 to 7.2 per cent in January 2012. During Q1 of 2012-13, the average headline inflation was at 7.4 per cent (7.3 per cent, provisional, for June 2012) (Chart VI.2). The current headline inflation, though lower than the average inflation of above 9 per cent during the past two years, is much higher than the decadal average of 5.4 per cent during the 2000s. The WPI increased on a sustained basis and the 3-month moving average seasonally adjusted month-over-month changes since January 2012 indicate sustained price pressures with some moderation in April-May 2012 (Chart VI.2 d). VI.6 In terms of contribution to overall inflation, the share of food picked up sharply from February 2012. However, the contribution of manufactured non-food products recorded a consistent decline which was largely on account of deceleration in growth momentum in Q4 of 2011-12. The contribution of the fuel group remained high (Chart VI.3).
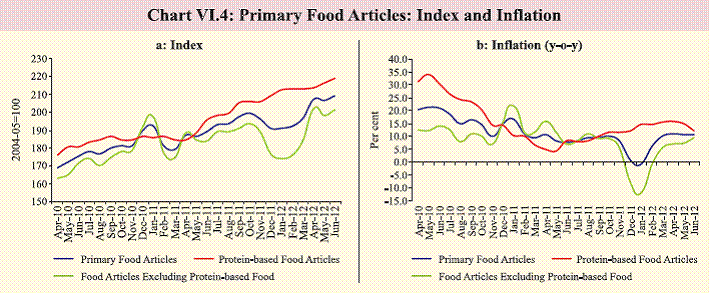
Food inflation persists at high levels VI.7 Food inflation increased significantly in recent months, driven largely by the increase in vegetable prices following the seasonal decline. Apart from vegetables, inflation was also high in pulses and edible oils in recent months. Advance estimates of production show shortfalls in the production of pulses as well as oilseeds during 2011-12. While cereals inflation remained moderate in the recent past (3.6 per cent on average during October 2010-March 2012), it increased to 6.4 per cent in Q1 of 2012-13 despite record foodgrains production in the previous year. Also, inflation in protein-rich items like milk, eggs, fish and meat continued to be in the double digits since August 2011, reflecting both structural demand-supply imbalances and input cost pressures (Chart VI.4). While the volatility in food inflation was largely on account of the seasonal movements in the prices of vegetables, the sustained increase in the prices of proteinrich items imparted a structural character to food inflation. Uncertainty over monsoon and high MSP could put further pressure on food inflation VI.8 There could be a further build-up of food inflationary pressures during 2012-13. The slow progress of the south-west monsoon so far and the uncertainty about its quantum as well as spatial and temporal distribution has emerged as a major risk to food inflation in the near-term. For the marketing year 2012-13, the government has announced increase in the minimum support price (MSP) for various crops in the range of 15 to 53 per cent. The commodities for which MSP has been raised have a combined weight of 3.4 per cent in overall WPI and the average increase (using WPI weights) work out to 25.6 per cent. The impact of MSP on market prices could vary across different commodities. However, the price pressures from the MSP continue to remain a major risk to inflation as the increases in MSP tend to translate into increases in market prices for most commodities.
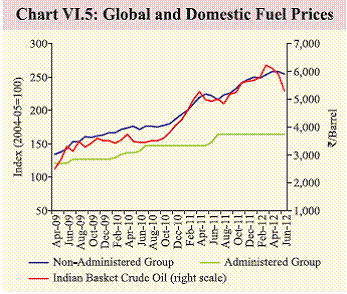
High fuel inflation continued as rupee depreciation partly offset lower crude prices VI.9 Fuel inflation remained in double digits, reflecting the increase in international crude oil prices over the past two years. Though global crude oil prices have declined since March 2012, lagged pass-through of past increases has led to further increase in fuel prices. The Oil Marketing Companies (OMC) raised petrol prices by `7.5 per litre on May 24, 2012 and subsequently adjusted the prices in line with changes in international prices. Also, the OMCs decided to implement the revised structure of ‘state specific cost’ with effect from July 24/25, 2012 to adjust for irrecoverable state taxes. This has led to changes in prices of petrol, diesel, kerosene and LPG across different states. While prices increased in some states, it declined in some other states reflecting the state specific tax structure. Since March 2012, the extent of crude oil prices decline in dollar terms has been substantial enough to reduce the price in Indian rupee terms despite depreciation of the rupee (Table VI.2). However, administered prices have not been revised for more than a year and therefore, risks to fuel inflation continue to remain significant (Chart VI.5). VI.10 Currently, the estimated under-recovery by domestic OMCs for diesel is `9.95 per litre, for PDS kerosene `27.20 per litre and `319.00 per cylinder for domestic LPG. Not adjusting administered prices in line with trends in international prices will further expand underrecoveries, which will lead to considerable fiscal strain. Though price adjustments will exert inflationary pressures in the near term, the risk to medium-term price stability from a widening fiscal deficit will be addressed by adjustment of prices in line with market conditions VI.11 Coal prices were increased in January 2012, with non-coking coal prices being hiked by 32.7 per cent. Increase in coal prices could lead to significant input cost pressures, particularly for electricity generation. Electricity price increases in the recent period have been much less than the increase in input costs. Therefore, State Electricity Boards (SEBs) need to catch up by the large hikes in prices at which they sell electricity to Discoms. Revision in power tariffs could become inevitable under such a scenario, which would add pressure to fuel inflation.
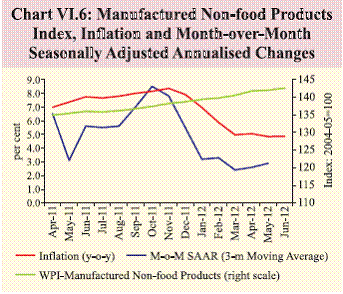
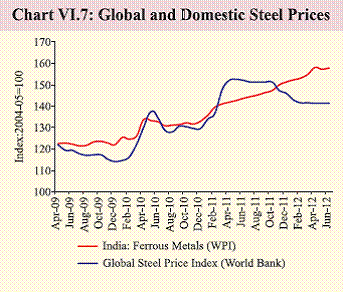
Inflation in non-food manufactured products muted by decline in growth VI.12 Manufactured non-food products inflation, an indicator of generalised inflationary pressures, moderated to below 5 per cent by March 2012 after two years. Since then, manufactured non-food products inflation remained subdued (4.8 per cent, provisional, June 2012), though price pressures are still visible in some manufactured commodities such as metals, fertilisers, pesticides and paints. Even though non-food manufactured products inflation declined in recent months, it still remains higher than the decadal average of 4.0 per cent during the 2000s. Also, core inflation in India in the recent period has been much higher than in AEs and EDEs. VI.13 The month-over-month seasonally adjusted annualised changes (3-month moving average) showed moderation of price pressures, notwithstanding a marginal pick-up in the latest month (Chart VI.6). Within non-food manufactured products, the ‘basic metals and metals products’ group, which has a substantial weight (10.7 per cent) in overall WPI, continued to have double digit inflation. Domestic metal prices have largely been following the global trends and therefore, the inflation in this category remained high as exchange rate depreciation partly offset the impact of moderating global prices (Chart VI.7). Apart from the pressure from global price trends and exchange rate movements, domestic constraints on supplies of key inputs like minerals and coal could also be a source of pressure on prices. These trends also indicate that the supply-side pressures do translate to generalised inflation through the input cost channel. These partly explain the lower than expected pace of moderation in non-food manufactured products inflation in the wake of significant slowdown in growth.
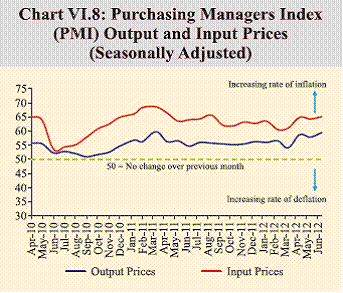
VI.14 Input cost pressures continued to remain persistent as seen from the HSBC Markit Purchasing Managers Index (PMI) which indicates that the pace of expansion of input costs was much higher than increases in output prices (Chart VI.8). In an environment of significant decline in profit margins (see Chapter II for details) this could force manufacturers to pass on prices even when demand remains moderate. This is corroborated by the output price index in PMI picking up significantly in recent months.
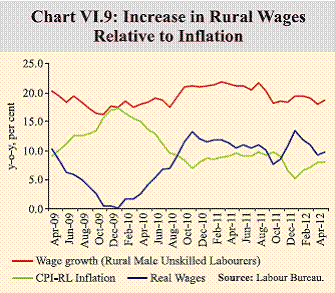
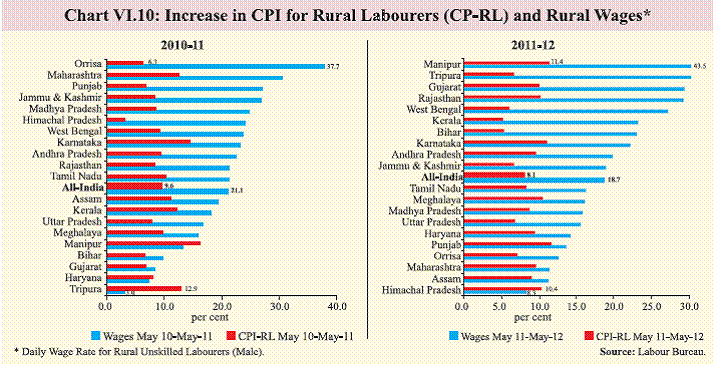
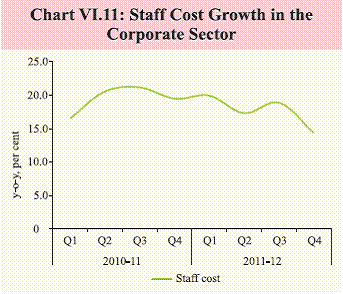
Wage pressures remain significant and may constrain the moderation in core inflation VI.15 The persistence of inflation can also partly be attributed to labour market conditions. The increase in wages in rural areas continued to be much sharper than compared to the comparable rate of inflation (Chart VI.9). The divergent pattern of this relationship between wage growth and inflation across major states also points out to region specific factors that influenced the wage-price dynamics (Chart VI.10). Similarly, in the formal sector, analysis of company finance data suggests that growth in staff costs, despite a moderate decline in the recent period, remained elevated (Chart VI.11). Rising real wages during the period of high inflation do protect the working population from the adverse impacts of inflation. However, rising real wages in excess of the productivity growth may not be sustainable in the medium-term and run the risk of a wage-price spiral.
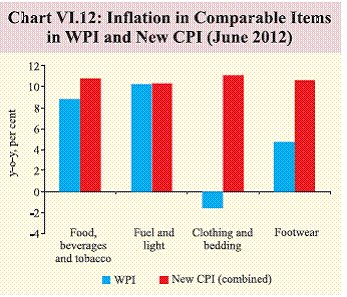
New CPIs exhibit higher inflation VI.16 Inflation as per the newly introduced Consumer Price Index (CPI) remained significantly higher than the WPI inflation (Table VI.3). There was also substantial divergence in inflation in certain product groups such as condiments and spices and vegetables. Notably, the divergence in the new CPI and the WPI inflation after excluding the volatile items (food and fuel) continued to be high. A comparison of similar items under the WPI and the new CPI indicate that there is divergence even among common product group inflation (Chart VI.12). This divergence between the new CPI inflation and the headline WPI inflation has raised concerns about the extent of the transmission of recent moderation in headline inflation to the consumers.
VI.17 The difference in weighting pattern and coverage could also explain the divergence between inflation based on the CPI and the WPI. While food has a relatively larger weight in the new CPI, the WPI has more weight for manufactured products with items like metals and chemicals that do not enter the CPI directly. The new CPI includes housing and many services which are not covered under WPI. Comparable data for a relatively longer period of time is necessary to make a realistic assessment of the divergence between the new CPI and existing inflation measures. The new comprehensive CPI does not have adequate history to support data analysis and to be used as the sole headline measure of inflation.
Risks to inflation remain even as growth slowdown eases demand pressures VI.18 Even though inflation declined during the latter part of 2011-12, the persistence of inflation in recent months above the 7 per cent mark points to the sticky nature of inflation, even as growth has slowed. Inflation in the non-food manufactured products category came down to below 5 per cent, partly reflecting the demand moderating impact of past monetary tightening and weakening of pricing power. However, high food inflation, especially in protein-rich items, and persistent fuel inflation kept headline inflation high. The near-term inflation outlook is conditioned on the spatial and temporal distribution of the south-west monsoon, the impact of exchange rate pass-through and likely trends in global commodity prices. While moderation in global commodity prices could ease the pressure from imported inflation, pass-through of rupee depreciation will partly offset the impact. The increases in MSP and sustained increases in wage levels could further exert pressure on overall inflation. The administered prices of fuel do not reflect the trends in global market prices and revision of these would be necessary to reduce the extent of suppressed inflation. The persistence of inflation in an environment of slowing growth is a major challenge for monetary policy. |
||||||||||||||||||||||||||||||||||||||||||||||||||||||||||||||||||||||||||||||||||||||||||||||||||||||||||||||||||||||||||||||||||||||||||||||||||||||||||||||||||||||||||||||||||||||||||||||||||||||||||||||||||||||||||||||||||||||||||||||||||||||||||||||||||||||||||||||||||||||||||||||||||||||||
Page Last Updated on:


