 IST,
IST,


VII External Sector (Part 1 of 2)
Current Account - Approach, Developments and Issues
Introduction
7.1 The external sector has exhibited a marked transformation since the balance of payments crisis in 1991. The crisis was overcome by a series of stringent measures with an overriding objective to honour all external obligations without resorting to rescheduling of any external payment obligation. While successfully dealing with the crisis through an adjustment programme, it was decided to launch simultaneously a comprehensive programme of structural reforms in which the external sector was accorded a special emphasis.
7.2 After the 1991 crisis, the broad approach to reform in the external sector was laid out in the Report of the High Level Committee on Balance of Payments, 1993 (Chairman: C. Rangarajan). The objectives of reform in the external sector were conditioned by the need to correct the deficiencies that led to the payment imbalances of 1991. Recognising that an inappropriate exchange rate regime, unsustainable current account deficit and a rise in short-term debt in relation to the official reserves were the key contributing factors to the crisis, a series of reform measures was put in place. A swift transition to a market determined exchange rate regime was felt necessary so as to deal effectively with the uncertain response to reforms introduced in other areas of the external sector at that time. It may be recalled that other reforms initiated in the external sector included dismantling trade restrictions, moving towards current account convertibility, liberal inflows of private capital, removal of restrictions on all inflows and related outflows, as also, gradual liberalisation of certain restrictions on outflows. The overall objective of the reform process was to achieve higher growth and efficiency without exposing the system to greater vulnerability. Consumer welfare was sought to be improved by making available better quality products at globally competitive prices and by providing greater freedom of choice to residents to undertake current transactions on a global scale.
7.3 Responding to the reform process, the external sector has gained considerable strength, resilience and stability. This is evident from an unprecedented accretion to reserves, modest current account deficit (of late, a surplus), larger non-debt creating capital inflows, orderly exchange rate movements and containment of external debt within sustainable levels. Notwithstanding these comforts, there are areas of concern and challenges, arising primarily from the growing openness of the economy, the need for accelerating growth in the medium-term and also the need to meet the Tenth Plan growth target through higher capital flows for investment. In this context, while it is important to review and assess the impact of various reform programmes and policies relating to the external sector, there is also a need to examine a range of emerging issues. These include: current account sustainability in the wake of increased openness, the possibility of a 'Dutch disease' type effect (on account of strong performance of software exports and remittances), more open capital account and cost of accretion to reserves, including its implications for monetary management.
7.4 Against this backdrop, this Chapter attempts to profile the changes in the external sector and its implications for macroeconomic management. Section I analyses the developments relating to trade liberalisation in terms of tariff rationalisation and dismantling of quantitative restrictions, institutional arrangements, strengthening of regional groupings and India’s position in the World Trade Organisation (WTO). Section II discusses the changing structure of foreign trade, changing role of invisibles in the current account, and the current account balance in the post reform period. Section III presents an overview of the capital account developments and outlines the capital account liberalisation process in India. This section also offers an assessment of the external debt scenario in India and the exchange rate developments. Section IV examines the range of issues relating to adequacy of foreign exchange reserves and the associated implications for monetary management and growth Concluding observations are set out in Section V.
I. TRADE REFORMS, INSTITUTIONAL ARRANGEMENTS AND INDIA’S POSITION IN THE WORLD TRADE ORGANISATION (WTO)
Trade Reforms
7.5 Trade reforms formed an integral part of the overall structural reform process. An open trade regime has been viewed as the least vulnerable form of globalisation with enormous opportunities for higher growth emanating from higher exports and higher welfare resulting from the possibility to make available better quality products at globally competitive prices under competition from liberalised imports (Krueger, 1998). This has been the rationale and the guiding principle for the trade reforms in India. As has been brought out by a number of individual and cross-country studies, trade restrictions reduce real economic growth by distorting the pattern of resource allocation, and by discouraging innovation and technical progress. Import substitution inflicts static costs on the economy by way of resource misallocation as also dynamic costs by raising the incremental capital-output ratios and exclusion from new technology. While the traditional argument for free trade in terms of allocative efficiency is made under the assumption of perfect competition, it is also argued that in imperfectly competitive markets, increased competition through trade would bring about welfare gains by reducing the dead-weight losses engendered by domestic monopolies and oligopolies (Helpman and Krugman, 1989). Beneficial impact of trade liberalisation on economic growth is also envisaged through the international production networks which spread the sequential production processes across national boundaries. Some of the channels through which trade liberalisation would affect the welfare of the people are: the access to imported goods, relative prices of tradable goods, relative wages of skilled and unskilled labour, impact on government revenue, incentives for investment and innovation affecting economic growth, and the vulnerability of the economy to external shocks (Bannister and Thugge, 2001). In the debate on the sequencing of different channels of globalisation, the general view has favoured sequencing driven by trade liberalisation (Edwards and van Wijnbergen, 1986; Rodrik, 1987; Mussa, 1984). Box VII.1 sets out the cross-country experience on trade liberalisation.
Box VII.1 The rationale for trade reforms is essentially based on the drawbacks of trade intervention, as well as superior growth performance of countries that adopted liberal outward-oriented policies. The inward-looking trade policies adopted by the developing countries till the 1980s were rooted in the argument that trade policies should not be conditioned by prevailing world relative prices, given the low income and price elasticities of primary commodities which could lead to a secular deterioration in the terms of trade. The arbitrary nature of quantitative restrictions that characterises trade interventions creates uncertainty for domestic producers and consumers. These distortions are manifested in efficiency losses in domestic production, weak competition in the domestic market, and emergence of rent seeking behaviour and corruption. The removal of quantitative restrictions or their conversion into tariffs, as part of trade reform package, has several advantages such as reduction in scope for rent-seeking, transfer of rents from the importers to the government, and greater transparency and predictability of the trade regime. Moreover, due to the measurability of tariff reductions, the designing and monitoring of trade reform has become easier. Endogenous growth literature (Sala-i-Martin, 1990; Baldwin and Francois, 1999) suggests that beneficial impact of trade reforms on economic growth could arise through technology transmission, international integration of production, reduction of price distortions and enhanced efficiency. Till the early 1980s, the pattern of trade policy across countries broadly reflected the extreme preferences of national policy makers for export-pessimism-cum-import substitution on the one hand and export-led growth on the other. In tandem with global developments, export-promotion and greater trade integration became the policy objective of almost every country by the 1990s, although the extent of trade integration varied considerably across countries. Even so, some general features of trade liberalisation include tariff reductions, quota elimination, relaxation of import licensing, conversion of quotas into tariff, compression of the range of tariffs and rationalisation of collection arrangements (Greenaway, 1998). Dismantling of tariff and non-tariff barriers under the multilateral trading arrangements also exposed many inward-looking economies to external competition. Since developing countries depend to a large extent on trade tax revenues, one of the important concerns regarding trade liberalisation was its revenue implications. It has generally been observed that the revenue implications of trade liberalisation are uncertain and depend upon the country’s initial conditions and the components of the reform package which should be kept in view while formulating the trade liberalisation strategy (Blejer and Cheasty, 1990; Tanzi, 1989; Greenaway and Milner, 1991; IMF, 1998). As far as the sequencing of reforms is concerned, domestic factor (labour) markets need to be liberalised before commodity markets so as to facilitate production decisions. Trade liberalisation also needs to precede capital account liberalisation in order to preclude further distortions in domestic production consequent upon capital inflows to those sectors. Loser and Guerguil (1999) have documented the impact of a sharp reversal in trade policy of the Latin American and Caribbean (LAC), countries particularly in the1990s, from import substitution to trade liberalisation. Trade reform mainly comprised: (i) a significant reduction in both average tariff (from 45 per cent in 1986 to 14 per cent in 1998) and maximum tariff (from 80 per cent to about 30 per cent); (ii) removal of most of the quantitative and other non-tariff barriers which consequently affected only 11 per cent of total imports in 1997 as against almost 40 per cent in the mid-1980s; and (iii) liberalisation of currency markets and elimination/ reduction of foreign exchange controls on international payments. A comparison of the trends in the trade restrictiveness index, the real effective exchange rate and import and export ratios for a number of LAC countries shows that: (i) trade liberalisation was both significant and rapid; (ii) trade policy reform coincided with currency appreciation in almost all countries; (iii) the import ratio increased significantly (an average of 5 percentage points) in all the countries and within a short time span (2-3 years), perhaps responding to currency appreciation. There was a shift in the composition of imports from primary products to manufactures; (iv) the response of the export ratio was relatively small and delayed (an average increase of 4 percentage points after a lag of 6 years), indicating that the positive impact of trade liberalisation was partially dampened by currency appreciation; and (v) remaining market restrictions including those in respect of the labour market, competition and financial markets tended to increase costs and circumscribe productivity gains, limiting thereby the positive impact of trade liberalisation. The high growth rate of the East Asian economies, including Hong Kong, Indonesia, Malaysia, Korea, Singapore and Thailand (at least till the financial crisis of 1997) was, to a large extent, based upon their export performance. All these countries adopted strategic export policies that set up a free trade regime and offered a gamut of incentives for exports. Furthermore, general import restrictions were not imposed even in the face of current account deficits. In general, trade liberalisation was part of a policy package that comprised devaluation, exchange rate unification, fiscal reforms and foreign aid or concessional loans to neutralise the impact of a temporary current account deficit. The export strategy adopted by these economies included at least one of the following four elements, viz., access to imports at international prices (via free trade/export processing zones, tariff exemptions, duty drawbacks); export financing (often at subsidised rates); market penetration (via direct income tax incentives, exporter associations, setting up of international trading companies); and flexibility. An IMF study (1999) on the experience of six countries, viz., Argentina, Philippines, Poland, Morocco, Malawi and Senegal which undertook trade liberalisation over the mid-1980s to mid-1990s shows that phasing out of quantitative restrictions received priority in all cases, although the pace and nature of the reform was guided by revenue concerns. Poland in 1990 placed strong emphasis on eliminating quantitative restrictions which was an integral element of its ‘big bang’ transformation. The 1991 trade reform programme in Argentina included tariffication of certain import quotas and the elimination of some reference prices. Malawi’s trade liberalisation programme in the late 1980s included a focus on eliminating foreign exchange rationing. Similarly, Senegal embarked in 1986 on a phased reduction of quantitative restrictions. The Philippines concentrated on the tariffication of quantitative restrictions during the initial phase of its trade liberalisation efforts. Morocco’s reforms adopted in 1983 included a gradual elimination of quantitative restrictions on imports and the abolition of import deposit requirements. All countries in the sample also stressed tariff reductions in their reform programmes, though to varying degrees. Senegal’s liberalisation efforts in the mid-1980s were hampered by weak macroeconomic management and stagnant trade. As a result, tariff reductions were accompanied by serious revenue shortfalls which led to a reversal of the tariff cuts. The second phase implemented in conjunction with the 1994 devaluation was successful. In the Philippines, reduced reliance on trade taxes has at times been constrained by the weakness of domestic tax mobilisation. Along with tariffication of quotas, a temporary import surcharge was imposed in the early 1990s. As a result, the collected tariff rate declined only slightly from 16.7 per cent in 1985 to 14.4 per cent in 1995. Several countries gave high priority to reducing tariff dispersion and consolidating tariff structures. Some countries also demonstrated how domestic taxes can reinforce the protection provided by trade taxes and also highlighted the importance of broadening the domestic tax base as part of an overall liberalisation package. A study by OECD (2001) on the trade reforms undertaken by transition economies (the Central Eastern and European Countries (CEECs) and the countries belonging to the Commonwealth of Independent States (CIS)) since the beginning of the 1990s, observes that: (i) the uneven progress and diverse outcomes of the reforms in individual transition countries resulted from a complex interaction of initial economic and political conditions prevailing in individual countries and the choice of their reform strategies; (ii) regional integration and multilateral disciplines played a critical role in this process by providing legal and regulatory guidance for designing new trade policies and by imposing trade policy commitments thereby stabilising trade liberalisation achievements and reducing the risk of protectionist reversals; (iii) recent developments in transition economies show a clear relation between GDP performance and trade openness. In general, between 1990 and 1999, most CEECs saw their GDP and exports per capita increase simultaneously. Few exceptions to this general trend can be explained by special situations of individual countries, recently affected by regional conflicts (Bulgaria) or by the financial and economic crisis in Russia in 1998 (Latvia, Lithuania). By contrast, all CIS counties were confronted with the parallel contraction of per capita GDP and exports; (iv) at the beginning of the transition process, many CEECs recorded a trade surplus, due to drastically devalued exchange rates. Later, exchange rate appreciation and a revival of domestic demand fuelled import growth, while exports started to lag behind, partly because of the contraction of external demand, but mostly due to delays in restructuring. As a result of these cumulative effects, most transition economies faced serious deterioration of their trade balance. Measured as the percentage share of GDP, current account deficits reached critical levels in several transition countries, both among the CEECs (11 per cent of GDP in Lithuania in 1999) and the CIS (46 per cent of Turkmenistan’s GDP in 1999). In this regard, Russia, as a major commodity exporter, has been an exception. |
7.6 In the post-war period, several developing countries pursued import substitution-led development strategies. Poor growth resulting from such strategies, however, led to policy reorientation in the early 1960s. While one set of countries started giving more incentives for the export sector even while persisting with a moderate form of import substitution (for instance, Brazil, Argentina and Mexico), another set of countries made a more fundamental shift in favour of outward orientation (for instance Korea, Singapore and Taiwan) (Balassa, 1989). The Indian development strategy recognised the significance of liberal trade policy in the early 1980s, which was manifested in the form of a number of important recommendations made at that time by several Committees. The notable ones focused on a shift in emphasis from control to deregulation through simplification in import licensing system (Alexander Committee, 1978), clear recognition of dynamic comparative advantages associated with export growth (Tandon Committee, 1980), the need to harmonise foreign trade policies with other macroeconomic policies, advantages of an export-led growth strategy, a phased reduction in effective protection (Abid Hussain Committee, 1984) and the need to discourage inefficient import substitution (Narasimham Committee, 1985). Notwithstanding these concerns, the trade regime continued to be characterised by a licensing system which together with a high tariff structure protected the economy from external competition. In addition, the trade performance was constrained by restrictive foreign investment policies (RBI, 1999).
7.7 The process of trade liberalisation, however, gathered momentum only during the 1990s in the aftermath of the external payments crisis. The policy measures undertaken aimed at making domestic industry cost-efficient by enhancing efficiency in resource use under international competition, which was expected to derive a better export performance in the long-run. The major trade policy changes in the post-1991 period included simplification of procedures, removal of quantitative restrictions, and substantial reduction in the tariff rates as also their dispersion as recommended by the Tax Reforms Committee, 1992 (Chairman: Raja J. Chelliah). Furthermore, the reach of the export incentives was broadened, extending the benefits of various export-promotion schemes to a large number of non-traditional and non-manufactured exports. Following the announcements in the Export Import (EXIM) policies, various changes were effected such as the removal of quantitative restrictions, strengthening the export production base, removal of procedural bottlenecks, technological upgradation and improvement of product quality. Various steps were also taken to promote exports through multilateral and bilateral initiatives, including identification of thrust areas and focus regions. The policy stance also marked a move away from the provision of direct export subsidy to indirect promotional measures. India also took several policy initiatives at the multilateral levels for tariffication of the non-tariff barriers. As per India’s commitment to the World Trade Organisation (WTO), India agreed to the phased removal of all balance-of-payments (BoP) related quantitative restrictions by end-March 2001.
7.8 The tariff rates have undergone considerable rationalisation during the 1990s. Prior to the 1990s, the maximum import duty rates on certain items were over 300 per cent. The peak rate of import duty on non-agricultural imports was gradually reduced from as high as 150 per cent in 1991-92 to 25 per cent (excluding agriculture and dairy products) by 2003-04 (Chart VII.1) The weighted average import duties on various goods, even though reduced from the high levels prevailing earlier, are still higher than that of some of the East Asian countries (Table 7.1). The rate for China is expected to be phased down to less than 10 per cent in the coming years as part of China’s agreement in connection with its WTO entry (Government of India, 2001).

Table 7.1: Tariff Barriers Across Select Emerging Market Economies | ||||||||
(Per cent) | ||||||||
All Products | Primary Products | Manufactured Products | ||||||
Country | Year | Simple | Standard | Weighted | Simple | Weighted | Simple | Weighted |
Mean | Deviation of | Mean | Mean | Mean | Mean | Mean | ||
tariff | tariff rates | Tariff | Tariff | Tariff | Tariff | Tariff | ||
1 | 2 | 3 | 4 | 5 | 6 | 7 | 8 | |
China | 1992 | 41.0 | 30.6 | 32.2 | 35.4 | 13.9 | 42.3 | 36.5 |
2000 | 16.3 | 10.7 | 14.7 | 16.5 | 18.8 | 16.2 | 13.7 | |
Indonesia | 1989 | 21.9 | 19.7 | 13.0 | 19.9 | 5.8 | 22.3 | 15.6 |
2000 | 8.4 | 10.8 | 5.2 | 6.3 | 2.8 | 8.9 | 6.7 | |
Malaysia | 1988 | 17.0 | 15.1 | 9.4 | 15.2 | 4.6 | 17.4 | 10.5 |
1997 | 9.3 | 33.3 | 6.0 | 7.0 | 10.0 | 10.3 | 5.4 | |
Philippines | 1989 | 28.0 | 14.2 | 22.4 | 29.6 | 18.5 | 27.7 | 23.6 |
2000 | 7.6 | 7.9 | 3.8 | 11.9 | 7.5 | 6.9 | 3.3 | |
Thailand | 1989 | 38.5 | 19.6 | 33.0 | 30.6 | 24.2 | 39.6 | 35.7 |
2000 | 16.6 | 14.1 | 10.1 | 21.9 | 9.5 | 15.7 | 10.2 | |
India | 1990 | 79.0 | 43.6 | 49.6 | 69.1 | 25.4 | 80.2 | 69.9 |
1999 | 32.5 | 12.3 | 28.5 | 30.9 | 23.2 | 32.8 | 32.7 | |
Note: | ||||||||
(i) Simple mean tariff: Unweighted average of the effectively applied rates for all products subject to tariffs. | ||||||||
(ii) Standard deviation of tariff rates: Average dispersion of tariff rates around the simple mean. | ||||||||
(iii) Weighted mean tariff: Average of effectively applied rates weighted by the product import shares corresponding to each partner country. | ||||||||
Source : World Bank, 2002. | ||||||||
7.9 The weighted average tariff rates of India for various broad import groups are set out in Table 7.2. It is observed that although the average tariff rate declined steadily from 1991-92 to 1996-97, thereafter, it edged up again, inter alia, due to the imposition of various surcharges. The increase in the weighted average tariff rates since 1998-99 has been predominantly in agriculture and consumer goods sectors.
Table 7.2: Weighted Average Import Duty Rates in India | ||||||
(Per cent) | ||||||
Con- | Inter- | All | ||||
Agri- | sumer | mediate | Capital | Commo- | ||
Year | culture | Mining | Goods | Goods | Goods | dities |
1 | 2 | 3 | 4 | 5 | 6 | |
1991-92 | 47.0 | 56.9 | 97.8 | 69.5 | 94.8 | 72.5 |
1992-93 | 22.8 | 32.6 | 83.2 | 62.6 | 85.2 | 60.6 |
1993-94 | 19.8 | 33.4 | 68.7 | 47.6 | 58.4 | 46.8 |
1994-95 | 16.8 | 30.3 | 55.9 | 38.4 | 45.5 | 38.2 |
1995-96 | 16.7 | 29.9 | 36.1 | 22.9 | 29.1 | 25.9 |
1996-97 | 14.7 | 22.0 | 39.0 | 21.9 | 28.8 | 24.6 |
1997-98 | 14.0 | 21.9 | 33.8 | 46.1 | 25.1 | 25.4 |
1998-99 | 24.2 | 19.9 | 37.9 | 31.1 | 29.4 | 29.2 |
1999-00 | 24.4 | 21.4 | 37.4 | 33.1 | 31.0 | 31.4 |
2000-01 | 58.6 | 16.1 | 56.2 | 36.2 | 34.4 | 35.7 |
2001-02 | 57.7 | 15.8 | 67.1 | 34.8 | 31.8 | 35.1 |
Source : | Report of the Task Force on Employment Opportunities, | |||||
Planning Commission, Government of India, July 2001. | ||||||
7.10 The Government, however, is committed to reducing tariffs to levels comparable with those prevailing in East Asian economies. The Finance Minister in the Union Budget for 2001-02, had stated that there would be a progressive move within three years to reduce the number of rates to the minimum with a peak rate of 20 per cent. This was reiterated in the Union Budget for 2002-03, wherein it was stated that by 2004-05, there would be only two basic rates of customs duties, namely 10 per cent covering raw materials, intermediates and components and 20 per cent covering final products. Keeping in line with these announcements, the Union Budget for 2003-04 while reducing the customs duties on several products, brought down the peak tariff rate to 25 per cent (excluding agriculture and dairy products).
Removal of Quantitative Restrictions
7.11 India has been following a consistent policy for gradual removal of import restrictions since 1991, when the economic reforms were initiated. India began removing BoP related Quantitative Restrictions (QRs) unilaterally since 1996. QRs were removed on 488 items in 1996, 391 items in 1997 and 894 items in 1998. As per India’s commitments to the WTO, out of the remaining 1,429 items for which QRs were maintained on BoP grounds under the General Agreement on Tariffs and Trade (GATT) provisions, QRs on 714 items were removed on March 31, 2000 and the balance QRs on 715 items were removed on March 31, 2001. With this progressive removal of QRs maintained on BoP considerations, restrictions, still in force only relate to those items as permissible under Articles XX and XXI of the GATT on grounds such as security, health, safety, or moral conduct. While removing QRs, the Government has taken several safeguard measures (adjustment of tariffs, imposition of temporary QRs, safeguard duties, anti-dumping duties and restricting the import of certain agricultural products) in order to guard against any surge in imports on account of dumping. A high-powered Standing Group functions on a war footing for tracking, collating and analysing data on 300 sensitive items of importance to the public.
7.12 Reflecting the relaxation of quantitative restrictions, the proportion of canalised items in total imports in value terms declined from 27 per cent to 19 per cent between the ten-year period from 1988-89 to 1997-98. With effect from April 1998, 340 items were shifted from the ‘Restricted list’ to the ‘Open General Licence (OGL) list’. With effect from March 31, 1999, the convention of publishing a negative list for imports and exports was discontinued. The share of tariff lines without restrictions has now gradually increased to around 95 per cent since April 1, 2001 from a level of 61 per cent as on April 1, 1996.
Institutional Arrangements
7.13 The policy thrust on exports during the 1980s and 1990s was promoted through several schemes. These schemes have been refined further during the 1990s and new schemes have also been introduced.
Export Processing Zones (EPZs) were set up as enclaves separated from the Domestic Tariff Area (DTA) by fiscal barriers and intended to provide an internationally competitive duty free environment for export production at low cost. Eight of the EPZs have since been converted into Special Economic Zones (SEZs).
The Export Oriented Units (EOUs) Scheme, which is complementary to the EPZ scheme, was set up in 1981 under which a unit can be set up in any of the seven EPZs or at any other location in the country and be eligible for a host of liberal package of incentives which include same entitlements as given to EPZs.
In order to fully exploit the potential in the Information Technology (IT) sector and to promote IT related exports, the Central Government has set up Software Technology Parks (100 per cent EOUs) since 1991.
To build a strong and efficient electronics industry with good export potential, Electronic Hardware Technology Parks (EHTPs) were also set up.
- The SEZ Scheme was announced in March 2000 in order to promote export production in a hassle-free atmosphere (Box VII.2).
The proposal to set up Agriculture Economic Zones (AEZs) was announced in March 2001 to promote the export of agro and agro-based products, and 45 AEZs have been sanctioned so far. The Central Government would assist the State Governments in the development of necessary infrastructure, flow of credit and other facilities for promoting agro exports.
7.14 In addition, schemes were put in place for imports undertaken by exporters so as to neutralise the impact of any duties on those imports. Such schemes are Export Promotion Capital Goods (EPCG), Duty Free Replenishment Certificate (DFRC), Duty Remission Scheme and the Duty Entitlement Passbook (DEPB) Scheme. The issue of multiplicity in these schemes is being addressed.
7.15 Steps have also been taken to simplify the rules and procedures and improve the speed of transactions in the Directorate General of Foreign Trade (DGFT) with the help of information technology aimed at reducing transactions costs. A common commodity classification for imports and exports has been adopted by both, the Directorate General of Commercial Intelligence and Statistics (DGCI&S) and the Central Board of Excise and Customs (CBEC) to eliminate the classification disputes. In the area of customs, the percentage of physical examination of export cargo has already been reduced substantially except for few sensitive destinations while a major push is being given to Electronic Data Interchange (EDI) and ‘System based Appraisal’. Export Promotion Councils have been set up to function as a conduit between the exporters and the Government and to provide essential services required by the exporters.
Box VII.2 The economic rationale for establishing Special Economic Zones (SEZs) is not clearly laid down in trade theory. It is, however, obvious that these Zones can be justified either on considerations of equity where a less developed area is accorded special tax and non-tax benefits or on considerations of efficiency, where a region has a spatial advantage in terms of costs. SEZ, as an institutional measure, supports the economic policy shift from import substitution to export promotion with a view to promoting export-led growth to facilitate larger incomes and employment. For these reasons, a large number of countries have taken initiatives to set up SEZs over the last half century or so. India followed suit in recent years, with a view to improve its competitive position. The Special Economic Zone (SEZ) Scheme was announced on March 31, 2000 in order to promote export production in a hassle-free atmosphere. A separate chapter on SEZ was added to the EXIM Policy for the five-year period 1997-2002 in April 2001. SEZs are specifically delineated duty-free enclaves, deemed as foreign territory for the purposes of trade operations and application of duties and tariffs. SEZs can be set up for the manufacture of goods and the rendering of services, production, processing, assembling, trading, repair, remaking, reconditioning, re-engineering including making of gold/silver/platinum jewellery and articles thereof or in connection therewith. Units for generation/ distribution of power can also be set up in the SEZs. Goods going into the SEZ area from the Domestic Tariff Area (DTA) are treated as deemed exports and goods coming from the SEZ area into DTA are treated as if the goods are being imported. The incentives offered under the SEZ Scheme include duty-free importation/domestic procurement of goods for the development of SEZ and setting up of units, 100 per cent Foreign Direct Investment (FDI) in manufacturing sector under the automatic route, 100 per cent income tax exemption for the first five years and 50 per cent tax for two years thereafter. Other incentives include sub-contracting of part of production abroad, reimbursement/exemption of Central Sales Tax on domestic purchases by the SEZ units and retention of 100 per cent foreign exchange earnings in the Exchange Earners Foreign Currency (EEFC) Account. In the EXIM policy for 2002-07 as announced in March 2002, SEZs were given the following concessions: Overseas Banking Units (OBUs) which would, inter alia, be exempt from CRR and SLR requirements would be permitted to be set up in SEZs. These OBUs would give access to SEZ units and SEZ developers to international finance at international rates. SEZ units would be extended income tax exemptions and would be exempt from External Commercial Borrowing (ECB) restrictions and would be allowed to make overseas investment and carry out commodity hedging. SEZs would be exempted from Central Sales Tax in respect of supplies from DTA and transactions from DTA to SEZs would be treated as exports under the Indian Income Tax and Customs Acts. So far, eight existing export promotion zones have been converted into SEZs and approval has been given for the setting up of 17 SEZs in the States of Gujarat, Maharashtra, Tamil Nadu, West Bengal, Orissa, Uttar Pradesh, Andhra Pradesh, Madhya Pradesh and Karnataka. Source : 1. Export Import Policy 2002-07, Ministry of Commerce and Industry, Government of India, March 2002. 2. Government of India, Press Releases dated July 19, November 22, 2002 and March 3, 2003. |
7.16 Trade finance is a crucial element in the design of trade policies. From time to time, the Reserve Bank has undertaken several measures to ensure adequate and timely availability of credit for exports at competitive interest rates. The Reserve Bank’s export credit refinance schemes have played a pivotal role in this area. Commercial banks have been providing credit to exporters at pre-shipment and post-shipment stages, both in rupees as well as foreign currency. The rupee export credit has been generally available at rate of interest linked to the Prime Lending Rate (PLR). The export credit in foreign currency is provided at internationally competitive interest rates linked to London Inter-Bank Offer Rate (LIBOR) or similar interest rates. The Reserve Bank has been adjusting interest rates on rupee export credit from time to utime taking into account the need to maintain competitiveness by looking at interest rate differentials, as also other factors like inflation and developments in financial markets. The Reserve Bank has also taken measures to support institutional arrangements for export promotion, such as policy initiatives to provide a liberalised environment for the operations of SEZ units. These measures include: (i) exemption from interest rate surcharge on import finance; (ii) release of foreign exchange to DTA units for buying goods from EOU/EPZ/SEZ units; (iii) permitting 100 per cent retention of foreign exchange in Exchange Earners Foreign Currency (EEFC) accounts; (iv) permitting overseas investment by SEZ units from the EEFC accounts through the automatic route, write-off of unrealised export bills and (v) permitting SEZ units to enter into a contract in overseas commodity exchanges or markets to hedge the price risk in the commodity on export/import provided that the contract is made on a ‘stand alone’ basis.
Box VII.3 India’s current status and views regarding various issues as outlined in the latest Trade Policy Review conducted by the WTO are set out below: Agriculture The post-Uruguay Round experience has been a mixed one for agricultural trade in India. In the ongoing negotiations on the Agreement on Agriculture, India submitted detailed proposals with a view to safeguarding the food and livelihood security of the large subsistence level farming community and maximising export opportunities for Indian agricultural products by seeking a reduction in the high tariffs and subsidies prevalent in developed countries. International Standards in Trade and Industry India is a signatory to the Agreement on Technical Barriers to Trade and the Agreement on Sanitary and Phytosanitary measures and there is a greater emphasis on bringing Indian standards to international levels. Most standards in India are voluntary although health and safety regulations are mandatory for several products. 133 products are under compulsory Bureau of Indian Standards (BIS) certification for domestic goods through various Quality Control Orders issued by various Ministries/Departments. India is concerned with the developed countries outnumbering the developing countries in the deliberations, resulting at times in international standards development not conducive to their implementation by the developing countries. Given the lack of access to technologies developed abroad for achieving standards acceptable to importing countries, India feels that specific measures need to be taken by developed country Members to give effect to the clauses extending 'Special and Differential treatment' to developing countries in the implementation of these WTO Agreements. Intellectual Property Consequent to India’s obligations under the TRIPS Agreement, appropriate and necessary changes have been identified and enacted in almost all cases in legislations relating to protection of Intellectual Property Rights (IPRs). In addition India has enacted sui generis legislations in some TRIPS related areas. For the protection of Geographical Indications of Goods, a sui generis legislation, viz., the Geographical Indications of Goods (Registration & Protection) Act, 1999 has been enacted in order to comply with the requirements under the TRIPS Agreement and to protect products of Indian origin as well. The Indian Parliament has passed the Protection of Plant Varieties and Farmers’ Rights Act with the objective of giving a significant thrust to agricultural growth by providing an effective system for the protection of plant varieties and farmers’ rights. This is expected to stimulate investments for research and development both in the public and the private sectors for the development of new plant varieties by ensuring appropriate returns on such investment. India provides for the protection and enforcement of different fields of intellectual property through both specific national legislation as well as the Code of Civil Procedure and the Code of Criminal Procedure by way of civil remedies and criminal penalties. These provide effective deterrent to the infringement of IPRs. The criminal cases and civil suits for the infringement of IPRs lie in the judicial system for other cases. Services India recognises the importance of the services sector to the economy for higher growth. Hence, the Government’s increased emphasis for efficient performance of the services sector particularly, the infrastructure services, such as telecommunications, banking, insurance, shipping, roads, ports, and air transport. India actively participated in the Uruguay Round Services Negotiations and made commitments in 33 sub-sectors as compared to an average of 23 for developing countries and has accepted enhanced commitments as well. The commitments undertaken have been implemented and in some sectors, like telecommunication, have been fulfilled even before the scheduled date. In line with the agreed Guidelines and Procedures for Negotiations on Trade in services (NGP), India feels that Negotiations should aim to increase the participation of developing countries in the Trade in Services. There should be appropriate flexibility for individual developing country members for progressive liberalisation in line with their development situations and national policy objectives. The positive list approach which is the cornerstone of the General Agreement on Trade in Services (GATS) architecture should be maintained. The Assessment of Trade in Services in overall terms and on a sectoral basis with respect to the objectives of the GATS and Article IV should be carried out by the Council for Trade in Services in Special Sessions. Account should be taken and credit be given in the Negotiations for autonomous liberalisation undertaken by Members since previous Negotiations. The request and offer approach should be the main method of Negotiations. While GATS recognises 'movement of natural persons' as one of the modes of supply of services, the commitments undertaken by the developed countries have very little to offer to the developing countries in terms of opening their markets. The Agreement enjoins the developed countries to take concrete measures aimed at strengthening the domestic service sector of developing countries and providing effective market access in sectors and modes of supply of export interest to developing countries. However, the GATS objectives of increased participation of developing countries in trade in services has hardly been addressed. Therefore, in order to achieve the required balance in GATS and to increase the participation of developing countries in trade in services as per Article IV of GATS, the developed countries should undertake a higher level of commitments in Mode 4, i.e., movement of natural persons and in sectors of export interest to the developing countries. Source : World Trade Organisation: Report on India’s Trade Policy Review, May 2002. |
India and the World Trade Organisation
7.17 India is one of the founding members of the GATT (1947) and the WTO (1995) and favours the multilateral approach to trade relations. India grants Most Favoured Nation (MFN) treatment to all its trading partners. As a member of the WTO, India is committed to ensure that the sectors in which developing countries enjoy a comparative advantage are adequately opened up to international trade. India is also committed to ensure that the Special and Differential Treatment Provisions for developing countries under different WTO Agreements are translated into specific enforceable dispensations. Notwithstanding its commitments, India has maintained that the multilateral system would gain even more if it adequately reflected the concerns of the developing countries. At the Fourth Ministerial Conference at Doha in 2001 India forcefully presented her concerns, which are reflected in the Doha Declaration (Box VII.3). On the four 'Singapore Issues', viz., trade and investment, trade and competition, transparency in Government procurement and trade facilitation, raised at the first Ministerial held in Singapore in 1996, no decision was reached either at this Ministerial or the subsequent two Ministerials held in Geneva and Seattle. However, Working Groups were established to examine each of these four issues in detail. The Doha Declaration states that the study process on these issues would continue until the fifth Ministerial Conference to be held in Mexico and decision regarding any negotiation would be based on explicit consensus. On issues of crucial relevance to India, the Declaration reaffirms that the International Labour Organisation (ILO) is the appropriate forum to address the core labour standards.
Regional Trade Agreements
7.18 The relationship between regionalism and globalisation is an important issue of contemporary interest. Regional Trade Agreements can be trade-creating or trade-diverting and can lead to welfare improvement or deterioration. Arguments exist in theory on both sides on whether unilateral tariff reductions are superior or inferior to granting regional preferential treatment. Some observers believe that the proliferation of regional arrangements in recent years threatens or even undermines the multilateral system while others hold the view that regional trade agreements provide a necessary spur to global liberalisation in the present era (Bhagwati, 1994; Frankel, 1997; Yeung et al, 1999).
7.19 India is a member of a few regional trading agreements within Asia such as the SAARC Preferential Trading Arrangement (SAPTA), the Indian Ocean Rim Association for Regional Cooperation and the BIMST-EC (Bangladesh, India, Myanmar, Sri Lanka, Thailand - Economic Cooperation). Of these, SAARC has been the relatively effective trading arrangement with regard to trading interests. Being a member of SAPTA (SAARC) does not seem to have spurred trade between India and other member countries to the extent that NAFTA benefited Mexico, Mercosur benefited Argentina and ASEAN benefited Malaysia and Thailand. These countries have benefited from the dominant country within the arrangement (e.g., USA in NAFTA) and also from the growing economic growth of the member countries. In the case of regional trading agreements, India has been the dominant member. Moreover, economic performance of the other members in these agreements has also not been conducive to providing significant benefits to India. India’s exports to the SAARC increased marginally during the 1990s and were only 4.6 per cent of total exports in 2001-02 as against 19.0 per cent to other Asian developing countries comprising inter alia Hong Kong, Singapore, Malaysia and South Korea with whom India does not have any trading agreement (Table 7.3). In fact, OECD continues to be the largest market and source for India’s exports and imports, respectively.
Table 7.3: India’s Trade with SAARC Countries | |||||||
(US $ million) | |||||||
Regional | 1990-91 | 1995-96 | 2001-02 | ||||
Groups | Exports | Imports | Exports | Imports | Exports | Imports | |
1 | 2 | 3 | 4 | 5 | 6 | ||
I. | OECD | 10,248.8 | 13,773.0 | 17,705.1 | 19,209.2 | 21,622.1 | 20,640.6 |
Countries | (56.5) | (57.2) | (55.7) | (52.4) | (49.3) | (40.1) | |
II. | Developing | 3,098.7 | 4,490.4 | 9,198.4 | 8145.0 | 13,535.5 | 12,776.4 |
Countries | (17.1) | (18.7) | (28.9) | (22.2) | (30.9) | (24.9) | |
of which: | |||||||
Asia | 2,610.0 | 3,371.9 | 7,307.8 | 6,426.0 | 10,332.7 | 9,264.7 | |
(14.4) | (14.0) | (23.0) | (17.5) | (23.6) | (18.0) | ||
a) | SAARC | 533.4 | 131.4 | 1,720.6 | 256.5 | 2,026.0 | 571.5 |
(3.0) | (0.5) | (5.4) | (0.7) | (4.6) | (1.1) | ||
b) | Other Asian | 2,076.6 | 3,240.5 | 5,587.2 | 6,169.4 | 8,306.6 | 8,693.2 |
Developing | (11.4) | (13.5) | (17.6) | (16.8) | (19.0) | (16.9) | |
Countries | |||||||
Total Trade | 18,145.2 | 24,072.5 | 31,794.9 | 36,675.3 | 43,826.7 | 51,413.3 | |
Source : Directorate General of Commercial Intelligence and Statistics. | |||||||
II. CURRENT ACCOUNT: APPROACH, DEVELOPMENTS AND ISSUES
7.20 Going beyond trade reforms, India moved to full convertibility on current account in August 1994 by liberalising various transactions relating to merchandise trade and invisibles. This has been in consonance with the global trend. Out of 186 IMF member countries, 152 countries had accepted obligations under Article VIII of the IMF, according to which 'no member shall, without the approval of the Fund, impose restrictions on the making of payments and transfers for current international transactions'.
7.21 With the broad approach of growing trade openness and shift in competitiveness towards services exports, India’s current account transactions resulted in a modest current account deficit throughout the 1990s and a surplus in the recent past. A component-wise analysis on merchandise trade and invisibles is presented in this Section with a view to assess the broad approach of policy reforms in this area. As an emerging issue, the issue of current account sustainability has also been analysed.
Trends in Merchandise Trade
7.22 The impact of trade reforms is evident from the changing structure of India’s foreign trade in terms of diversity of markets and products and also in the form of higher degree of trade openness (resulting from higher export growth and the associated increase in the capacity to import).1 Following the various policy initiatives taken by the Government, there was a perceptible improvement in India’s export performance in the initial phase of the reform period - both at the overall level and across commodities. The commodity composition of India’s export basket has changed in favour of technology intensive and industrial products such as, engineering goods, besides high-value agricultural products. The destination profile of India’s exports shows that the developing countries have gained considerable prominence over the years. The commodity composition of imports is affected by various factors such as impact of trade policy, domestic demand and international prices. The sourcing pattern of imports has also changed, mostly in favour of the developing countries.
7.23 Benefits and costs of trade liberalisation are difficult to quantify and attempts to do so yield results that are contingent on the methodology and its pitfalls. However, the benefits of trade liberalisation undertaken during the 1990s are evident in the higher average growth rate of exports during the 1990s at 9.7 per cent as against 8.1 per cent in the 1980s.2 The other benefits were lower commodity price inflation (in the latter half of the 1990s) and higher consumer welfare. The latter in turn, emanated from product quality improvement as well as wider choice in range of most products. The notable feature is that there was remarkable export growth during the first half of the reform period, in particular during the years 1993-94 to 1995-96 with a deceleration in the subsequent years (Chart VII.2). This behaviour can be attributed partly to sluggishness in external demand precipitated by financial crises in some parts of the world and the subsequent weakening of overall world demand and world trade volume (RBI, 1999). Weak exports also reflect growing domination of China in labour intensive manufactured exports, high infrastructure costs, unusually rigid labour laws, reservation for small-scale sector and relatively high regulatory problems (Acharya, 2002).

7.24 Due to higher annual average growth of exports in the 1990s (12.9 per cent) in relation to the average GDP growth of about 6.1 per cent, the contribution of exports to growth in GDP increased modestly. Results of micro-level studies that are based on information collected through sample surveys yield different results with some of them giving a much higher contribution of exports to GDP growth. The results of a study conducted by the Reserve Bank, however, indicate that the contribution of exports to GDP may be much lower when adjusted for imports of raw materials. Such findings need to be asessed in the context of the selection of firms in the sample surveys (Box VII.4).
7.25 The export performance of the East Asian countries has been much better than that of India (Table 7.4). What is remarkable is that these countries maintained continued export growth despite being hit by the Asian crisis. The high average export growth rate in these countries during 1990s was facilitated by the transformation of these countries from producing cheap labour-intensive goods to technology intensive goods, like electronic parts in the case of Malaysia and electrical components in the case of Korea.
Table 7.4: Average Growth Rate of Exports in East Asian Economies vis-a-vis India | |||||||
(Per cent) | |||||||
Country | 1981-90 | 1991-00 | 1991-95 1996-2000 | ||||
1 | 2 | 3 | 4 | ||||
India | 8.1 | 9.7 * | 14.4 # | 3.9 @ | |||
China, P.R. | 13.5 | 15.4 | 19.4 | 11.4 | |||
Korea | 14.5 | 10.6 | 14.3 | 6.9 | |||
Malaysia | 9.5 | 13.3 | 20.3 | 6.2 | |||
Philippines | 4.1 | 17.4 | 16.9 | 18.0 | |||
Singapore | 11.2 | 10.7 | 17.8 | 3.6 | |||
Thailand | 14.5 | 12.1 | 19.7 | 4.4 | |||
* | Average for the years 1990-91 to 1999-2000 excluding1991-92. | ||||||
# | Average for the years 1990-91 to 1995-96 excluding 1991-92. | ||||||
@ | Average for the years 1996-97 to 1999-2000. | ||||||
Note : | Data for India is on fiscal year basis. | ||||||
Sources :. | 1. | Directorate General of Commercial Intelligence and Statistics. | |||||
2. | International Financial Statistics, February 2003. | ||||||
Box VII.4 In order to examine the contribution of the export sector to overall growth of the industrial sector, an internal study was undertaken by the Reserve Bank using the data from the RBI studies on ‘Finances of Public Limited Companies for the period 1975 to 2001’. The study was based on balance sheets of around 1,720-2,131 companies of which 786 to 1,036 companies had reported exports data. For analytical purposes, the companies were grouped into two broad sets: (i) Set I covered companies having exports but may or may not have imports (used mainly to analyse their export potential and net foreign exchange contribution) and (ii) Set II covered companies having both exports and imports (used mainly for analysing contribution of exports adjusted for imports of raw material (value added) to overall sales growth). The analysis of exports contribution to growth for these companies was done in terms of a number of ratios. For example, for the first Set of companies two ratios: (i) exports to sales ratio, and (ii) net foreign exchange earning of industries having exports to total foreign exchange reserves of the country were calculated; the analysis of the second Set of companies was based on three ratios, viz., (i) exports to sales ratio, (ii) imports to sales ratio, and (iii) exports adjusted for imports of raw material to sales ratio. The standard industrial classification was adopted for grouping the companies. During 1975-76 to 2000-01, the share of exports of the companies covered in the study amounted to 17-20 per cent while their share of imports varied from 10.6 – 25.6 per cent of the total non-oil imports of the country during the period. The limitations of the data set used for the study are non-comparability of companies used for each year, annualisation of income and expenditure for some companies due to change in the accounting year and change in industrial classification of a company from year to year depending on the share of a product in total sales. Furthermore, most of these companies are from the manufacturing sector. The results of the study are thus subject to these limitations of data-base. Performance of Set I Companies At the macro level, the performance of companies in Set I in terms of the exports to sales ratio declined from 8.1 per cent in 1975-76 to 6.8 per cent in 1988-89, but at 11.2 per cent witnessed a turnaround in 1994-95 and stood at 15.7 per cent in 2000-01. The net foreign exchange earnings of these companies to total foreign exchange reserves of the country accounted for, on an average basis 10.6 per cent during the 1970s, 2.0 per cent during the 1980s and 1.3 per cent during the 1990s. This declining trend in the net contribution of these companies to country’s foreign exchange reserves was mainly on account of increase in their imports. Industry-wise analysis revealed that within the manufacturing sector the highest contribution was made by the mining and quarrying industry with exports to sales ratio ranging between 10.0 – 79.5 per cent during 1975-76 to 2000-01. The exports to sales ratio of industrial sector, other than manufacturing sector, varied between 16.0 – 31.0 per cent, processing and manufacturing of agriculture and allied activities 11.0 – 27.0 per cent and manufacturing of foodstuffs, tobacco, textiles, etc., 10.7 – 40.9 per cent. Using the revised National Industrial Classification (NIC), 1998 it was observed that the exports to sales ratio of manufacturing of wearing apparels, dressing and dyeing of fur industry was 58 – 80 per cent during the period 1998-99 to 2000-01, while manufacture of furniture was 78 – 81 per cent and tanning and dressing of leathers, manufacture of luggage, handbags, etc. contributed 56 – 63 per cent. Performance of Set II Companies The exports to sales ratio of companies having both exports and imports revealed a more or less similar trend to those of companies having exports (Set I) and varied between 6.6 – 15.6 per cent. The imports to sales ratio, however, increased steadily from 4.6 per cent in 1975-76 to 14.7 per cent in 1996-97, but declined to 12.4 per cent in 2000-01. Consequently, when exports adjusted for imports of raw material are used for calculating exports to sales ratio, the contribution of this group in terms of sales ratio was meagre and ranged between a negative 0.4 per cent to 6.4 per cent during 1975-76 to 2000-01. Thus, contrary to the perception in the industrial circle of export sector’s contribution to overall growth of the economy of 25 per cent during the last decade, the exports adjusted for imports of raw material to sales ratio was far less. The country’s exports at a macro level, including re-exports not adjusted for value added, contributed around 18.4 per cent to GDP growth in nominal dollar terms during the 1990s. However, when the exports of the industries covered in the study are anlysed with due adjustments for imports of raw material (value added), the exports to sales ratio was much less at 3.7 per cent on an annual average basis during the 1990s. Industry-wise analysis revealed that ratio of exports to sales of manufacturing of mining and quarrying was the highest (10 - 77 per cent during 1975-76 to 2000-01), while the ratio for processing and manufacturing of foodstuffs, tobacco and textiles ranged between 9- 41 per cent and that of other industrial group fluctuated between 13 - 26 per cent. The ratio in respect of processing and manufacturing of agriculture and allied activities ranged between 7- 30 per cent and was 6 - 19 per cent for manufacturing of metals, chemicals and products. Exports Contribution to Sales Growth Overall export contribution of the industries to their sales growth for Set I companies stood at 5.7 per cent during the 1970s, increased to 8.9 per cent during the 1980s and increased further significantly to 18.7 per cent during the 1990s. During 1975-76 to 2000-01, the export contribution of these industries to their overall sales growth stood at 16.0 per cent. The contribution of exports to sales growth during the last two years was substantially higher at 23.1 per cent for these industries. The contribution of exports adjusted for imports of raw materials to their sales growth depicted a dismal picture at a negative 0.3 per cent during the 1970s which increased marginally to 1.5 per cent during the 1980s. However, during the 1990s, the exports adjusted for imports of raw materials to sales growth of these industries stood at 8.4 per cent, which was mainly due to higher exports contribution of 12.0 per cent during the last two years. |
7.26 The average import growth in India which was 7.2 per cent (in US dollar terms) during the 1980s increased to 12.9 per cent during the 1990s. Imports during the period 1990-91 to 1995-96 (excluding 1991-92) experienced an average growth rate of 16.7 per cent, reflecting largely the strong industrial growth during the period (Chart VII.2). Subsequently, in the remainder of the 1990s the average growth rate fell drastically to 8.0 per cent and further to 1.7 per cent during both 2000-01 and 2001-02, due to the slowdown in economic activity (RBI, 2002). The slow growth in imports is a cause for concern as it has a direct bearing on the exports of capital-intensive goods. Interestingly, India’s import growth during the 1990s was lower than that of China but higher than that of the other East Asian countries (Table 7.5).
Table 7.5: Average Growth Rate of Imports in East Asian Economies vis-a-vis India | |||||||
(Per cent) | |||||||
Country | 1981-1990 | 1991-2000 | 1991-1995 | 1996-2000 | |||
1 | 2 | 3 | 4 | ||||
India | 7.2 | 12.9* | 16.7# | 8.0 @ | |||
China, P.R. | 11.9 | 16.1 | 20.1 | 12.0 | |||
Korea | 12.7 | 10.8 | 14.7 | 6.9 | |||
Malaysia | 11.7 | 12.3 | 21.9 | 2.6 | |||
Philippines | 6.1 | 10.9 | 17.3 | 4.5 | |||
Singapore | 10.5 | 9.0 | 15.6 | 2.5 | |||
Thailand | 15.6 | 8.1 | 16.7 | -0.5 | |||
* | Average for the years 1990-91 to 1999-2000 excluding1991-92. | ||||||
# | Average for the years 1990-91 to 1995-96 excluding 1991-92. | ||||||
@ | Average for the years 1996-97 to 1999-2000. | ||||||
Note | Data for India is on fiscal year basis. | ||||||
Sources | 1. | Directorate General of Commercial Intelligence and Statistics. | |||||
2. | International Financial Statistics, February 2003. | ||||||
7.27 The ratio of exports to GDP increased from an average of 4.6 per cent during the 1980s to 8.0 per cent during the 1990s (excluding the year 1991-92) which represents an increase in export orientation of the economy by 3.4 percentage points of GDP over one decade. Similarly, imports as a proportion of GDP increased from 7.2 per cent during the 1980s to 9.5 per cent during the 1990s. India’s total merchandise trade, an indicator of the degree of openness of an economy, increased from about 11.8 per cent of GDP in the 1980s to 17.4 per cent during the 1990s (Table 7.6 and Chart VII.3).

7.28 The average export-import ratio, an indicator of the import financing capacity of exports, improved sharply from 64.0 per cent to 84.1 per cent, between the 1980s and 1990s and further increased to 85.2 per cent in 2001-02 (Table 7.6 and Chart VII.4). During the 1980s, the export-import ratio was as high as 115.5 per cent for Malaysia and 93.4 per cent for China. During the 1990s, the ratio for these countries – at 112.0 per cent for China and 106.8 per cent for Malaysia – was still higher than that for India. The exports of these countries thus, more than compensated for higher imports.

Table 7.6: India’s Foreign Trade Ratios | |||||||
(Per cent) | |||||||
Period Average | X/GDP | M/GDP | T/GDP | X/M | |||
1 | 2 | 3 | 4 | ||||
1980-81 to 1989-90 | 4.6 | 7.2 | 11.8 | 64.0 | |||
1990-91 to 1999-00* | 8.0 | 9.5 | 17.4 | 84.1 | |||
1990-91 to1994-95 * | 7.3 | 8.4 | 15.7 | 86.9 | |||
1995-96 to 1999-00 | 8.5 | 10.4 | 18.9 | 81.8 | |||
2000-01 to 2001-02 | 9.4 | 10.8 | 20.2 | 86.7 | |||
* | Excluding 1991-92. | ||||||
Note : | X=Exports, GDP=Gross Domestic Product at current market prices in rupees. | ||||||
Sources : | 1. | Directorate General of Commercial Intelligence& Statistics. | |||||
2. | Economic Survey, Government of India. | ||||||
7.29 India’s net terms of trade, which measure the relative change in export and import prices have been generally fluctuating during the 1990s. Import purchasing power of exports as measured by the income terms of trade have consistently improved during the 1990s on account of strong export, growth in volume terms.3 The income terms of trade, increased on an average from 141.5 in the 1980s to 439.4 in the 1990s and further to 743.2 in 2001-02 (Chart VII.5).

7.30 Diversification of exports constitutes an important element of India’s export promotion strategy. Reflecting the policy thrust as also the evolving pattern of industrial development, India has gradually transformed from a predominantly primary products exporting country into an exporter of manufactured goods. However, it may be noted that this was more prominent in the 1970s. The progress has, however, stalled thereafter. Aided by various export promotion measures, the share of ‘manufactured goods’ in India’s total exports increased from 70.7 per cent during 1987-90 to 75.3 per cent during 1992-97 and further to 77.4 per cent during 1997-2002.4 Exports of petroleum products have also increased in the recent years (Chart VII.6). The commodity composition within the major groups has also undergone a considerable transformation. Within the ‘primary products’ group, the share of ‘ores and minerals’ in total exports has declined while the share of ‘agricultural and allied products’ remained almost unchanged at around 18 per cent between 1990-91 and 1998-99 but declined thereafter to 13.4 per cent in 2000-01. The falling share of ‘ores and minerals’ has been offset by the increase in share of ‘engineering goods’ within the manufactured products group - an indication of upward movement of India’s exports in the value-addition chain. Similarly, exports of processed agricultural products also showed marked improvement in the post-reform years whereas the shares of traditional export items such as tea, coffee, cereals, handicrafts and carpets declined. Among other major manufactured products, the share of ‘chemicals and allied products’ has improved while that of ‘leather and manufactures’ has declined between the years 1990-91 and 2001-02 (Table 7.7 and Chart VII.6).

Table 7.7: Average Share of Exports of Selected Commodities | ||||
(Per cent) | ||||
Category | 1987-90 | 1990-91 | 1992-97 | 1997-02 |
1 | 2 | 3 | 4 | |
Primary Products | 24.2 | 23.8 | 21.9 | 18.5 |
Manufactured Goods | 70.7 | 71.6 | 75.3 | 77.4 |
of which: | ||||
Leather and Manufactures | 7.5 | 8.0 | 5.8 | 4.6 |
Chemicals and Allied | 5.9 | 7.2 | 7.2 | 9.1 |
Products | ||||
Engineering Goods | 11.0 | 12.4 | 13.8 | 14.7 |
Readymade Garments | 11.2 | 12.3 | 12.0 | 12.2 |
Textile Yarn, Fabrics, | 8.0 | 8.5 | 10.9 | 11.2 |
Made-ups | ||||
Handicrafts including | 22.6 | 18.9 | 19.7 | 20.1 |
Gems and Jewellery | ||||
Petroleum Products | 3.1 | 2.9 | 1.8 | 2.1 |
Source : Directorate General of Commercial Intelligence and Statistics. | ||||
7.31 The areas in which South-East Asian countries have achieved their highest export growth during the 1980s have been typically labour intensive, relatively low technology products such as textiles, clothing, shoes, toys, sport goods and the like. Subsequently, during the 1990s they have graduated up to somewhat higher technology consumer goods and then even higher technology and capital-intensive sectors such as capital goods and petro-chemicals. Over the same period, the Indian export pattern has remained stationary with persistent dominance of labour-intensive low technology products such as clothing, textiles, shoes and other leather goods. Adequate quality upgradation has been absent and unit prices have stagnated. The attainment of both higher volume growth and of higher unit value realisation will require both larger scale of operation and higher quality. It is, therefore, essential to loosen constraints in these sectors so that they can grow freely in volume, utilise better machinery, graduate up to higher technology levels, and utilise better international marketing channels. What is observed in other countries in Asia is that production of such consumer goods may be achieved through final assembly operations that are large in scale, but where a great deal of out-sourcing to small enterprises is undertaken to preserve their competitiveness. Consequently, freeing of restrictions on the size of small-scale industries through de-reservation is likely to lead to the growth of many more small-scale enterprises than is currently the case, along with a much higher potential for growth in manufacturing employment (Mohan, 2002).
7.32 Destination-wise analysis of the Indian exports indicates an unchanged position in respect of the Organisation for Economic Cooperation and Development (OECD) group being the largest market, increasing prominence of the Organisation of Petroleum Exporting Countries (OPEC) and the developing countries (Asia, Africa and Latin America), and a steep erosion in the relative position of the Eastern Europe. With the break-up of the Soviet Union, the share of the East European countries fell dramatically from 17.9 per cent in 1990-91 to just 2.9 per cent in 2001-02, primarily on account of the termination of Rupee trade and its adverse impact on exports of agricultural products such as tea, tobacco and spices to this region. The loss of this market share was, however, made up by increasing the shares in developing countries and the OPEC region, both of which doubled between the years 1987-88 and 2001-02 (Table 7.8 and Chart VII.7).

Table 7.8: Direction of India’s Foreign Trade - Share in Total Exports | ||||||||
(Per cent) | ||||||||
Group / Country | 1987- | 1990- | 1995- | 1999- | 2000- | 2001- | ||
1988 | 1991 | 1996 | 2000 | 2001 | 2002 | |||
1 | 2 | 3 | 4 | 5 | 6 | |||
I. | O E C D Countries | 58.9 | 56.5 | 55.7 | 57.3 | 52.7 | 49.3 | |
of which: | ||||||||
a. | E U | 25.1 | 27.5 | 27.4 | 25.5 | 23.4 | 22.5 | |
b. | North America | 19.7 | 15.6 | 18.3 | 24.4 | 22.4 | 20.8 | |
of which: | ||||||||
U S A | 18.6 | 14.7 | 17.4 | 22.8 | 20.9 | 19.4 | ||
c. | Asia and Oceania | 11.6 | 10.4 | 8.3 | 5.8 | 5.1 | 4.5 | |
d. | Other O E C D | 2.5 | 3.0 | 1.6 | 1.6 | 1.9 | 1.6 | |
Countries | ||||||||
II. | O P E C | 6.1 | 5.6 | 9.7 | 10.6 | 10.9 | 11.9 | |
III. | Eastern Europe | 16.5 | 17.9 | 4.2 | 3.5 | 3.0 | 2.9 | |
IV. | Developing Countries | 14.2 | 17.1 | 28.9 | 28.4 | 29.2 | 30.9 | |
a. | Asia | 11.9 | 14.4 | 23.0 | 22.3 | 22.5 | 23.6 | |
b. | Africa | 2.0 | 2.2 | 4.8 | 4.2 | 4.4 | 5.2 | |
c. | Latin American | 0.3 | 0.5 | 1.2 | 1.9 | 2.3 | 2.1 | |
Countries | ||||||||
Source : Directorate General of Commercial Intelligence and Statistics. | ||||||||
7.33 India’s export share in world trade has increased perceptibly during the recent period. India’s exports as a percentage of world exports improved to 0.56 per cent during 1991-96 and further to 0.65 per cent during 1996-2002 from 0.48 per cent in the 1980s. The ratio was 0.71 per cent in 2000-01, the highest achieved so far since the 1970s. Nonetheless, India’s share in world exports is still very low and appears unimpressive when compared with the other major trading Asian countries, such as, China and other East Asian economies like Malaysia, Thailand, Singapore, Korea and Indonesia (Table 7.9 and Chart VII.8). China demonstrated the most dramatic change as its share in world exports more than doubled in a decade from 2.0 per cent in 1991 to 4.4 per cent in 2001. Group-wise, India’s share in the imports of industrialised countries in the 1990s declined as compared to that in 1986. In respect of the developing countries as a group, however, it has increased from 0.5 per cent in 1986 to 1.1 per cent during 1996-2000 (Table 7.10).

Table 7.9: Share of Select East Asian Countries in World Exports | |||||||
(Per cent) | |||||||
Annual | Average | ||||||
Country | 1991 | 1995 | 1999 | 2000 | 2001 | 1991- | 1996- |
1995 | 2000 | ||||||
1 | 2 | 3 | 4 | 5 | 6 | 7 | |
India | 0.5 | 0.6 | 0.6 | 0.7 | 0.7 | 0.6 | 0.6 |
China | 2.0 | 2.9 | 3.5 | 4.0 | 4.4 | 2.5 | 3.4 |
Indonesia | 0.8 | 0.9 | 0.9 | 1.0 | 0.9 | 0.9 | 0.9 |
Korea | 2.0 | 2.4 | 2.6 | 2.7 | 2.5 | 3.0 | 2.5 |
Malaysia | 1.0 | 1.4 | 1.5 | 1.6 | 1.4 | 1.2 | 1.5 |
Singapore | 1.7 | 2.3 | 2.0 | 2.8 | 2.0 | 2.0 | 2.3 |
Thailand | 0.8 | 1.1 | 1.0 | 1.0 | 2.0 | 1.0 | 1.0 |
Source : International Financial Statistics, February 2003. | |||||||
Table 7.10: India’s Share in World Imports and in Imports of Major Trading Partners | |||||
(Per cent) | |||||
Annual | Average | ||||
Group/Country | 1981 | 1986 | 1990 | 1991- | 1996- |
1995 | 2000 | ||||
1 | 2 | 3 | 4 | 5 | |
World | 0.5 | 0.7 | 0.6 | 0.6 | 0.7 |
Industrial Countries | 0.4 | 0.6 | 0.5 | 0.5 | 0.5 |
of which: | |||||
United States | 0.5 | 0.6 | 0.7 | 0.8 | 0.9 |
Japan | 0.7 | 1.0 | 0.9 | 0.9 | 0.8 |
Belgium | 0.3 | 0.4 | 0.6 | 0.6 | 0.8 |
Italy | 0.2 | 0.2 | 0.4 | 0.5 | 0.6 |
Germany | 0.3 | 0.3 | 0.5 | 0.5 | 0.5 |
United Kingdom | 0.6 | 0.5 | 0.6 | 0.8 | 0.8 |
Developing Countries | 1.1 | 0.5 | 0.9 | 0.8 | 1.1 |
of which: | |||||
Malaysia | 0.7 | 0.8 | 0.7 | 0.8 | 0.9 |
Singapore | 0.5 | 0.6 | 0.6 | 0.7 | 0.7 |
Thailand | 4.0 | 0.6 | 1.6 | 1.3 | 1.0 |
Bangladesh | 0.3 | 2.2 | 4.6 | 9.6 | 12.9 |
Source : Direction of Trade Statistics, IMF various issues. | |||||
7.34 The commodity-structure of India’s imports has also shown marked changes, reflecting, inter alia, the impact of trade policy, the movements in international prices and the pattern of domestic demand. The share of oil imports in India’s total imports increased from 17.1 per cent during 1987-90 to 23.9 per cent during 1992-97 and further to 27.2 per cent in 2001-02 (Chart VII.9). While the share and absolute value of these imports showed sharp fluctuations over the years mainly on account of the large movements in international crude prices, the volume of such imports has grown significantly on account of increase in domestic consumption and the stagnation in domestic crude oil production. Given the large swings in international crude prices, as also a trend rise in the oil import bill, there is a need for a comprehensive review of energy policy of the country covering the demand-supply aspects, as well as the price policy. Renewed efforts to improve energy supply from domestic sources by encouraging explorations, and stepping up of production and refining capacities are necessary to bring about a structural change in this area.
7.35 Reflecting the impact of a series of policy measures undertaken in the post-reform years starting with the repeal of the Gold Control Order in 1991 for liberalising the imports of gold and silver, these imports showed a sharp pick-up from 1992-93. The imports of gold and silver (including passenger baggage) rose from a meagre US $ 6 million in 1991-92 to US $ 1.3 billion in 1992-93 and further to US $ 5.9 billion in 1997-98. A large part of the increase in these imports could be due to a switchover from the unofficial channel to the official channel, initially through the Non-Resident Indian (NRI) baggage route and subsequently through the OGL route.5 In the subsequent years, however, these imports have stabilised and, in fact, declined to US $ 4.6 billion in 2001-02.
7.36 Imports of capital goods registered sharp increases in the initial reform years from US $ 4.5 billion in 1992-93 to US $ 10.3 billion in 1995-96, but exhibited a declining trend thereafter. The share of these imports, which had declined from 29.5 per cent in 1987-88 to 24.2 per cent in 1990-91, rose in the post-reform period to 28.2 per cent in 1995-96 but dropped to 18.1 per cent in 2001-02, reflecting the lack of investment demand associated with the sluggish pace of domestic industrial activity (Chart VII.9). Among other import items, the relative shares of fertilisers, non-ferrous metals, ‘metalliferrous ores and metal scrap’ and ‘iron and steel’ generally showed a declining trend.

7.37 There are noticeable changes in the sources of India’s imports and in country shares.6 The share of the OECD countries and the Eastern Europe in India’s imports declined between the years 1987-88 and 1999-2000 while that of the developing countries and the OPEC group increased during the same period. The share of India’s imports from the OPEC region rose significantly to 25.9 per cent in 1999-2000 from 16.3 per cent in 1990-91, mainly on account of the increase in the oil imports (Chart VII.10).

7.38 The Ministry of Commerce and Industry, Government of India has set an export target of 1 per cent share of world exports by 2006-07 for the medium-term which would be co-terminus with the Tenth Five Year Plan. This target is based on historical trends, current prospects and the requirement of a compound annual growth rate of about 12 per cent for exports till the year 2006-07 (Government of India, 2002a). The export performance is known to depend on price competitiveness, as well as non-price factors. As regards the price competitiveness, a number of earlier studies have emphasised that real exchange rate may be an important variable influencing the price competitiveness of India’s exports. In India, large exchange rate misalignment has not occured in the last one decade as the market itself has corrected the misalignment gradually over different episodes. The strong performance of the software exports, however, has created concerns about a possible 'Dutch disease' effect which may erode the competitiveness of traditional exports.7 The export performance across commodity groups shows that most of the export groups have performed well so far, and apparently have not been affected by any 'Dutch disease' effect. In a market determined exchange rate regime, exchange rate cannot be used as an instrument of export promotion, even though, at times, nominal appreciation could be prevented consistent with the overall exchange rate policy of the country. If the exporters retain the depreciation induced profits, they cannot improve their price competitiveness and therefore, exports may not increase despite a depreciation. In the Indian context, studies show that there has been an upward movement in exchange rate pass-through for India’s exports.8 While Patra and Pattanaik (1994) estimate the co-efficient (during 1970-71 to 1992-93) at 43 per cent, Dholakia and Saradhi (2000) placed this figure at 30 per cent prior to 1991 and at 70 per cent after 1991.
7.39 Some of the recent studies have analysed the role of non-price factors vis-à-vis the price factors. Studies analysing the factors contributing to the competitiveness of India’s exports have observed that non-price factors play a more important role (Marjit and Raychaudhuri, 1997). Another study observed an inverse relationship between depreciation of exchange rate of rupee and trade competitiveness, and also emphasised the role of other factors like quality, product design, reliability and after sales service in raising trade competitiveness (Bhatt, 2000).
7.40 India’s export performance is affected by domestic as well as external impediments. The domestic factors inhibiting India’s export growth, as mentioned earlier, inter alia are infrastructure constraints, high transactions cost, small-scale industry reservations, inflexibilities in labour laws, lack of quality consciousness and constraints in attracting FDI in the export sector. High levels of protection in relation to other countries also explain why FDI in India has been much more oriented to the protected domestic market, rather than as a base for exports (Ahluwalia, 2002). The exports of developing countries like India are facing increasing difficulties by emerging protectionist sentiments in some sectors in the form of technical standards, environmental and social concerns besides non-trade barriers like anti-dumping duties, countervailing duties, safeguard measures and sanitary and phyto-sanitary measures. Indian products which have been affected by such barriers include floriculture products, textiles, pharmaceuticals, marine products and basmati rice exports to the European Union and mushroom and steel exports to USA and also grapes, egg products, gherkins, honey, meat products, milk products, tea, and spices. Differential tariffs against developing countries have also adversely affected market access into these countries (Government of India, 2002b; WTO, 2002). According to the WTO, exports from India are currently subject to 40 anti-dumping and 13 countervailing measures mainly for agricultural products, textiles and clothing products and chemicals and related products. This brings into focus the importance of non-price factors like quality, packaging and the like mentioned earlier, where India still seems to be lacking as compared to the international standards. This has adversely affected India’s export performance vis-à-vis other developing countries which may have an improved standing in these non-price factors.
7.41 To sum up, India’s external trade reforms have been quite comprehensive. The protection given to domestic industries has been reduced by way of the reduction in tariff levels. However, the pace of tariff reduction needs to be accelerated (subject to revenue constraints). The tariff levels in India are still among the highest in the world. The evidence from 1991-97 and 2001-2003 suggests that faster tariff reduction is good for industry. India has completely dismantled its quantitative restrictions except for a few items. Various export promotion schemes have been put in place. In the area of multilateral commitments the progress has been satisfactory. The concerns of developing countries as voiced by India in the WTO are being considered. India is making progress on the negotiations on Services and on several issues which are in the process of study. Reforms in the trade sector have also been notable as clearly seen from the increase in India’s trade-GDP ratio. There has been a steady increase in the growth rate of exports and imports as compared with the 1980s. The export-GDP ratio has almost doubled from that in the 1980s. The rising export-import ratio is indicative of the improvement in financing capacity of exports. India’s share in world exports has been rising and in 2001, this ratio was the highest achieved so far since the 1970s. There has been a discernible shift in India’s composition of exports with overall diversification of exports. The share of manufactured goods has shown an improvement driven by the increasing share of chemical and allied products, engineering goods, textiles and handicrafts including gems and jewellery. Imports have been driven by an increase in the imports of mainly export-related items like pearls, precious and semi-precious stones and electronic goods. India has also been successful in diversifying its export market increasingly to the developing countries alongwith the OECD emerging as the largest market for India’s exports. A notable feature is that despite the loss of the East European market after the break-up of the Soviet Union, India made a safe transition to other markets like developing countries of Asia and to the OPEC.
Trends in Invisibles
7.42 One of the most significant developments in the current account of balance of payments in the 1990s was the remarkable growth in services transactions with the rest of the world, which was made possible by the revolution in information and communication technology. The information and communication related services (services relating to computer software, hardware, internet, e-commerce and telecommunication sector) experienced unprecedented growth during the last decade, outstripping the growth in merchandise trade. Reflecting the growing importance of trade in services, the General Agreement on Trade in Services (GATS) was adopted in 1993 to extend multilateral rules and discipline to services trade, with particular emphasis on non-discrimination and prohibition of quantitative restrictions. The Reserve Bank has undertaken several measures to relax payments restrictions on transactions pertaining to trade in services and other invisible transactions.
7.43 With the shift in the competitiveness towards services, in particular the technology related services, India has emerged as one of the fastest growing exporters of services in the world outstripping the growth rate of industrial countries as well as all countries taken together (Chart VII.11) (RBI, 2002a). Reflecting this, gross invisible receipts (comprising services, transfers and income) increased from US $ 7.5 billion (29 per cent of total current receipts) in 1990-91 to US $ 35.6 billion (44 per cent of total current receipts) in 2001-02. Among the various items of invisible receipts, services increased from US $ 4.6 billion (18 per cent of total current receipts) in 1990-91 to US $ 20.3 billion (25 per cent of total current receipts) in 2001-02. Within services, miscellaneous services receipts, which encompasses communication services, construction services, financial services, software services, news-agency services, royalties, copyright and license fees, management services and others, increased from US $ 2.0 billion in 1990-91 to US $ 14.7 billion in 2001-02, representing 41.2 per cent of invisible receipts in 2001-02. Software services have shown spectacular growth while also emerging as the most important source of miscellaneous services earnings. Software exports increased from US $ 0.3 billion in 1993-94 to US $ 1.8 billion in 1997-98 and further to US $ 7.2 billion in 2001-02, with its share rising from 2.9 per cent to 20.1 per cent of total invisibles receipts during this period. Reflecting the strong growth emanating from software exports, the traditional sources of services exports, viz., travel and transportation have declined in relative importance. Following the heavy inflow of invisibles receipts, India’s current account deficit narrowed down considerably during the decade of the 1990s. The receipts and payments on account of various categories of current account transactions as a percentage of GDP are presented in Table 7.11.

Sustainability of Current Account
7.44 One of the factors underlying the external payments crisis of 1991 was the high levels of current account deficit (CAD) maintained during the 1980s which at the time of the crisis had reached 3.1 per cent of GDP, well above the sustainable level for India (Cerra and Saxena, 2002). Concerted efforts directed at imparting strength and stability to the external sector emphasised a policy of maintaining the CAD within a sustainable level of about 2 per cent.9 This is broadly in line with the recommendations of the High Level Committee on Balance of Payments (RBI, 1993), which recommended that CAD-GDP ratio could be sustainable at 1.6 per cent. The current account deficit averaged only about 1.0 per cent of GDP during the last decade (1992-2002), as compared with 1.8 per cent in the 1980s, and recorded a surplus in 2001-02 after a period of 23 years. Among the components of current account, while the trade deficit (BoP basis) declined marginally from 3.2 per cent of GDP during the 1980s to 3.0 per cent during 1992-2002, the invisibles surplus increased significantly from 1.4 per cent of GDP to 2.1 per cent over the same period(Chart VII.12). With the narrowing of the current account deficit in the recent years, there is a need for revisiting the issue of sustainability of current account in the Indian context.
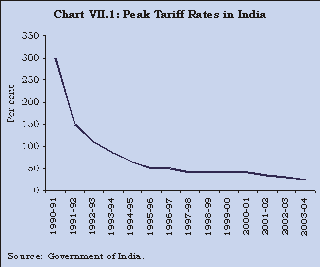
Table 7.11: Invisibles by Category of Transactions | ||||||
(Per cent of GDP) | ||||||
Items | 1990– | 1995– | 1999- | 2000- | 2001- | |
91 | 96 | 00 | 01 | 02 | ||
1 | 2 | 3 | 4 | 5 | ||
Invisibles Receipts | 2.4 | 5.0 | 6.8 | 7.5 | 7.4 | |
Invisibles Payments | 2.4 | 3.5 | 3.8 | 4.9 | 4.5 | |
of which | ||||||
I. | Non–Factor Services | |||||
Receipts | 1.4 | 2.1 | 3.5 | 4.1 | 4.2 | |
Non–Factor Services | ||||||
Payments | 1.1 | 2.1 | 2.6 | 3.6 | 3.3 | |
of which: | ||||||
i) Travel Receipts | 0.5 | 0.8 | 0.7 | 0.7 | 0.6 | |
Travel Payments | 0.1 | 0.3 | 0.5 | 0.6 | 0.5 | |
ii) Transportation Receipts | 0.3 | 0.6 | 0.4 | 0.4 | 0.4 | |
Transportation Payments | 0.3 | 0.6 | 0.5 | 0.7 | 0.5 | |
iii) Insurance Receipts | — | 0.1 | 0.1 | 0.1 | 0.1 | |
Insurance Payments | — | — | — | — | 0.1 | |
iv) G.n.i.e. Receipts | — | — | 0.1 | 0.1 | 0.1 | |
G.n.i.e. Payments | 0.1 | 0.1 | 0.1 | 0.1 | 0.1 | |
v) Miscellaneous Receipts | 0.6 | 0.7 | 2.3 | 2.8 | 3.0 | |
Miscellaneous Payments | 0.6 | 1.1 | 1.5 | 2.2 | 2.3 | |
II. | Income Receipts | 0.1 | 0.4 | 0.4 | 0.5 | 0.6 |
Income Payments | 1.3 | 1.3 | 1.2 | 1.3 | 1.1 | |
III. | Private Transfers Receipts | 0.7 | 2.4 | 2.8 | 2.8 | 2.5 |
Private Transfers Payments | — | — | — | — | — | |
IV. | Official Transfers Receipts | 0.1 | 0.1 | 0.1 | 0.1 | 0.1 |
Official Transfers Payments | — | — | — | — | — | |
Note : G.n.i.e. – Government not included elsewhere. | ||||||
Miscellaneous : 1. Communication Services, 2. Construction Services, 3. Financial Services, 4. Software Services, 5. News Agency Services, 6. Royalties, Copyright and Licence Fees, 7. Management Services, 8. Other Services (Advertising, Rentals, Office Maintainance, Prizes, Exhibition and other services not enumerated elsewhere). | ||||||
The definitions of the items are given in February 2003 issue ofthe RBI Bulletin. | ||||||
— Negligible. | ||||||
1. A detailed analysis of compositional and directional trends in India’s foreign trade has been presented in the Report on Currency and Finance, Reserve Bank of India, 1998-99.
2. The year 1991-92, being an exceptional year on account of the strain witnessed on the balance-of-payments that led to imposition of temporary import restrictions, is excluded when taking an average of the growth rate in the 1990s.
3. Income terms of trade
= (Net terms of Trade * Volume Index of Exports) / 100
= (Unit Value Index of Exports * Volume Index of Exports) / Unit Value Index of Imports
4.Taking into account the change in the system of commodity-classification adopted by the Directorate General of Commercial Intelligence and Statistics (DGCI&S) in 1987-88, the disaggregated data on exports and imports before and after that year are not strictly comparable. Therefore, the analysis focuses on the period 1987-88 onwards.
5. See Box VI.1 on Non-Monetary Gold in Annual Report of the Reserve Bank of India, 1998-99 for details.
6. It may be mentioned that country-wise data on imports for 2000-01 and 2001-02 are not strictly comparable with those for the previous years, as country-wise break-up of imports of petroleum and petroleum products comprising around 30 per cent of total imports are not available separately.
7. The paradoxical role of natural resources is the crux of the Dutch disease. It refers to the adverse effects on the manufacturing sector of natural discoveries. In a more general form, the Dutch disease explains the coexistence with the traded goods sector of progressing and declining sectors. In other words, this refers to the decline in traditional industries brought about by the rapid growth and prosperity of a new industry. There is a concern expressed in some quarters that due to large inflow of remittances and major and sustained spurt in software exports, India’s exchange rate could appreciate considerably and, thereby, erode the competitiveness of most other traditional exports. This could give rise to the ‘Dutch disease’ problem in India. This issue has been analysed in paragraph 7.125.
8. The efficacy of exchange rate depreciation on export performance depends to a large extent on the magnitude of the pass through co-efficient, which indicates the percentage of profit resulting from a depreciation that is passed on by the domestic exporters to the foreign importers.
9. As mentioned in the subsequent Annual Reports since 1996-97.

Share this page:


Install the RBI mobile application and get quick access to the latest news!
Scan the QR code to install our app


Page Last Updated on:


