 IST,
IST,
VII. Macroeconomic Outlook
Growth faces increased pressure from both moderation in investment demand and an uncertain global environment. Surveys on business expectations show that business conditions and sentiments remain subdued. Transitory factors have helped moderate inflation, but inflation is likely to turn sticky in 2012-13. The balance of risk is on the upside due to significant suppressed inflation and high oil prices. As such, while addressing the slackening growth and investment demand is a policy challenge, inflation and other macroeconomic risks have to be kept firmly in mind. Modest recovery likely in 2012-13 VII.1 The recent firming up of growth fundamentals in the US coupled with policy measures in the euro area have helped abate fears of a double dip recession in the advanced economies (AEs). This has helped stabilise the troubled global financial markets. Nevertheless, signs of a mild recession in the euro area, slowdown in emerging and developing economies (EDEs) including China, and surging crude oil prices bring to the fore risks to recovery in global growth and inflation. High liquidity from the extended easy monetary policy regimes globally has associated risks for capital flows to the EDEs. VII.2 The Reserve Bank, in its Mid-Quarter Monetary Policy Review on March 15, 2012 gave indications of peaking of the interest rates cycle in line with the evolving growth inflation dynamics. Also, the structural liquidity deficit in the system necessitated a 125 bps cut in CRR in Q4 of 2011-12. Although, global developments since then have been more on the positive side, in view of the slackening domestic growth consequent upon weak pipeline investment and supply-side bottlenecks, the near-term prospects for growth suggest, at best, room for a modest acceleration. VII.3 Early forecasts by international weather agencies regarding the South-West monsoon present a mixed picture. The Reserve Bank’s own assessment of leading indicators based on land/ocean temperatures to predict India’s South-West monsoon suggests that the 2012 monsoon may be normal. However, a clearer picture will emerge after the forecast by the India Meteorological Department (IMD). With the likelihood of a normal monsoon and a low base, the prospects for agriculture growth during 2012-13 are encouraging. VII.4 A revival in the industrial sector hinges on the impetus to ease supply-side constraints, especially the energy and mineral deficits, and revive investment demand. The easing of inflationary pressures, government initiatives to revive the power sector, some improvement in investment demand and revival in external demand on the back of the improved global outlook could help revive the growth momentum. However, the overall slack may prevail in short- term, in the face of poor investment demand. VII.5 Services sector growth is likely to be conditioned by the revival in global demand and pickup in industrial growth. Overall, services growth may stay largely resilient, though some spillover may occur from the slow pace of industrial growth. Road tendering by National Highways Authority (NHAI) has proceeded at a brisk pace in 2011-12 and investment driven by road sector is expected to pick up in 2012-13. With this, construction activity including housing could improve, especially in the hinterland of new highways, as execution of tendered road projects picks up. Inflation risks remain significant VII.6 Headline WPI inflation has declined since December 2011 largely on account of transitory factors including a favourable base effect and seasonal decline in vegetable prices, broadly in line with the Reserve Bank’s indicative trajectory.
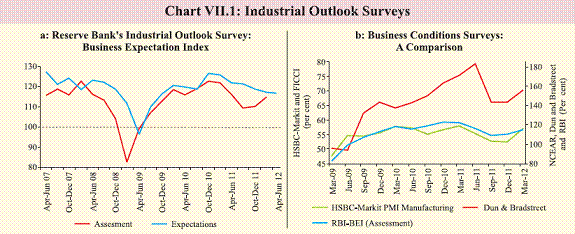
VII.7 Risks from high crude oil prices and the impact of the lagged pass-through of rupee depreciation, suppressed inflation in energy and fertilisers and possible fiscal slippage, however, continue to pose significant threat. Unless significant measures are put in place to address the unsustainable levels of suppressed inflation, the risks to inflation stay active, inter alia, compounded also by the sustained wage pressures and the structural protein food inflation. VII.8 The upside risks to inflation on the one hand and the depressed domestic growth outlook on the other, warrant calibrated measures to maintain a sustainable balance in a dynamic growth-inflation scenario. Business expectations, industrial outlook surveys suggest mixed trend VII.9 Recent surveys conducted by different agencies indicate mixed trends in business climate. The latest NCAER survey shows a noticeable pick up in business confidence from the previous period of survey. However, the Dun & Bradstreet index for Q1 of 2012-13 points to declining business optimism (Table VII.1). VII.10 The seasonally adjusted HSBC Markit Purchasing Managers’ Indices (PMI) for both manufacturing and services (March 2012) exhibited sustained expansion though at a decelerating rate, despite a moderate rise in the new orders received during the month. The PMIs also indicate an increase in job creation. Input cost pressures, however, remained strong.
Industrial Outlook Survey indicates some improvement in Q4 of 2011-12 VII.11 The Reserve Bank’s 57th round of the Industrial Outlook Survey (/en/web/rbi/-/publications/quarterly-industrial-outlook-survey-january-march-2012-57th-round-14219) conducted during January-March 2012, indicates that demand conditions in Indian manufacturing sector for Q4 of 2011-12 showed an improvement, while expectations for Q1 of 2012-13 showed a slight moderation.
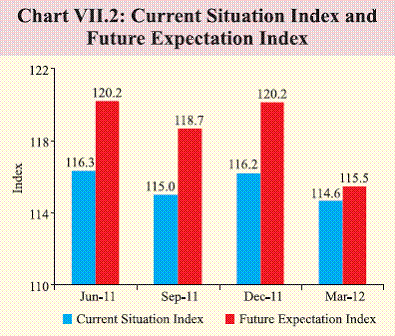
VII.12 The Business Expectation Index (BEI), a composite indicator based on several business related parameters for the assessment and expectation quarters, shows an increase for Q4 of 2011-12 and a marginal decline for the quarter ahead (Q1 of 2012-13) (Chart VII.1). VII.13 The survey results also indicate optimism with regard to production and order books for the assessment quarter, but going forward the trends are expected to decline. Net response on capacity utilisation increased during Q4 of 2011-12. Financing pressures seemed to have eased as indicated by the improvement in the availability and cost of finance for both quarters under review. Pressures from the cost of raw material continue, however, slight moderation is expected in Q1 of 2012-13. The net response on profit margin remained negative but a higher percentage of respondents reported increased profit margins in the assessment quarter (Table VII.2). Consumer Confidence Survey notes decline in spending intentions VII.14 The 8th round of the Consumer Confidence Survey conducted by the Reserve Bank of India in March 2012 (/en/web/rbi/-/publications/consumer-confidence-survey-march-2012-14220) indicates marginal decline in positive perceptions of the household after recording a slight improvement in December 2011. Survey also suggests visible decrease in future expectation mainly due to a decline in perceptions about income and spending (Chart VII.2). External agencies see slow revival in domestic growth VII.15 The Government of India has placed its domestic growth projection for 2012-13 at 7.6 per cent (+/- 0.25 per cent) (Table VII.3). This is against the backdrop of the CSO’s advance estimates for 2011-12 growth at 6.9 per cent. Most external agencies see a moderate rebound in growth, as indicated by their conservative forecasts for 2012-13, and have pegged their forecasts in the range of 7.0-7.6 per cent.
Survey of professional forecasters1 VII.16 The results of the 19th round of ‘Survey of Professional Forecasters’ (/en/web/rbi/-/publications/results-of-19th-round-q4-2011-12-of-survey-of-professional-forecasters-on-macroeconomic-indicators-14217) conducted by the Reserve Bank show marginal decline in the overall growth projection for 2012-13 (Table VII.4). The revisions in projections for 2012-13 are mostly positive. While majority of the professional forecasters envisage a slow pick up in growth from Q2 of 2012-13, the average inflation is expected to hover around current levels.
Inflation expectations moderate VII.17 The Inflation Expectations Survey of Households (IESH) (/en/web/rbi/-/publications/inflation-expectations-survey-of-households-march-2012-round-27-14221) for January-March 2012 indicates a decrease in households’ perception of both the current quarter inflation as well as expectations of future inflation. The survey spanned 12 cities covering 4,000 households and seven occupational categories. Policy aims to support recovery, action to factor in inflation and macro-risks VII.18 Policy actions thus far have helped moderate inflation and contain inflationary expectations. However, against the backdrop of uncertain global conditions and fragile domestic demand, the recovery in the economy is expected to remain moderate. Demand revival, especially in investment, is critical for growth. In this context, business as also consumer confidence needs to be addressed by the policy initiatives. VII.19 At the current juncture, reviving growth in a non-inflationary manner poses many challenges. Given that the recent experience suggests that potential output may itself be lower than in the pre-crisis years, the output gap could be small. Inflationary pressures, though moderating, could re-emerge if the upside risks materialise. Moreover, policy choices have to keep in view the risks arising from fiscal and external imbalances. The policy design to achieve macro-objectives hinges on deregulation and the upward adjustment of oil prices by letting the demand effects work towards diminishing fiscal and external risks. This would provide space for fiscal and monetary policy to act in tandem to achieve the growth and inflation objectives in 2012-13 that otherwise appear to be at cross purposes. Overall, monetary policy has to tread with care in working towards reviving growth, while not exacerbating inflation and other risks. 1 The forecasts reflect the views of professional forecasters and not of the Reserve Bank. |
|||||||||||||||||||||||||||||||||||||||||||||||||||||||||||||||||||||||||||||||||||||||||||||||||||||||||||||||||||||||||||||||||||||||||||||||||||||||||||||||||||||||||||||||||||||||||||||||||||||||||||||||||||||||||||||||||||||||||||||||||||||||||||||||||||||||||||||||||||||||||||||||||||||||||||
Page Last Updated on:


