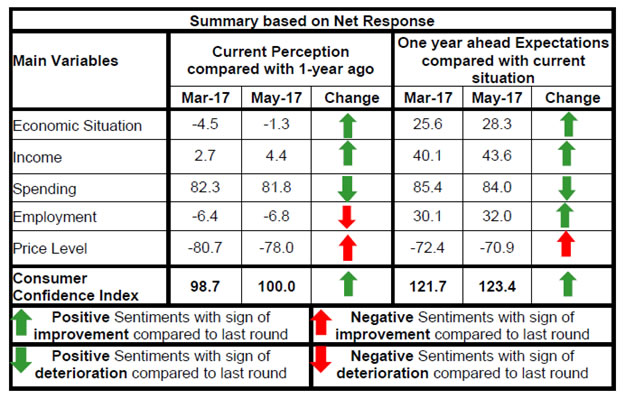
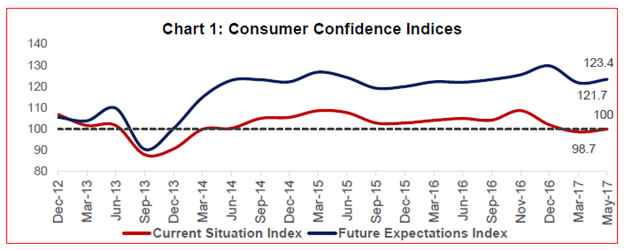
The May 2017 round of the Consumer Confidence Survey (CCS)1 conducted by the Reserve Bank in six metropolitan cities - Bengaluru; Chennai; Hyderabad; Kolkata; Mumbai; and New Delhi - obtained 4,881 responses on households’ perceptions and expectations on the general economic situation, the employment scenario, the overall price situation and their own income and spending. Highlights: I. The Current Situation Index (CSI)2 recovered from the pessimistic zone in May 2017, pulled up by improved sentiments on the economic situation, price situation and households’ income. II. The Future Expectations Index (FEI) also rose by 1.7 percentage points over its March 2017 level on an improved outlook on all parameters, barring a marginal decline in spending (Chart 1). III. Households’ current perceptions on the economic situation improved slightly in May 2017, though net responses remained in the negative zone for the second consecutive round. Respondents’ outlook on the future economic situation was, however, more optimistic (Table 1). IV. Households’ current perceptions on their income level witnessed a gradual recovery from the low touched in December 2016. Their outlook on income also witnessed a turnaround after a deterioration in the previous two rounds (Table 2). V. Respondents largely maintained optimism on overall spending (Table 3), with sentiments on non-essential spending improving (Table 5). VI. Current perceptions on employment remained pessimistic, although a marginal improvement over the March 2017 responses is discernible (Table 6). VII. The assessment of/ outlook on the current/future price situation showed improvement in the May 2017 round, reversing the pessimism observed in the March 2017 round (Table 8). | Table 1: Perceptions and Expectations on Economic Situation | | Survey Round | Current Perception | One year Ahead Expectation | | Improved | Remained Same | Worsened | Net Response | Will improve | Will remain same | Will worsen | Net Response | | Dec-15 | 38.0 | 30.9 | 31.1 | 7.0 | 51.0 | 27.6 | 21.4 | 29.6 | | Mar-16 | 39.9 | 30.3 | 29.8 | 10.1 | 54.6 | 27.2 | 18.2 | 36.4 | | June-16 | 40.2 | 27.9 | 31.9 | 8.2 | 54.2 | 25.5 | 20.4 | 33.8 | | Sept-16 | 44.6 | 30.1 | 25.3 | 19.4 | 57.7 | 24.3 | 18.0 | 39.6 | | Nov-16 | 49.5 | 26.6 | 23.9 | 25.6 | 63.0 | 18.7 | 18.3 | 44.8 | | Dec-16 | 45.7 | 24.1 | 30.3 | 15.4 | 66.3 | 16.6 | 17.1 | 49.2 | | Mar-17 | 35.6 | 24.4 | 40.0 | -4.5 | 52.1 | 21.4 | 26.5 | 25.6 | | May-17 | 36.4 | 25.9 | 37.7 | -1.3 | 52.4 | 23.5 | 24.1 | 28.3 |
| Table 2: Perceptions and Expectations on Income | | (Percentage responses) | | Survey Round | Current Perception | One year Ahead Expectation | | Increased | Remained same | Decreased | Net Response | Will increase | Will remain same | Will decrease | Net Response | | Dec-15 | 28.7 | 50.2 | 21.1 | 7.7 | 49.1 | 40.4 | 10.5 | 38.6 | | Mar-16 | 31.3 | 48.9 | 19.8 | 11.5 | 52.1 | 39.3 | 8.6 | 43.5 | | June-16 | 29.9 | 51.8 | 18.4 | 11.5 | 51.2 | 39.9 | 8.9 | 42.3 | | Sept-16 | 31.2 | 48.6 | 20.2 | 11.1 | 52.3 | 36.4 | 11.3 | 41.1 | | Nov-16 | 37.3 | 45.5 | 17.2 | 20.1 | 57.1 | 33.4 | 9.4 | 47.7 | | Dec-16 | 27.1 | 47.1 | 25.8 | 1.3 | 54.8 | 33.5 | 11.7 | 43.1 | | Mar-17 | 27.7 | 47.3 | 25.0 | 2.7 | 51.8 | 36.5 | 11.7 | 40.1 | | May-17 | 28.2 | 48.0 | 23.8 | 4.4 | 52.8 | 38.1 | 9.1 | 43.6 |
| Table 3: Perceptions and Expectations on Spending | | (Percentage responses) | | Survey Round | Current Perception | One year Ahead Expectation | | Increased | Remained same | Decreased | Net Response | Will increase | Will remain same | Will decrease | Net Response | | Dec-15 | 78.7 | 9.8 | 11.5 | 67.2 | 79.3 | 10.1 | 10.6 | 68.6 | | Mar-16 | 78.0 | 9.9 | 12.1 | 65.9 | 78.5 | 10.6 | 11.0 | 67.5 | | June-16 | 82.7 | 8.4 | 8.8 | 73.9 | 82.2 | 10.2 | 7.6 | 74.6 | | Sept-16 | 70.3 | 24.1 | 5.7 | 64.6 | 79.1 | 17.0 | 3.9 | 75.2 | | Nov-16 | 73.2 | 23.6 | 3.2 | 70.0 | 77.3 | 20.3 | 2.5 | 74.8 | | Dec-16 | 73.5 | 20.8 | 5.6 | 67.9 | 78.3 | 15.8 | 5.9 | 72.4 | | Mar-17 | 84.4 | 13.4 | 2.1 | 82.3 | 88.5 | 8.3 | 3.1 | 85.4 | | May-17 | 83.4 | 14.9 | 1.6 | 81.8 | 86.0 | 11.9 | 2.0 | 84.0 |
| Table 4: Perceptions and Expectations on Spending-Essential Items | | (Percentage responses) | | Survey Round | Current Perception | One year Ahead Expectation | | Increased | Remained same | Decreased | Net Response | Will increase | Will remain same | Will decrease | Net Response | | Dec-15 | 81.4 | 9.0 | 9.6 | 71.8 | 81.5 | 9.4 | 9.1 | 72.4 | | Mar-16 | 79.6 | 9.3 | 11.1 | 68.5 | 78.6 | 11.9 | 9.6 | 69.0 | | June-16 | 83.0 | 8.2 | 8.8 | 74.3 | 81.1 | 10.6 | 8.3 | 72.8 | | Sept-16 | 79.1 | 16.9 | 4.0 | 75.1 | 82.5 | 12.7 | 4.8 | 77.6 | | Nov-16 | 81.7 | 15.2 | 3.1 | 78.6 | 85.1 | 10.9 | 4.0 | 81.1 | | Dec-16 | 76.9 | 18.4 | 4.7 | 72.2 | 77.5 | 14.9 | 7.7 | 69.8 | | Mar-17 | 85.8 | 11.1 | 3.1 | 82.7 | 87.0 | 9.2 | 3.8 | 83.2 | | May-17 | 85.7 | 11.6 | 2.8 | 82.9 | 86.9 | 9.6 | 3.5 | 83.4 |
| Table 5: Perceptions and Expectations on Spending-Non-Essential Items | | (Percentage responses) | | Survey Round | Current Perception | One year Ahead Expectation | | Increased | Remained same | Decreased | Net Response | Will increase | Will remain same | Will decrease | Net Response | | Dec-15 | 45.3 | 28.9 | 25.8 | 19.5 | 49.2 | 28.6 | 22.2 | 27.1 | | Mar-16 | 37.7 | 31.7 | 30.6 | 7.1 | 44.7 | 33.2 | 22.1 | 22.6 | | June-16 | 43.9 | 32.3 | 23.8 | 20.1 | 51.2 | 30.3 | 18.5 | 32.7 | | Sept-16 | 50.2 | 37.6 | 12.2 | 38.0 | 60.6 | 29.5 | 9.9 | 50.7 | | Nov-16 | 52.2 | 36.8 | 11.1 | 41.1 | 62.7 | 27.6 | 9.7 | 53.0 | | Dec-16 | 37.3 | 44.7 | 18.1 | 19.2 | 49.6 | 35.8 | 14.7 | 34.9 | | Mar-17 | 48.9 | 36.4 | 14.7 | 34.2 | 57.8 | 30.3 | 11.8 | 46.0 | | May-17 | 51.9 | 34.6 | 13.5 | 38.3 | 59.9 | 31.1 | 9.0 | 50.9 |
| Table 6: Perceptions and Expectations on Employment | | (Percentage responses) | | Survey Round | Current Perception | One year Ahead Expectation | | Improved | Remained Same | Worsened | Net Response | Will improve | Will remain same | Will worsen | Net Response | | Dec-15 | 34.0 | 34.7 | 31.3 | 2.6 | 51.6 | 29.8 | 18.7 | 32.9 | | Mar-16 | 34.3 | 31.1 | 34.6 | -0.3 | 50.4 | 31.4 | 18.1 | 32.3 | | June-16 | 35.6 | 28.7 | 35.7 | -0.2 | 51.1 | 29.6 | 19.3 | 31.8 | | Sept-16 | 31.7 | 36.4 | 31.9 | -0.2 | 50.5 | 30.5 | 19.0 | 31.5 | | Nov-16 | 37.6 | 30.9 | 31.4 | 6.2 | 55.7 | 26.6 | 17.7 | 37.9 | | Dec-16 | 31.0 | 29.8 | 39.2 | -8.3 | 57.3 | 24.1 | 18.6 | 38.7 | | Mar-17 | 32.6 | 28.4 | 39.0 | -6.4 | 52.8 | 24.5 | 22.7 | 30.1 | | May-17 | 32.5 | 28.3 | 39.2 | -6.8 | 52.7 | 26.7 | 20.7 | 32.0 |
| Table 7: Perceptions and Expectations on Price Level | | (Percentage responses) | | Survey Round | Current Perception | One year Ahead Expectation | | Increased | Remained same | Decreased | Net Response | Will increase | Will remain same | Will decrease | Net Response | | Dec-15 | 79.5 | 10.9 | 9.6 | -70.0 | 78.9 | 11.7 | 9.4 | -69.5 | | Mar-16 | 77.3 | 12.4 | 10.4 | -66.9 | 78.6 | 11.7 | 9.7 | -68.8 | | June-16 | 78.1 | 12.5 | 9.4 | -68.7 | 80.5 | 11.5 | 8.0 | -72.6 | | Sept-16 | 78.2 | 17.2 | 4.6 | -73.6 | 77.8 | 15.4 | 6.9 | -70.9 | | Nov-16 | 82.2 | 14.3 | 3.6 | -78.6 | 82.9 | 11.9 | 5.2 | -77.7 | | Dec-16 | 73.9 | 18.3 | 7.7 | -66.2 | 69.5 | 16.0 | 14.5 | -55.0 | | Mar-17 | 85.8 | 9.1 | 5.1 | -80.7 | 81.0 | 10.4 | 8.6 | -72.4 | | May-17 | 83.3 | 11.3 | 5.4 | -78.0 | 79.7 | 11.5 | 8.8 | -70.9 |
| Table 8: Perceptions and Expectations on Rate of Change in Price Level (Inflation)* | | (Percentage responses) | | Survey Round | Current Perception | One year Ahead Expectation | | Increased | Remained same | Decreased | Net Response | Will increase | Will remain same | Will decrease | Net Response | | Dec-15 | 86.3 | 10.8 | 2.9 | -83.4 | 85.4 | 11.7 | 2.8 | -82.6 | | Mar-16 | 82.7 | 13.9 | 3.4 | -79.3 | 82.4 | 13.2 | 4.4 | -78.0 | | June-16 | 85.3 | 12.4 | 2.3 | -83.0 | 83.3 | 13.0 | 3.7 | -79.6 | | Sept-16 | 61.8 | 22.4 | 15.8 | -45.9 | 64.3 | 22.4 | 13.3 | -51.0 | | Nov-16 | 64.5 | 18.2 | 17.3 | -47.2 | 66.8 | 18.6 | 14.6 | -52.1 | | Dec-16 | 57.8 | 18.0 | 24.2 | -33.5 | 62.4 | 17.1 | 20.6 | -41.8 | | Mar-17 | 80.5 | 12.5 | 7.0 | -73.5 | 79.9 | 13.8 | 6.3 | -73.6 | | May-17 | 82.0 | 10.0 | 8.0 | -74.0 | 82.6 | 10.9 | 6.5 | -76.1 | | *Applicable only for those respondents who felt price has increased/price will increase. |
|  IST,
IST,