Today, the Reserve Bank released the results of the May 2021 round of its 
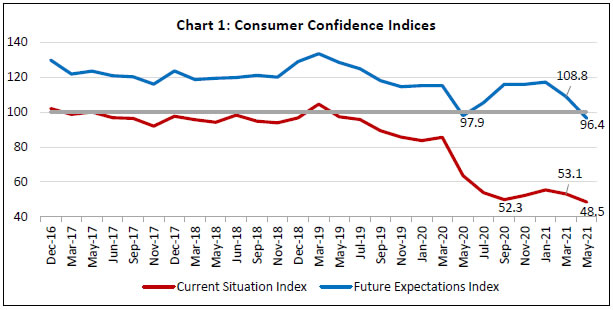
Consumer Confidence Survey (CCS)1. In view of the Covid-19 pandemic, the survey was conducted through telephonic interviews during April 29 to May 10, 2021 in 13 major cities, viz., Ahmedabad; Bengaluru; Bhopal; Chennai; Delhi; Guwahati; Hyderabad; Jaipur; Kolkata; Lucknow; Mumbai; Patna; and Thiruvananthapuram. Perceptions and expectations on general economic situation, employment scenario, overall price situation and own income and spending have been obtained from 5,258 households across these cities2.
Highlights:
Consumer confidence for the current period weakened further; the current situation index (CSI)3, which has been in the negative territory since July 2019, fell to a new all-time low as consumer perceptions on general economic situation and employment scenario lowered further (Chart 1 and Tables 1 and 2).
The future expectations index (FEI) moved to pessimistic territory for the second time since the onset of the pandemic; this was driven by sharp fall in expectations on general economic situation, employment scenario and household income over one year horizon (Table 5).
Household spending also weakened in the latest survey round, with essential spending showing signs of moderation while non-essential spending continues to contract (Tables 6, 7 and 8).
Table 1: Perceptions and Expectations on the General Economic Situation
(Percentage responses)
Survey Round
Current Perception
One year ahead Expectation
Improved
Remained Same
Worsened
Net Response
Will Improve
Will Remain Same
Will Worsen
Net Response
May-20
14.4
11.2
74.4
-60.0
39.6
9.0
51.4
-11.7
Jul-20
11.9
10.3
77.8
-65.9
44.3
13.5
42.2
2.1
Sep-20
9.0
11.4
79.6
-70.6
50.1
15.1
34.8
15.3
Nov-20
11.0
11.5
77.5
-66.5
50.9
13.9
35.2
15.7
Jan-21
14.3
13.6
72.2
-57.9
52.6
16.1
31.3
21.3
Mar-21
12.1
11.9
76.0
-63.9
44.0
17.3
38.7
5.3
May-21
6.5
12.1
81.4
-75.0
33.2
15.3
51.5
-18.3
Table 2: Perceptions and Expectations on Employment
(Percentage responses)
Survey Round
Current Perception
One year ahead Expectation
Improved
Remained Same
Worsened
Net Response
Will Improve
Will Remain Same
Will Worsen
Net Response
May-20
19.2
13.4
67.4
-48.2
41.5
11.1
47.4
-5.9
Jul-20
13.0
8.9
78.1
-65.1
48.6
13.3
38.2
10.4
Sep-20
10.1
8.1
81.7
-71.6
54.1
14.3
31.6
22.5
Nov-20
11.0
9.5
79.5
-68.5
52.0
14.9
33.1
18.9
Jan-21
13.1
11.5
75.4
-62.3
55.3
16.1
28.6
26.7
Mar-21
12.9
11.8
75.3
-62.4
46.7
17.3
36.0
10.7
May-21
7.2
10.8
82.1
-74.9
35.4
16.1
48.5
-13.0
Table 3: Perceptions and Expectations on Price Level
(Percentage responses)
Survey Round
Current Perception
One year ahead Expectation
Increased
Remained Same
Decreased
Net Response
Will Increase
Will Remain Same
Will Decrease
Net Response
May-20
79.1
17.5
3.4
-75.8
75.8
14.8
9.4
-66.4
Jul-20
79.7
16.7
3.6
-76.2
71.6
18.3
10.1
-61.5
Sep-20
82.9
14.6
2.5
-80.4
69.5
20.5
10.0
-59.5
Nov-20
89.7
9.0
1.4
-88.3
70.5
17.4
12.1
-58.4
Jan-21
88.6
9.6
1.7
-86.9
73.2
17.1
9.7
-63.5
Mar-21
93.8
5.0
1.2
-92.6
75.0
14.4
10.6
-64.4
May-21
90.6
7.8
1.6
-89.0
73.9
16.4
9.7
-64.3
Table 4: Perceptions and Expectations on Rate of Change in Price Level (Inflation)*
(Percentage responses)
Survey Round
Current Perception
One year ahead Expectation
Increased
Remained Same
Decreased
Net Response
Will Increase
Will Remain Same
Will Decrease
Net Response
May-20
74.8
18.6
6.6
-68.2
73.4
19.5
7.1
-66.3
Jul-20
79.8
15.6
4.5
-75.3
76.4
18.6
5.0
-71.4
Sep-20
83.0
13.1
3.9
-79.1
75.9
19.6
4.6
-71.3
Nov-20
88.3
8.9
2.8
-85.5
78.3
16.7
4.9
-73.4
Jan-21
83.5
13.4
3.1
-80.4
77.7
17.2
5.0
-72.7
Mar-21
88.8
8.5
2.7
-86.1
81.1
14.3
4.5
-76.6
May-21
87.2
10.3
2.5
-84.7
79.3
16.7
4.0
-75.3
*Applicable only for those respondents who felt price has increased/price will increase.
Table 5: Perceptions and Expectations on Income
(Percentage responses)
Survey Round
Current Perception
One year ahead Expectation
Increased
Remained Same
Decreased
Net Response
Will Increase
Will Remain Same
Will Decrease
Net Response
May-20
12.6
34.0
53.4
-40.8
39.5
39.1
21.4
18.1
Jul-20
8.3
28.9
62.8
-54.5
43.5
39.3
17.2
26.3
Sep-20
8.9
28.4
62.7
-53.8
53.2
36.7
10.0
43.2
Nov-20
8.4
28.5
63.1
-54.7
51.0
38.3
10.7
40.3
Jan-21
9.9
29.2
60.9
-51.0
51.3
38.8
9.9
41.4
Mar-21
7.9
30.5
61.6
-53.7
46.4
40.7
13.0
33.4
May-21
8.4
33.1
58.5
-50.1
42.5
42.1
15.5
27.0
Table 6: Perceptions and Expectations on Spending
(Percentage responses)
Survey Round
Current Perception
One year ahead Expectation
Increased
Remained Same
Decreased
Net Response
Will Increase
Will Remain Same
Will Decrease
Net Response
May-20
56.1
31.0
12.9
43.2
64.3
27.0
8.7
55.6
Jul-20
48.1
34.7
17.2
30.8
60.2
29.2
10.6
49.6
Sep-20
47.2
31.8
21.1
26.1
65.3
27.5
7.2
58.1
Nov-20
55.6
28.5
15.9
39.7
69.1
24.9
6.1
63.0
Jan-21
53.3
28.9
17.8
35.5
66.4
26.7
6.8
59.6
Mar-21
56.6
24.9
18.4
38.2
67.0
25.3
7.7
59.3
May-21
50.6
30.3
19.2
31.4
60.5
29.9
9.6
50.9
Table 7: Perceptions and Expectations on Spending- Essential Items
(Percentage responses)
Survey Round
Current Perception
One year ahead Expectation
Increased
Remained Same
Decreased
Net Response
Will Increase
Will Remain Same
Will Decrease
Net Response
May-20
69.3
20.9
9.8
59.5
73.0
20.6
6.4
66.7
Jul-20
64.0
23.9
12.1
51.9
69.4
22.9
7.7
61.7
Sep-20
61.4
23.9
14.7
46.7
71.9
22.8
5.3
66.6
Nov-20
68.7
20.0
11.3
57.4
75.6
19.2
5.2
70.4
Jan-21
68.6
20.0
11.4
57.2
73.6
21.6
4.8
68.8
Mar-21
71.1
16.0
12.9
58.2
74.6
20.0
5.4
69.2
May-21
63.2
22.3
14.5
48.7
68.1
24.6
7.3
60.8
Table 8: Perceptions and Expectations on Spending- Non-Essential Items
(Percentage responses)
Survey Round
Current Perception
One year ahead Expectation
Increased
Remained Same
Decreased
Net Response
Will Increase
Will Remain Same
Will Decrease
Net Response
May-20
13.9
39.6
46.4
-32.5
22.0
42.4
35.6
-13.6
Jul-20
9.2
29.4
61.4
-52.2
22.2
37.9
39.9
-17.7
Sep-20
10.7
29.5
59.8
-49.1
31.3
37.4
31.4
-0.1
Nov-20
11.2
27.9
60.9
-49.7
28.7
37.3
34.0
-5.3
Jan-21
13.3
27.1
59.7
-46.4
27.5
36.7
35.8
-8.3
Mar-21
11.9
29.5
58.5
-46.6
24.7
38.3
37.1
-12.4
May-21
8.7
31.5
59.7
-51.0
22.2
40.7
37.1
-14.9
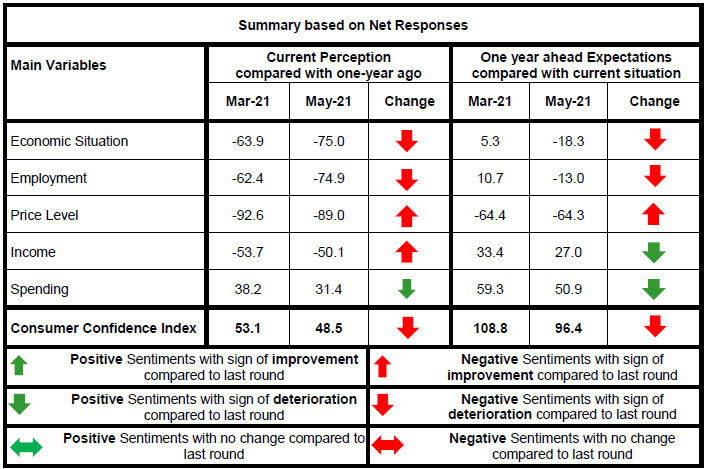
1 The survey results reflect the respondents’ views, which are not necessarily shared by the Reserve Bank. Results of the previous survey round were released on the Bank’s website on April 07, 2021.
3 CSI and FEI are compiled on the basis of net responses on the economic situation, income, spending, employment and the price level for the current period (as compared with one year ago) and a year ahead, respectively. CSI and FEI = 100 + Average of Net Responses of the above parameters.
RbiTtsCommonUtility
PLAYING
LISTEN
LOADING...
0:062:49
Related Assets
RBI-Install-RBI-Content-Global
RbiSocialMediaUtility
Share this page:
Install the RBI mobile application and get quick access to the latest news!
RbiWasItHelpfulUtility
Was this page helpful?Thanks!
Would like to give more details?
Thank you for your feedback!Thank you for your feedback!