Today, the Reserve Bank released the results of May 2023 round of its bi-monthly consumer confidence survey (CCS)1. The survey obtains current perceptions (vis-à-vis a year ago) and one year ahead expectations on general economic situation, employment scenario, overall price situation and own income and spending across 19 major cities. The latest round of the survey was conducted during May 2-11, 2023, covering 6,089 respondents. Female respondents accounted for 52.3 per cent of this sample.
Highlights:
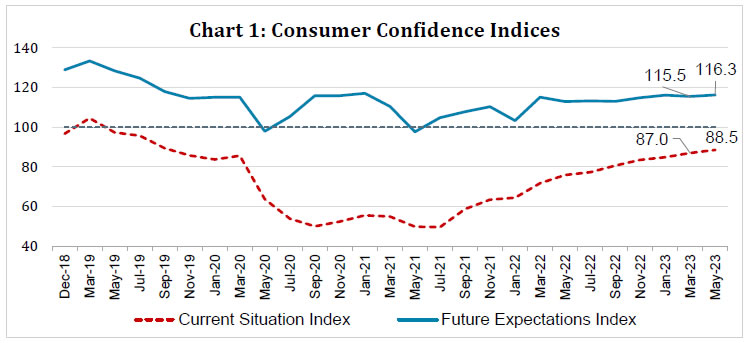
Consumer confidence for the current period, as compared to a year ago, has been rising since the second wave of the Covid-19 pandemic; the current situation index (CSI)2 improved further by 1.5 points from the previous survey round on the back of improved assessment for all the survey parameters, barring essential spending (Chart 1, Table 1, 3 and 5).
Respondents remained optimistic on general economic situation in the year ahead: the future expectations index (FEI) also improved marginally in the latest survey round (Chart 1, Table 1 and 3).
Households’ current perception on general economic situation has been improving steadily since September 2022; their one year ahead outlook has also been on uptrend notwithstanding a marginal dip in March 2023 (Table 1).
With a substantial improvement in May 2023, households’ sentiment on current income inched closer to the neutral zone and they remain fairly optimistic on employment conditions and future earnings over the next one year (Table 2 and 5).
Table 1: Perceptions and Expectations on the General Economic Situation
(Percentage responses)
Survey Round
Current Perception
One year ahead Expectation
Improved
Remained Same
Worsened
Net Response
Will Improve
Will Remain Same
Will Worsen
Net Response
May-22
22.5
14.9
62.7
-40.2
45.4
15.3
39.4
6.0
Jul-22
21.6
15.4
63.0
-41.5
46.4
14.9
38.8
7.6
Sep-22
26.2
14.6
59.2
-33.0
46.5
15.4
38.1
8.4
Nov-22
28.0
16.3
55.7
-27.8
48.0
15.6
36.4
11.6
Jan-23
28.3
19.6
52.1
-23.7
50.2
16.6
33.2
17.0
Mar-23
31.4
16.9
51.7
-20.4
49.9
15.1
35.0
15.0
May-23
32.1
19.0
48.9
-16.8
51.0
15.8
33.2
17.8
Table 2: Perceptions and Expectations on Employment
(Percentage responses)
Survey Round
Current Perception
One year ahead Expectation
Improved
Remained Same
Worsened
Net Response
Will Improve
Will Remain Same
Will Worsen
Net Response
May-22
27.3
17.8
54.9
-27.6
51.3
16.7
32.1
19.2
Jul-22
28.1
17.3
54.6
-26.5
50.7
17.2
32.0
18.7
Sep-22
28.4
17.6
54.0
-25.7
49.4
17.3
33.3
16.1
Nov-22
31.8
18.6
49.6
-17.8
51.5
18.3
30.3
21.2
Jan-23
30.0
20.1
49.9
-19.9
51.8
18.0
30.2
21.6
Mar-23
32.2
19.9
47.9
-15.7
52.9
17.1
30.1
22.8
May-23
32.1
20.2
47.7
-15.6
52.1
18.7
29.2
22.9
Table 3: Perceptions and Expectations on Price Level
(Percentage responses)
Survey Round
Current Perception
One year ahead Expectation
Increased
Remained Same
Decreased
Net Response
Will Increase
Will Remain Same
Will Decrease
Net Response
May-22
95.4
4.1
0.5
-94.9
80.0
11.1
8.9
-71.1
Jul-22
95.2
4.0
0.9
-94.3
80.4
10.9
8.8
-71.6
Sep-22
94.6
4.3
1.1
-93.6
79.9
11.0
9.1
-70.8
Nov-22
94.9
4.1
1.0
-93.9
82.2
9.3
8.6
-73.6
Jan-23
93.6
5.0
1.3
-92.3
83.0
10.1
7.0
-76.1
Mar-23
93.8
5.2
1.0
-92.9
84.3
9.0
6.7
-77.5
May-23
92.2
6.4
1.4
-90.8
82.7
10.0
7.3
-75.4
Table 4: Perceptions and Expectations on Rate of Change in Price Level (Inflation)*
(Percentage responses)
Survey Round
Current Perception
One year ahead Expectation
Increased
Remained Same
Decreased
Net Response
Will Increase
Will Remain Same
Will Decrease
Net Response
May-22
91.3
7.0
1.7
-89.7
81.7
14.2
4.1
-77.6
Jul-22
88.5
8.9
2.6
-85.9
81.8
13.6
4.6
-77.3
Sep-22
89.6
7.8
2.6
-87.0
80.6
14.5
4.9
-75.7
Nov-22
87.5
9.2
3.3
-84.2
82.9
13.2
3.9
-79.1
Jan-23
86.5
10.5
3.0
-83.6
80.3
15.5
4.1
-76.2
Mar-23
86.5
10.0
3.5
-82.9
81.4
14.0
4.6
-76.8
May-23
84.0
12.5
3.4
-80.6
81.8
14.1
4.1
-77.8
*Applicable only for those respondents who felt price has increased/price will increase.
Table 5: Perceptions and Expectations on Income
(Percentage responses)
Survey Round
Current Perception
One year ahead Expectation
Increased
Remained Same
Decreased
Net Response
Will Increase
Will Remain Same
Will Decrease
Net Response
May-22
17.6
46.0
36.4
-18.9
52.4
39.2
8.4
44.0
Jul-22
18.2
46.0
35.9
-17.7
51.6
40.0
8.4
43.3
Sep-22
20.2
45.5
34.4
-14.2
51.3
39.8
8.9
42.4
Nov-22
20.9
46.1
32.9
-12.0
52.5
39.9
7.6
44.9
Jan-23
21.4
49.0
29.6
-8.3
54.5
38.7
6.9
47.6
Mar-23
22.2
49.7
28.1
-5.9
54.1
38.4
7.5
46.7
May-23
23.9
49.7
26.3
-2.4
53.8
39.4
6.9
46.9
Table 6: Perceptions and Expectations on Spending
(Percentage responses)
Survey Round
Current Perception
One year ahead Expectation
Increased
Remained Same
Decreased
Net Response
Will Increase
Will Remain Same
Will Decrease
Net Response
May-22
69.4
22.1
8.5
60.9
72.5
21.7
5.8
66.7
Jul-22
72.6
21.1
6.3
66.3
73.0
22.4
4.6
68.3
Sep-22
75.9
17.5
6.6
69.2
74.2
20.7
5.2
69.0
Nov-22
74.9
19.2
5.9
69.0
75.0
20.3
4.7
70.2
Jan-23
73.9
20.6
5.5
68.4
75.5
19.8
4.7
70.8
Mar-23
75.0
19.6
5.4
69.6
75.4
19.9
4.6
70.8
May-23
73.4
21.3
5.3
68.1
73.8
21.7
4.6
69.2
Table 7: Perceptions and Expectations on Spending- Essential Items
(Percentage responses)
Survey Round
Current Perception
One year ahead Expectation
Increased
Remained Same
Decreased
Net Response
Will Increase
Will Remain Same
Will Decrease
Net Response
May-22
81.7
12.8
5.5
76.2
79.9
15.7
4.4
75.4
Jul-22
82.0
13.7
4.3
77.7
80.0
16.5
3.6
76.4
Sep-22
85.2
10.7
4.1
81.1
80.9
15.4
3.7
77.3
Nov-22
84.7
11.6
3.7
81.0
81.1
15.4
3.5
77.7
Jan-23
84.1
12.3
3.6
80.5
81.3
15.2
3.5
77.8
Mar-23
85.3
11.5
3.2
82.1
81.7
14.8
3.5
78.2
May-23
84.0
12.8
3.2
80.8
81.3
15.2
3.5
77.8
Table 8: Perceptions and Expectations on Spending- Non-Essential Items
(Percentage responses)
Survey Round
Current Perception
One year ahead Expectation
Increased
Remained Same
Decreased
Net Response
Will Increase
Will Remain Same
Will Decrease
Net Response
May-22
16.6
34.1
49.3
-32.7
27.5
38.4
34.1
-6.6
Jul-22
18.7
35.9
45.5
-26.8
29.3
38.5
32.2
-2.9
Sep-22
20.9
32.5
46.7
-25.8
29.5
37.6
33.0
-3.6
Nov-22
22.4
33.8
43.8
-21.4
32.8
35.1
32.2
0.6
Jan-23
22.1
35.2
42.8
-20.7
31.9
38.4
29.8
2.1
Mar-23
25.2
34.8
40.0
-14.8
34.5
36.8
28.8
5.7
May-23
25.8
38.2
36.1
-10.3
35.3
37.5
27.2
8.2
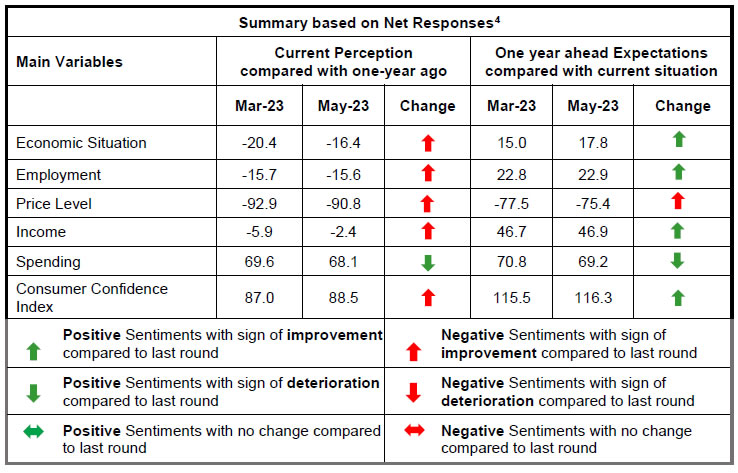
1 The survey results reflect the respondents’ views, which are not necessarily shared by the Reserve Bank. Results of the previous survey round were released on the Bank’s website on April 06, 2023.
2 CSI and FEI are compiled on the basis of net responses on the economic situation, income, spending, employment and the price level for the current period (as compared with one year ago) and a year ahead, respectively. CSI and FEI = 100 + Average of Net Responses of the above parameters.
4 ‘Net response’ is the difference between the percentage of respondents reporting optimism and those reporting pessimisms. It ranges between -100 and 100. Any value greater than zero indicates expansion/ optimism and values less than zero indicate contraction/ pessimism.
RbiTtsCommonUtility
PLAYING
LISTEN
LOADING...
0:062:49
Related Assets
RBI-Install-RBI-Content-Global
RbiSocialMediaUtility
Share this page:
Install the RBI mobile application and get quick access to the latest news!
RbiWasItHelpfulUtility
Was this page helpful?Thanks!
Would like to give more details?
Thank you for your feedback!Thank you for your feedback!