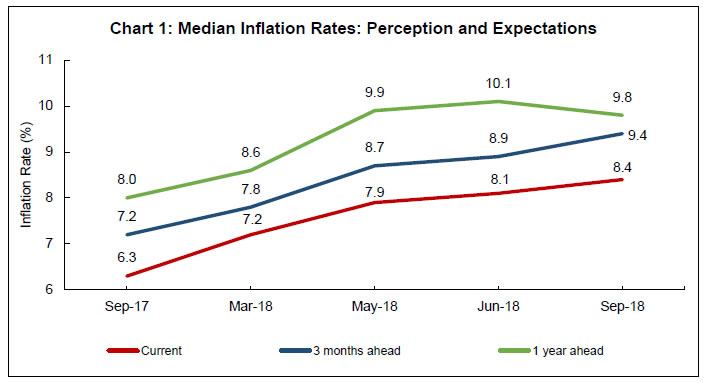
Today, the Reserve Bank released the results of the September 2018 round of the Inflation Expectations Survey of Households (IESH)12. The survey was conducted in 18 cities and the results are based on responses from 5,760 urban households covering various occupational categories.
Highlights:
i. The proportion of respondents expecting general prices to rise at more than the current rate in the next three months and one year ahead horizons remained similar to that in the June 2018 round (Tables 1 a and b).
ii. At the product group level, a higher proportion of respondents expect prices of food and non-food products to rise faster than the current rate.
iii. Three months ahead median inflation expectations rose sharply by 50 basis points (bps) compared to that in the June 2018 round; however, over the longer horizon of a year ahead, households lowered their expectations by 30 bps (Chart 1, Table 2).
iv. The gap between the current perceptions and near term inflation expectations widened while it narrowed down over the medium term.
Table 1(a): Product-wise Expectations of Prices for Three Months ahead
(Percentage of Respondents)
Round
Sep-17
Mar-18
May-18
Jun-18
Sep-18
Options: General
Estimate
SE
Prices will increase
81.3
80.2
82.3
83.8
80.4
0.92
Price increase more than current rate
50.5
45.4
50.5
50.1
49.1
1.15
Price increase similar to current rate
25.4
27.2
25.1
26.4
27.6
1.00
Price increase less than current rate
5.4
7.5
6.7
7.3
3.7
0.38
No change in prices
15.8
17.8
16.0
14.6
17.4
0.88
Decline in prices
2.9
2.1
1.7
1.6
2.2
0.31
Options: Food Product
Prices will increase
79.5
79.6
82.0
81.4
79.5
0.89
Price increase more than current rate
47.5
44.0
48.3
47.8
48.9
1.12
Price increase similar to current rate
24.8
24.9
24.5
24.8
24.5
0.91
Price increase less than current rate
7.3
10.7
9.3
8.7
6.1
0.48
No change in prices
13.3
15.4
13.5
13.3
15.5
0.82
Decline in prices
7.1
5.0
4.5
5.3
4.9
0.40
Options: Non-Food Product
Prices will increase
74.7
75.0
78.4
78.2
78.9
0.87
Price increase more than current rate
43.4
39.6
45.8
44.5
47.5
1.11
Price increase similar to current rate
24.8
25.4
24.0
24.4
25.3
0.91
Price increase less than current rate
6.6
10.0
8.6
9.3
6.1
0.48
No change in prices
19.3
20.8
18.1
17.7
17.1
0.81
Decline in prices
5.9
4.2
3.6
4.1
4.0
0.38
Options: Household Durables
Prices will increase
61.5
63.7
63.2
58.7
56.6
1.05
Price increase more than current rate
37.3
34.7
36.7
32.6
32.4
1.05
Price increase similar to current rate
19.1
20.7
19.9
19.1
19.5
0.80
Price increase less than current rate
5.1
8.3
6.6
7.1
4.7
0.41
No change in prices
25.3
26.2
26.8
30.9
30.8
0.98
Decline in prices
13.2
10.1
10.0
10.4
12.5
0.66
Options: Housing Prices
Prices will increase
68.9
70.0
71.6
71.6
67.1
0.92
Price increase more than current rate
44.9
43.9
47.6
45.3
45.2
1.02
Price increase similar to current rate
19.2
18.8
18.2
19.9
17.9
0.78
Price increase less than current rate
4.9
7.3
5.8
6.4
4.0
0.40
No change in prices
20.0
22.4
20.8
20.7
24.1
0.87
Decline in prices
11.1
7.7
7.7
7.7
8.8
0.59
Options: Cost of Services
Prices will increase
68.7
70.2
72.0
70.8
67.7
1.04
Price increase more than current rate
40.7
38.3
42.9
40.8
41.8
1.15
Price increase similar to current rate
22.5
23.5
22.6
22.8
21.0
0.89
Price increase less than current rate
5.5
8.3
6.6
7.3
5.0
0.43
No change in prices
27.3
26.6
25.6
26.5
29.6
1.01
Decline in prices
4.0
3.3
2.4
2.6
2.7
0.33
Note: 1. The table provides estimates and standard errors for qualitative responses for September 2018 round. For earlier rounds, the results are based on sample proportions. 2. Constituent items may not add up to the corresponding total, due to rounding off.
Table 1(b): Product-wise Expectations of Prices for One Year ahead
(Percentage of Respondents)
Round
Sep-17
Mar-18
May-18
Jun-18
Sep-18
Options: General
Estimate
SE
Prices will increase
93.5
90.8
91.1
91.6
88.3
0.77
Price increase more than current rate
61.2
56.7
62.6
59.8
59.7
1.15
Price increase similar to current rate
27.3
28.0
23.4
25.8
25.3
0.97
Price increase less than current rate
5.0
6.2
5.0
6.0
3.3
0.35
No change in prices
4.1
7.1
6.5
6.5
9.1
0.69
Decline in prices
2.5
2.2
2.4
1.9
2.6
0.32
Options: Food Product
Prices will increase
84.8
85.0
85.6
85.1
84.8
0.78
Price increase more than current rate
51.4
47.4
53.4
51.4
52.5
1.16
Price increase similar to current rate
27.5
28.9
25.2
26.5
27.0
0.96
Price increase less than current rate
6.0
8.7
7.0
7.1
5.3
0.45
No change in prices
9.3
10.2
9.4
9.7
9.7
0.64
Decline in prices
5.9
4.8
5.0
5.3
5.5
0.45
Options: Non-Food Product
Prices will increase
81.4
80.0
82.7
83.3
82.3
0.79
Price increase more than current rate
48.2
44.2
51.1
49.1
51.0
1.18
Price increase similar to current rate
26.7
26.8
25.3
26.6
26.1
0.91
Price increase less than current rate
6.5
9.0
6.3
7.6
5.2
0.44
No change in prices
13.8
15.8
13.2
12.7
13.1
0.70
Decline in prices
4.8
4.3
4.1
4.0
4.6
0.40
Options: Household Durables
Prices will increase
70.7
71.1
72.5
70.6
67.5
0.97
Price increase more than current rate
42.7
40.1
45.2
41.6
40.7
1.10
Price increase similar to current rate
22.6
23.4
21.5
21.8
22.0
0.83
Price increase less than current rate
5.4
7.7
5.8
7.2
4.8
0.42
No change in prices
19.1
19.9
19.2
21.2
22.6
0.84
Decline in prices
10.2
9.0
8.3
8.2
10.0
0.58
Options: Housing Prices
Prices will increase
78.9
80.2
79.8
81.0
77.9
0.89
Price increase more than current rate
53.0
50.9
55.2
53.0
52.9
1.08
Price increase similar to current rate
20.8
22.5
19.6
21.5
21.0
0.87
Price increase less than current rate
5.1
6.8
5.0
6.5
4.0
0.38
No change in prices
12.4
13.9
13.9
13.3
15.1
0.74
Decline in prices
8.8
5.9
6.3
5.7
7.0
0.52
Options: Cost of Services
Prices will increase
82.9
82.6
84.2
84.1
82.0
0.81
Price increase more than current rate
48.6
45.3
52.9
49.5
49.7
1.18
Price increase similar to current rate
27.9
28.6
24.4
26.6
27.3
0.96
Price increase less than current rate
6.4
8.7
6.9
8.0
5.0
0.44
No change in prices
13.5
14.9
13.5
13.7
15.6
0.76
Decline in prices
3.7
2.5
2.4
2.2
2.4
0.29
Note: 1. The table provides estimates and standard errors for qualitative responses for September 2018 round. For earlier rounds, the results are based on sample proportions. 2. Constituent items may not add up to the corresponding total, due to rounding off.
Table 2: Inflation Expectations of various Groups: September 2018
Current
Three months ahead
One year ahead
Mean
Median
Mean
Median
Mean
Median
Estimate
SE
Estimate
SE
Estimate
SE
Estimate
SE
Estimate
SE
Estimate
SE
Overall
9.2
0.12
8.4
0.19
9.9
0.12
9.4
0.27
9.6
0.14
9.8
0.23
Gender-wise
Male
9.3
0.14
8.4
0.19
10.0
0.14
9.4
0.31
9.6
0.17
9.8
0.28
Female
9.4
0.16
8.9
0.37
10.1
0.16
9.8
0.32
9.7
0.22
10.0
0.25
Category-wise
Financial Sector Employees
8.5
0.41
7.7
0.60
9.1
0.40
8.4
0.43
8.9
0.49
8.6
0.56
Other Employees
9.3
0.20
8.4
0.21
10.0
0.19
9.5
0.33
9.8
0.23
10.0
0.27
Self Employed
9.3
0.22
8.3
0.30
9.9
0.22
9.2
0.34
9.3
0.26
9.5
0.44
Homemaker
9.5
0.17
9.2
0.40
10.2
0.18
10.0
0.24
9.9
0.24
10.2
0.17
Retired Persons
9.5
0.41
8.6
0.65
10.2
0.39
9.5
0.59
9.7
0.42
9.4
0.60
Daily Workers
9.1
0.24
8.2
0.32
9.8
0.23
9.0
0.43
9.7
0.27
9.9
0.35
Other category
8.7
0.25
7.5
0.30
9.5
0.26
8.5
0.31
9.1
0.32
9.3
0.53
Age Group-wise
Up to 25 years
8.7
0.27
7.6
0.27
9.4
0.26
8.4
0.32
9.1
0.31
8.8
0.49
25 to 30 years
9.0
0.20
8.0
0.28
9.7
0.20
8.8
0.28
9.6
0.24
9.8
0.35
30 to 35 years
9.0
0.20
8.2
0.31
9.7
0.20
9.1
0.40
9.7
0.23
9.7
0.36
35 to 40 years
9.2
0.22
8.4
0.33
9.9
0.21
9.5
0.42
9.5
0.26
9.7
0.37
40 to 45 years
9.2
0.23
8.5
0.34
9.9
0.23
9.4
0.40
9.6
0.28
9.6
0.41
45 to 50 years
9.7
0.29
9.8
0.45
10.2
0.28
10.1
0.36
9.8
0.33
10.1
0.42
50 to 55 years
9.7
0.28
9.1
0.52
10.4
0.28
10.1
0.32
9.6
0.35
9.9
0.52
55 to 60 years
10.0
0.29
9.8
0.33
10.7
0.28
10.3
0.27
9.5
0.37
9.6
0.37
60 years and above
9.5
0.31
8.9
0.58
10.3
0.28
9.8
0.47
9.8
0.33
9.9
0.42
City-wise
Ahmedabad
9.9
0.38
9.6
0.64
10.9
0.38
10.6
0.57
10.4
0.50
10.5
0.61
Bengaluru
5.7
0.28
4.7
0.29
6.4
0.26
5.4
0.21
7.0
0.30
6.1
0.23
Bhopal
7.5
0.57
6.9
0.79
8.6
0.59
8.6
0.66
8.5
0.93
9.5
1.13
Bhubaneswar
7.6
0.80
6.4
1.18
9.5
0.98
8.3
1.39
10.1
0.96
9.7
1.58
Chennai
9.0
0.50
8.1
0.70
9.8
0.42
9.1
0.61
10.0
0.43
10.3
0.28
Delhi
9.7
0.27
9.2
0.54
10.1
0.27
9.7
0.42
9.2
0.33
9.3
0.48
Guwahati
10.1
1.00
10.3
0.73
9.4
0.90
9.7
1.09
8.1
0.77
7.9
1.21
Hyderabad
9.4
0.38
8.4
0.83
10.6
0.36
9.9
0.74
11.1
0.35
11.5
0.85
Jaipur
6.7
0.28
6.2
0.40
7.4
0.35
7.2
0.35
8.1
0.45
8.4
0.60
Kolkata
10.7
0.42
10.4
0.27
11.3
0.45
11.0
0.71
11.5
0.49
11.9
1.46
Lucknow
8.1
0.64
7.6
0.63
9.3
0.72
8.8
0.38
9.7
0.90
10.3
0.51
Mumbai
11.7
0.38
12.1
1.45
12.2
0.36
13.5
1.59
10.7
0.42
12.2
1.33
Nagpur
8.8
0.46
8.0
0.74
10.0
0.54
9.5
0.79
9.5
0.88
9.8
0.83
Patna
7.4
0.38
6.7
0.58
7.9
0.43
7.6
0.51
7.8
0.53
7.9
0.78
Thiruvananthapuram
7.6
0.80
6.5
1.29
9.5
0.83
8.9
1.08
10.5
0.68
11.1
1.24
Chandigarh
9.4
0.71
9.1
0.59
9.0
0.50
8.9
0.46
8.9
0.55
8.6
0.57
Ranchi
7.5
0.86
6.5
1.12
7.6
1.00
7.0
1.33
7.2
1.02
6.7
1.23
Raipur
6.7
0.68
5.8
0.51
6.8
0.70
5.9
0.73
6.1
0.96
6.1
0.70
Note: The table provides estimates and standard errors for quantitative responses for September 2018 round.
Table 3: Households Expecting General Price Movements in Coherence with Movements in Price Expectations of Various Product Groups: Three Months Ahead and One Year Ahead
(Percentage of Respondents)
Survey period ended
Food
Non-Food
Households durables
Housing
Cost of services
Three Months Ahead
Sep-17
66.8
65.8
56.8
60.1
64.9
Mar-18
63.7
63.2
55.6
57.8
62.7
May-18
67.5
65.6
56.6
60.0
65.0
Jun-18
65.6
64.7
53.8
60.0
63.7
Sep-18
64.4
65.3
52.8
58.6
64.3
One Year Ahead
Sep-17
72.7
69.9
60.5
67.4
69.8
Mar-18
69.0
66.3
59.6
64.3
69.2
May-18
72.4
70.8
62.5
67.4
72.1
Jun-18
71.9
71.4
60.9
67.4
71.9
Sep-18
72.2
71.5
60.0
66.5
71.4
Note: Figures are based on sample observations
Table 4(a): Cross-tabulation of Number of Respondents by Current Inflation Perception and Three Months Ahead Inflation Expectations: September 2018
Three Months Ahead Inflation Rate (per cent)
Current Inflation Rate (per cent)
<1
1-<2
2-<3
3-<4
4-<5
5-<6
6-<7
7-<8
8-<9
9-<10
10-<11
11-<12
12-<13
13-<14
14-<15
15-<16
>=16
No idea
Total
<1
7
3
7
3
0
2
0
0
0
0
0
0
0
0
0
0
0
0
22
1-<2
2
39
19
2
2
0
0
0
0
0
0
0
0
0
0
0
0
0
64
2-<3
2
11
94
78
52
10
0
0
0
0
0
0
0
0
0
0
0
0
247
3-<4
3
3
10
116
105
62
7
3
4
0
2
0
0
0
0
0
1
0
316
4-<5
0
0
6
11
178
103
48
10
9
0
1
0
0
0
0
0
1
1
368
5-<6
2
5
3
18
21
426
148
195
62
4
53
1
2
0
0
2
1
5
948
6-<7
1
0
1
3
3
5
152
68
86
13
7
2
3
0
0
0
2
0
346
7-<8
1
0
2
4
4
5
6
217
89
62
48
5
1
1
1
2
0
0
448
8-<9
0
0
0
1
0
4
5
4
199
75
74
9
10
1
0
1
1
0
384
9-<10
0
0
0
2
0
0
4
2
2
103
55
24
10
2
2
4
3
0
213
10-<11
0
0
0
1
1
15
3
8
11
7
505
60
97
25
7
112
33
6
891
11-<12
0
0
0
0
0
1
0
0
0
1
4
36
10
27
6
15
4
0
104
12-<13
0
0
0
0
0
0
0
1
2
1
1
0
32
7
13
20
5
0
82
13-<14
0
0
0
0
0
0
0
0
0
0
2
1
0
11
5
5
2
0
26
14-<15
0
0
0
0
0
0
0
0
0
0
0
1
0
0
23
15
8
0
47
15-<16
0
0
0
0
0
1
0
0
0
0
5
0
2
2
4
106
95
0
215
>=16
0
0
0
1
0
5
4
0
0
0
13
0
4
0
0
20
980
12
1039
Total
18
61
142
240
366
639
377
508
464
266
770
139
171
76
61
302
1136
24
5760
Note: Figures are based on sample observations
Table 4(b): Cross-tabulation of Number of Respondents by Current Inflation Perception and One Year Ahead Inflation Expectations: September 2018
One Year Ahead Inflation Rate (per cent)
Current Inflation Rate (per cent)
<1
1-<2
2-<3
3-<4
4-<5
5-<6
6-<7
7-<8
8-<9
9-<10
10-<11
11-<12
12-<13
13-<14
14-<15
15-<16
>=16
No idea
Total
<1
8
1
1
3
2
3
1
1
1
0
0
0
0
0
0
0
0
1
22
1-<2
20
14
8
15
3
1
2
0
0
0
0
0
0
0
0
0
0
1
64
2-<3
44
2
38
36
58
37
17
6
9
0
0
0
0
0
0
0
0
0
247
3-<4
34
3
2
50
49
98
27
16
14
4
11
0
1
0
0
1
5
1
316
4-<5
46
2
1
6
81
79
75
31
18
6
14
1
5
0
1
0
0
2
368
5-<6
109
1
4
9
7
230
95
155
96
34
148
12
14
4
3
16
10
1
948
6-<7
43
0
0
0
0
2
90
27
58
29
54
15
13
2
3
4
4
2
346
7-<8
45
0
1
3
1
5
4
149
52
62
58
12
29
5
5
9
8
0
448
8-<9
42
0
0
0
1
1
3
3
116
48
83
15
32
11
5
12
8
4
384
9-<10
21
0
0
0
1
0
1
0
2
69
18
29
27
8
14
10
10
3
213
10-<11
86
0
0
1
1
10
3
3
8
3
331
39
87
24
17
136
136
6
891
11-<12
13
0
0
0
0
0
0
0
1
0
0
19
8
13
12
25
13
0
104
12-<13
10
0
0
0
0
0
1
0
0
0
0
0
17
3
6
19
25
1
82
13-<14
2
0
0
0
0
0
0
0
0
1
0
0
0
7
3
6
7
0
26
14-<15
7
0
0
0
0
0
0
1
0
0
1
0
0
0
15
3
19
1
47
15-<16
24
0
0
0
0
1
0
0
0
1
4
0
0
1
0
68
113
3
215
>=16
123
0
0
1
1
3
1
0
0
0
10
0
1
1
0
15
863
20
1039
Total
677
23
55
124
205
470
320
392
375
257
732
142
234
79
84
324
1221
46
5760
Note: Figures are based on sample observations
1 The survey is conducted at regular intervals by the Reserve Bank of India. It provides useful directional information on near-term inflationary pressures and also supplements other economic indicators. However, these expectations are formed by the respondents and may reflect their own consumption pattern. Hence, these should not be treated as benchmarks for official measures of inflation.
2 As approved by the Technical Advisory Committee on Surveys (TACS), a two-stage probability sampling scheme has been implemented in place of quota sampling from the September 2018 round of the survey. Consequent changes in reporting the results of survey are stated in the footnote to the respective tables. Further, city-wise sample size has been revised in proportion to number of households of each city as per Census 2011, keeping the overall sample size 6,000.
RbiTtsCommonUtility
PLAYING
LISTEN
LOADING...
0:062:49
Related Assets
RBI-Install-RBI-Content-Global
RbiSocialMediaUtility
Share this page:
Install the RBI mobile application and get quick access to the latest news!
RbiWasItHelpfulUtility
Was this page helpful?Thanks!
Would like to give more details?
Thank you for your feedback!Thank you for your feedback!