RbiSearchHeader

Press escape key to go back

Past Searches

Theme
Theme
Text Size
Text Size
S1

RbiAnnouncementWeb

RBI Announcements
RBI Announcements

Asset Publisher

83680679

Results of the Survey of Professional Forecasters on Macroeconomic Indicators - 30th Round

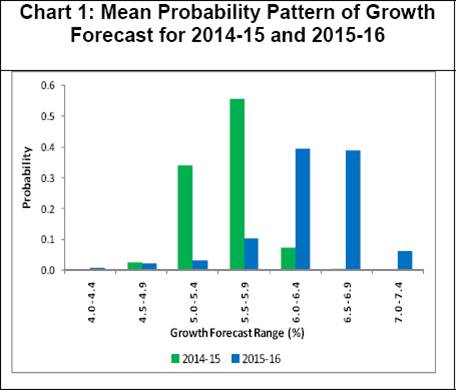
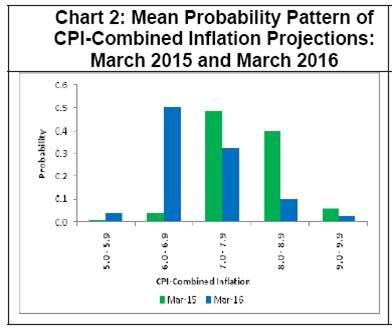
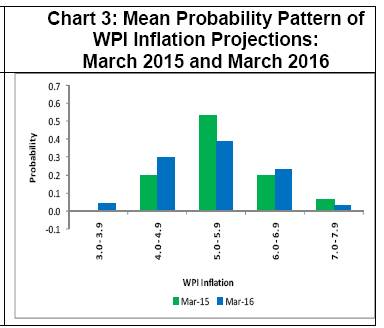
The Reserve Bank has been conducting the Survey of Professional Forecasters since September 2007. The results of the survey represent views of the respondent forecasters and in no way reflect the views or forecasts of the Reserve Bank of India.

Thirty one professional forecasters participated in the latest survey round. The results of the survey in tabular form are presented in the Annex.

Highlights:

1. Annual Forecasts:

  • Forecast^ of real GDP growth rate (at factor cost) for 2014-15 is revised upward to 5.5 per cent from 5.3 per cent in the previous round. The growth forecast for Agriculture & Allied Activities is revised downward from 2.1 per cent to 1.9 per cent, while for Industry growth forecast is revised upward from 3.3 per cent to 3.9 per cent (Table 1). Growth forecast for the Service sector remained same at 7.0 per cent.

  • Real GDP growth rate forecast for 2015-16 is placed at 6.5 per cent.

  • The forecasters assigned maximum probability of 0.56 to the range of 5.5-5.9 per cent for GDP growth in 2014-15 (Chart 1). For the year 2015-16, maximum probability of 0.39 per cent has been assigned in the range of both 6.0-6.4 per cent and 6.5-6.9 per cent.

Table 1: Median Forecast of Real GDP (Growth Rate) for 2014-15 and 2015-16


2014-15

2015-16

Real GDP

5.5
(+0.2)

6.5
(0.0)

Agriculture and Allied Activities

1.9
(-0.2)

3.5
(+0.3)

Industry

3.9
(+0.6)

5.0
(+0.2)

Services

7.0
(0.0)

7.6
(+0.1)

Note: 1. Growth rates are in per cent.
2. Figures in parentheses are change in forecasts from the previous survey round.
3. These footnotes are valid for all tables.


1
  • Private final consumption expenditure (PFCE) at current prices is expected to grow by 12.1 per cent in 2014-15 and 12.9 per cent in 2015-16 (Table 2).

  • Gross Domestic Saving rate is predicted at 30.7 per cent in 2014-15 and is expected to improve to 32.0 per cent in 2015-16 (Table 2).

  • Gross Fixed Capital Formation rate is forecast at 29.4 per cent in 2014-15 and is expected to improve to 30.4 per cent in 2015-16 (Table 2).

Table 2: Median Forecast of PFCE and Capital Formation


2014-15

2015-16

Private final consumption expenditure

12.1
(+0.1)

12.9
(-0.1)

Gross Domestic Saving Rate (per cent of GDP)

30.7
(-0.3)

32.0
(0.0)

Gross Fixed Capital Formation Rate (per cent of GDP)

29.4
(-0.6)

30.4
(-0.5)

  • Money supply (M3) growth for 2014-15 is forecast at 14.0 per cent and is expected to grow by 14.9 per cent in 2015-16 (Table 3).

  • Bank Credit is expected to grow by 14.8 per cent and 16.0 per cent in 2014-15 and 2015-16, respectively (Table 3).

  • Yield of 91-Days Treasury Bills is expected to be at 8.5 per cent and 7.9 per cent at end March 2015 and March 2016, respectively (Table 3).

Table 3: Median Forecasts for Select Financial Market Variables


2014-15

2015-16

Money Supply (M3)

14.0
(0.0)

14.9
(-0.4)

Bank Credit

14.8
(-0.7)

16.0
(-0.5)

Yield of 91-Days Treasury Bills (per cent)

8.5
(0.0)

7.9
(0.0)

  • Central Government’s gross fiscal deficit (GFD) is projected at 4.2 per cent of GDP in 2014-15 and is expected to improve to 3.9 per cent of GDP in 2015-16 (Table 4).

  • The combined GFD of Central and State Governments is expected to be at 6.6 per cent of GDP in 2014-15 and is expected to improve to 6.1 per cent of GDP in 2015-16 (Table 4).

Table 4: Median Forecast of Fiscal Deficit


2014-15

2015-16

Central Government Gross Fiscal Deficit (per cent of GDP)

4.2
(-0.1)

3.9
(-0.1)

Combined Gross Fiscal Deficit (per cent of GDP)

6.6
(0.0)

6.1
(0.0)

  • Merchandise Exports is predicted to grow by 7.8 per cent in 2014-15 and by 10.0 per cent in 2015-16 (Table 5). Current Account Deficit is projected at 2.0 per cent of GDP and 2.2 per cent of GDP for the next two financial years, respectively. Capital Account Balance is expected at 3.4 per cent of GDP for 2014-15.

Table 5: Median Forecasts for Select External Sector Variables


2014-15

2015-16

Merchandise Exports (growth rate in per cent)

7.8
(+0.5)

10.0
(+0.7)

Merchandise Imports (growth rate in per cent)

7.1
(-0.5)

10.8
(+0.2)

Current Account Balance (per cent of GDP)

-2.0
(-0.1)

-2.2
(-0.2)

Capital Account Balance (per cent of GDP)

3.4
(+0.1)

3.2
(0.0)

2. Quarterly Forecasts:

  • Real GDP growth is expected to improve gradually from Q2: 2014-15 to Q2:2015-16 (Table 6).

  • Industrial sector is projected to grow by 3.2 per cent in Q2: 2014-15 and the growth rate is expected to improve to 4.4 per cent in Q2: 2015-16.

  • Services sector is expected to grow by 6.8 per cent in Q2: 2014-15 which is expected to improve to 7.5 per cent in Q2: 2015-16.

Table 6: Median Forecast of Real GDP for 2014-15:Q2 and 2015-16:Q2


Q2:14-15

Q3:14-15

Q4:14-15

Q1:15-16

Q2:15-16

Real GDP

5.3
(0.0)

5.4
(0.0)

5.8
(+0.1)

6.2
(0.0)

6.5

Agriculture and Allied Activities

1.3
(-0.4)

0.9
(-1.2)

1.5
(-0.4)

3.1
(+0.1)

3.4

Industry

3.2
(+0.7)

4.2
(+0.7)

4.2
(+0.3)

4.0
(-0.4)

4.4

Services

6.8
(0.0)

7.1
(+0.1)

7.3
(0.0)

7.6
(+0.2)

7.5

  • Forecasters expect CPI Combined inflation in Q2: 2014-15 at 7.9 per cent. CPI inflation is expected at 8.0 per cent in Q4: 2014-15 and is expected to decline to 7.4 per cent in Q2: 2015-16 (Table 7).

  • Inflation based on WPI is expected to decline to 4.7 per cent in Q3: 2014-15 and is expected to remain above 5.0 per cent till Q2:2015-16 (Table 7).

Table 7: Median Forecast of Inflation for 2014-15:Q2 and 2015-16:Q2


Q2:14-15

Q3:14-15

Q4:14-15

Q1:15-16

Q2:15-16

CPI Combined

7.9
(+0.1)

7.5
(+0.1)

8.0
(-0.1)

7.8
(-0.2)

7.4

Core CPI Combined (excluding food & fuel)*

7.3

7.0

6.9

6.9

6.8

WPI

4.8
(-0.4)

4.7
(-0.1)

5.7
(+0.1)

5.6
(-0.1)

5.3

*: Introduced from this round.

  • The forecasters assigned highest probability of 0.48 that CPI-Combined inflation will remain in the range 7.0-7.9 per cent in March 2015 (Chart 2). For March 2016, the forecasters assigned maximum probability of 0.51 that CPI inflation will be in the range of 6.0-6.9 per cent.

  • The forecasters assigned highest probability of 0.54 that WPI inflation will fall in the range of 5.0-5.9 per cent in March 2015 (Chart 3). For March 2016 also, the forecasters assigned maximum probability of 0.39 that WPI inflation will be in the range of 5.0-5.9 per cent.

2
3
  • The Indian Rupee is expected to remain stable against the US Dollar within the range of ` 60/$ to ` 61/$ till end Q2:2015-16 (Annex Table A.3).

3. Long Term Forecasts:

  • Average real GDP growth for the next five years (2014-15 to 2018-19) and the next ten years (2014-15 to 2023-24), are expected to be 6.8 per cent and 7.5 per cent, respectively. Over the next five years, inflation based on CPI-Combined and WPI is expected to be 6.5 per cent and 5.1 per cent, respectively. Over the next ten years, inflation based on CPI-Combined and WPI is expected to be around 6.0 per cent and 5.0 per cent, respectively (Annex Table A.9).

Annex

Table A.1: Annual Forecasts for 2014-15


Key Macroeconomic Indicators

Annual Forecasts for 2014-15

Mean

Median

Max

Min

1

Real GDP at factor cost (growth rate in per cent)

5.5

5.5

6.1

5.1

a

Agriculture & Allied Activities (growth rate in per cent)

2.0

1.9

4.0

0.5

b

Industry (growth rate in per cent)

3.8

3.9

5.5

1.9

c

Services (growth rate in per cent)

7.0

7.0

7.6

6.4

2

Private Final Consumption Expenditure at current market price (growth rate in per cent)

11.7

12.1

14.0

5.5

3

Gross Domestic Saving (per cent of GDP)

30.7

30.7

32.0

29.6

4

Gross Fixed Capital Formation (per cent of GDP)

29.4

29.4

32.0

27.8

5

Money Supply (M3) (growth rate in per cent)

14.0

14.0

18.0

12.0

6

Bank Credit of Scheduled Commercial banks (growth rate in per cent)

14.8

14.8

17.1

12.5

7

Combined Gross Fiscal Deficit (per cent of GDP)

6.5

6.6

7.1

6.1

8

Central Government Gross Fiscal Deficit (per cent of GDP)

4.3

4.2

4.8

4.1

9

Repo Rate (end period)

7.92

8.00

8.50

7.50

10

CRR (end period)

3.99

4.00

4.00

3.75

11

Yield of 91-Days Treasury Bills (end period)

8.4

8.5

8.8

7.8

12

YTM of Central Govt. Securities with term to maturity of 10-years (end period)

8.4

8.5

8.7

7.7

13

Overall Balance of Payments (in US $ bn.)

33.2

33.1

59.5

20.3

14

Merchandise Exports (in US $ bn.)

340.5

341.7

352.2

325.0

15

Merchandise Exports (growth rate in per cent)

7.6

7.8

18.8

3.5

16

Merchandise Imports (in US $ bn.)

497.3

497.6

515.0

479.7

17

Merchandise Imports (growth rate in percent)

7.4

7.1

15.0

3.0

18

Merchandise Trade Balance (per cent of GDP)

-7.6

-7.6

-6.8

-8.2

19

Net Invisible Balance (in US $ bn.)

116.6

116.0

122.9

110.0

20

Current Account Balance (in US $ bn.)

-40.2

-40.0

-32.9

-55.5

21

Current Account Balance (per cent of GDP)

-2.0

-2.0

-1.6

-2.8

22

Capital Account Balance (in US $ bn.)

72.8

71.6

94.0

57.0

23

Capital Account Balance (per cent of GDP)

3.5

3.4

4.3

2.7


Table A.2: Annual Forecasts for 2015-16


Key Macroeconomic Indicators

Annual Forecasts for 2015-16

Mean

Median

Max

Min

1

Real GDP at factor cost (growth rate in per cent)

6.4

6.5

6.8

5.4

a

Agriculture & Allied Activities (growth rate in per cent)

3.6

3.5

4.6

2.2

b

Industry (growth rate in per cent)

4.9

5.0

6.5

1.2

c

Services (growth rate in per cent)

7.6

7.6

8.5

6.9

2

Private Final Consumption Expenditure at current market price (growth rate in per cent)

12.6

12.9

15.3

6.5

3

Gross Domestic Saving (per cent of GDP)

32.0

32.0

33.0

30.5

4

Gross Fixed Capital Formation (per cent of GDP)

30.4

30.4

33.0

27.8

5

Money Supply (M3) (growth rate in per cent)

15.1

14.9

18.0

13.5

6

Bank Credit of Scheduled Commercial banks (growth rate in per cent)

16.2

16.0

20.0

13.5

7

Combined Gross Fiscal Deficit (per cent of GDP)

6.3

6.1

7.0

5.6

8

Central Government Gross Fiscal Deficit (per cent of GDP)

3.9

3.9

4.8

3.6

9

Repo Rate(end period)

7.39

7.50

8.00

6.50

10

CRR (end period)

3.93

4.00

4.00

3.50

11

Yield of 91-Days Treasury Bills (end period)

8.0

7.9

8.6

7.2

12

YTM of Central Govt. Securities with term to maturity of 10-years (end period)

8.0

8.0

8.5

7.2

13

Overall Balance of Payments (in US $ bn.)

31.0

31.2

50.0

17.0

14

Merchandise Exports (in US $ bn.)

383.6

379.2

493.0

347.2

15

Merchandise Exports (growth rate in per cent)

10.2

10.0

15.0

5.0

16

Merchandise Imports (in US $ bn.)

548.9

550.1

596.3

512.7

17

Merchandise Imports (growth rate in per cent)

10.9

10.8

20.0

5.0

18

Merchandise Trade Balance (per cent of GDP)

-7.4

-7.3

-6.9

-8.0

19

Net Invisible Balance (in US $ bn.)

123.9

122.2

139.1

116.4

20

Current Account Balance (in US $ bn.)

-50.1

-50.0

-42.2

-63.0

21

Current Account Balance (per cent of GDP)

-2.2

-2.2

-1.8

-2.6

22

Capital Account Balance (in US $ bn.)

80.8

80.0

100.0

62.2

23

Capital Account Balance (per cent of GDP)

3.4

3.2

4.0

2.7


Table A.3: Quarterly Forecasts for Q2:2014-15 and Q2:2015-16


Quarterly Forecasts

Key Macroeconomic Indicators

Q2: 2014-15

Q3: 2014-15

Mean

Median

Max

Min

Mean

Median

Max

Min

1

Real GDP at factor cost (growth rate in per cent)

5.3

5.3

5.8

5.0

5.4

5.4

6.4

4.7

a

Agriculture & Allied Activities (growth rate in per cent)

1.3

1.3

4.1

-2.0

0.8

0.9

4.2

-3.0

b

Industry (growth rate in per cent)

3.0

3.2

5.0

0.5

4.0

4.2

5.6

1.5

c

Services (growth rate in per cent)

6.8

6.8

7.8

6.0

7.1

7.1

8.1

6.3

2

Index of Industrial Production(growth rate in per cent)

2.9

2.8

4.7

1.0

4.1

4.0

5.6

2.1

3

Private Final Consumption Expenditure (growth rate in per cent)

11.7

11.7

13.9

10.0

12.0

12.0

14.0

10.5

4

Gross Fixed Capital Formation (per cent of GDP)

30.2

30.0

34.9

28.3

29.3

28.8

31.4

27.3

5

` per U.S. Dollar (RBI reference rate-end period)

60.33

60.42

62.10

58.00

60.39

60.50

61.70

58.00

6

Repo Rate (end period)

7.99

8.00

8.00

7.75

7.97

8.00

8.25

7.75

7

CRR (end period)

4.00

4.00

4.00

4.00

4.00

4.00

4.00

4.00

8

Merchandise Export (in US$ bn.)

84.8

85.5

88.1

79.9

85.0

84.6

90.2

80.0

9

Merchandise Import (in US$ bn.)

121.1

122.0

128.3

112.9

124.6

126.0

132.1

114.3

10

Indian Crude Oil basket Price (in US$ per barrel)

102.6

101.2

107.9

100.0

103.5

102.3

109.0

99.4


Quarterly Forecasts

Key Macroeconomic Indicators

Q4: 2014-15

Q1: 2015-16

Q2: 2015-16

Mean

Median

Max

Min

Mean

Median

Max

Min

Mean

Median

Max

Min

1

Real GDP at factor cost (growth rate in per cent)

5.9

5.8

6.4

5.3

6.1

6.2

6.8

5.4

6.4

6.5

6.9

5.5

a

Agriculture & Allied Activities (growth rate in per cent)

1.7

1.5

4.0

0.2

2.9

3.1

4.1

1.5

3.4

3.4

5.0

2.2

b

Industry (growth rate in per cent)

4.2

4.2

6.0

1.7

3.9

4.0

6.2

0.8

4.5

4.4

6.4

1.2

c

Services (growth rate in per cent)

7.3

7.3

8.2

6.5

7.5

7.6

8.1

6.8

7.5

7.5

8.3

6.9

2

Index of Industrial Production(growth rate in per cent)

4.3

4.2

6.5

2.5

4.4

3.9

6.0

3.5

4.8

4.3

6.2

3.6

3

Private Final Consumption Expenditure (growth rate in per cent)

12.4

12.6

14.2

10.5

12.7

12.6

14.8

11.0

12.9

13.0

15.0

11.0

4

Gross Fixed Capital Formation (per cent of GDP)

29.7

29.7

31.5

27.5

30.7

31.6

32.4

28.2

31.1

30.2

34.9

29.5

5

` per U.S. Dollar (RBI reference rate-end period)

60.48

61.00

62.50

57.70

60.66

61.00

63.00

57.40

60.61

61.00

64.00

56.50

6

Repo Rate (end period)

7.91

8.00

8.50

7.50

7.84

8.00

8.50

7.00

7.78

8.00

8.25

7.00

7

CRR (end period)

3.99

4.00

4.00

3.75

3.96

4.00

4.00

3.50

3.96

4.00

4.00

3.50

8

Merchandise Export (in US$ bn.)

90.0

89.5

94.5

86.0

91.9

91.1

99.4

87.5

94.6

94.8

100.9

85.2

9

Merchandise Import (in US$ bn.)

128.6

128.7

138.6

116.4

132.2

132.2

142.3

123.4

138.1

136.4

155.0

123.0

10

Indian Crude Oil basket Price (in US$ per barrel)

105.1

105.8

110.0

100.0

104.6

105.0

110.0

100.0

104.6

105.0

110.0

100.0


Table A.4: Forecasts of CPI-Combined Inflation


CPI Combined Headline

Core CPI Combined
(excluding food & fuel)

Mean

Median

Max

Min

Mean

Median

Max

Min

Q2:2014-15

7.9

7.9

8.5

7.4

7.0

7.3

7.7

4.0

Q3:2014-15

7.4

7.5

8.7

6.4

7.1

7.0

7.8

6.4

Q4:2014-15

8.0

8.0

9.0

7.3

7.0

6.9

7.9

6.2

Q1:2015-16

7.8

7.8

8.8

7.0

7.0

6.9

7.9

6.4

Q2:2015-16

7.4

7.4

8.8

5.9

6.9

6.8

8.0

6.0


Table A.5: Forecasts of WPI Inflation


WPI Headline

WPI-Manufactured Products

Mean

Median

Max

Min

Mean

Median

Max

Min

Q2:2014-15

5.0

4.8

6.0

4.2

3.8

3.7

5.0

3.5

Q3:2014-15

4.8

4.7

6.1

4.0

3.6

3.6

4.2

3.2

Q4:2014-15

5.5

5.7

6.4

4.7

3.8

3.9

4.7

3.0

Q1:2015-16

5.5

5.6

6.4

4.8

3.9

4.0

4.5

2.8

Q2:2015-16

5.4

5.3

6.5

4.7

4.2

4.1

5.2

3.4


Table A.6: Mean probabilities attached to possible outcomes of real GDP growth

Growth Range

Forecasts for 2014-15

Forecasts for 2015-16

Below 2.0 per cent

0

0

2.0 to 2.4 per cent

0

0

2.5 to 2.9 per cent

0

0

3.0 to 3.4 per cent

0

0

3.5 to 3.9 per cent

0

0

4.0 to 4.4 per cent

0

0.01

4.5 to 4.9 per cent

0.03

0.02

5.0 to 5.4 per cent

0.34

0.03

5.5 to 5.9 per cent

0.56

0.10

6.0 to 6.4 per cent

0.07

0.39

6.5 to 6.9 per cent

0

0.39

7.0 to 7.4 per cent

0

0.06

7.5 to 7.9 per cent

0

0

8.0 to 8.4 per cent

0

0

8.5 to 8.9 per cent

0

0

9.0 to 9.4 per cent

0

0

9.5 to 9.9 per cent

0

0

10.0 per cent or more

0

0


Table A.7: Mean probabilities attached to possible outcomes of CPI-Combined inflation

Inflation Range

Forecasts for March 2015

Forecasts for March 2016

Below 0 per cent

0

0

0 to 0.9 per cent

0

0

1.0 to 1.9 per cent

0

0

2.0 to 2.9 per cent

0

0

3.0 to 3.9 per cent

0

0

4.0 to 4.9 per cent

0

0

5.0 to 5.9 per cent

0.01

0.04

6.0 to 6.9 per cent

0.04

0.51

7.0 to 7.9 per cent

0.48

0.32

8.0 to 8.9 per cent

0.40

0.10

9.0 to 9.9 per cent

0.06

0.03

10.0 to 10.9 per cent

0.01

0

11.0 to 11.9 per cent

0

0

12.0 to 12.9 per cent

0

0

13.0 to 13.9 per cent

0

0

14.0 per cent or above

0

0


Table A.8: Mean probabilities attached to possible outcomes of WPI inflation

Inflation Range

Forecasts for March 2015

Forecasts for March 2016

Below 0 per cent

0

0

0 to 0.9 per cent

0

0

1.0 to 1.9 per cent

0

0

2.0 to 2.9 per cent

0

0

3.0 to 3.9 per cent

0

0.04

4.0 to 4.9 per cent

0.20

0.30

5.0 to 5.9 per cent

0.54

0.39

6.0 to 6.9 per cent

0.20

0.23

7.0 to 7.9 per cent

0.06

0.03

8.0 to 8.9 per cent

0.01

0.01

9.0 to 9.9 per cent

0

0

10.0 to 10.9 per cent

0

0

11.0 to 11.9 per cent

0

0

12.0 to 12.9 per cent

0

0

13.0 to 13.9 per cent

0

0

14.0 per cent or above

0

0


Table A.9: Annual Average Percentage Change


Annual average percentage change over the next five years

Annual average percentage change over the next ten years

Mean

Median

Max

Min

Mean

Median

Max

Min

Real GDP

6.8

6.8

7.5

6.0

7.5

7.5

9.0

6.5

CPI Inflation

6.6

6.5

7.5

5.0

5.9

6.0

7.0

5.0

WPI

5.2

5.1

6.0

4.0

4.8

5.0

5.5

3.5


1 Data for the previous survey round were released on August 5, 2014 on the RBI website.
^ Median of forecasts of the respondents.

RbiTtsCommonUtility

PLAYING
LISTEN

Related Assets

RBI-Install-RBI-Content-Global

RbiSocialMediaUtility

Install the RBI mobile application and get quick access to the latest news!

Scan Your QR code to Install our app

RbiWasItHelpfulUtility

Was this page helpful?