Survey of Professional Forecasters on Macroeconomic Indicators - Results of the 45th Round
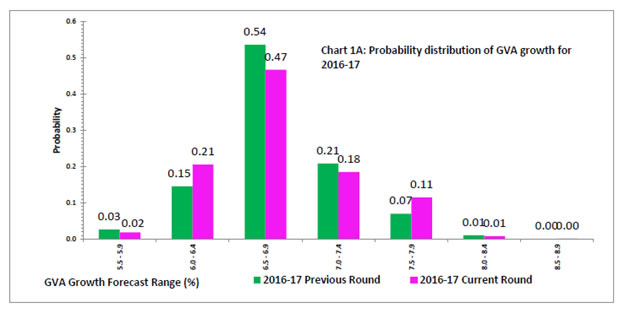
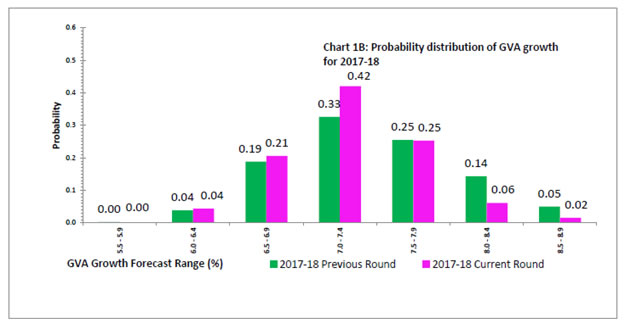
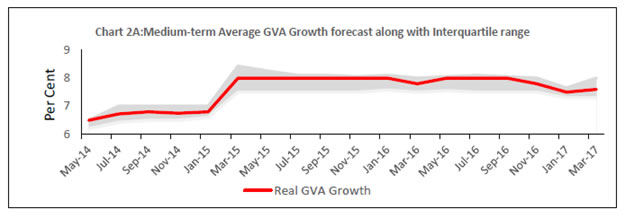
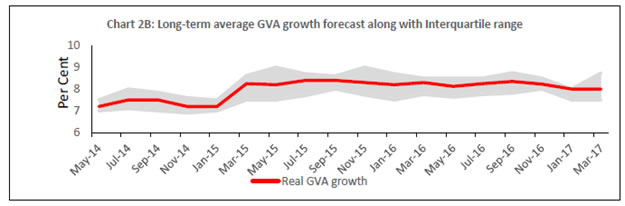
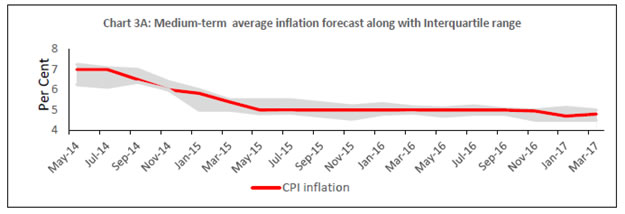
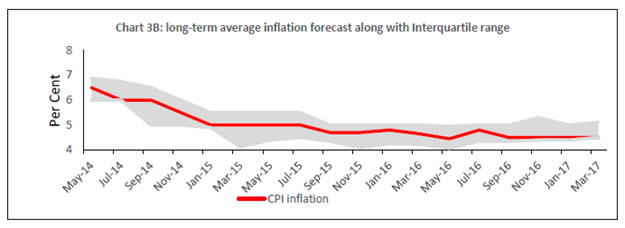
Professional forecasters predict gradual consolidation of growth in 2017-18, supported by both consumption and investment on the back of industrial recovery and reversal of the slowdown in the services sector. Medium to long-term growth expectations remain unchanged. Inflation is expected to rise to around 5.3 per cent by Q4:2017-18. Medium-term (5 years) and long-term (10 years) inflation expectations largely remain unaltered. On the external front, they anticipate improvement in foreign trade and gradual hardening of global crude prices.
The Reserve Bank has been conducting the Survey of Professional Forecasters (SPF) since September 2007. Twenty-one professional forecasters participated in the latest survey round (Round 45) conducted in March 20172. The survey results are summarised in terms of their median forecasts and a snapshot is presented in the Annex.
Highlights:
1. Output
Forecasters expect real GVA growth to accelerate by 60 basis points to 7.3 per cent in 2017-18 on the back of a pick-up in industrial and service sector activity. On the demand side, private consumption growth expectations have been upgraded relative to the previous survey round.
Real GVA growth is projected to be supported by marginal downward revision in the growth forecasts when compared with the previous survey round, due to some tempering in expectations for industrial and services sectors. From the demand side, both consumption and investment are rising, with investment demand funded by a higher saving rate relative to a year ago.
Table 1: Median Forecast of Growth in Real GVA and components – 2016-17 and 2017-18
(per cent)
2016-17
2017-18
Real GVA
6.7 (0.0)
7.3 (-0.2)
a. Agriculture and Allied Activities
4.2 (+0.7)
3.5 (+0.2)
b. Industry
6.1 (+0.3)
7.0 (-0.2)
c. Services
7.6 (-0.4)
8.5 (-0.3)
Private final consumption expenditure (growth rate in per cent)
11.9 (+0.6)
12.1 (-0.3)
Gross Saving Rate (per cent of GNDI)
31.5 (-0.4)
31.8 (0.0)
Gross Fixed Capital Formation Rate (per cent of GDP)
27.0 (-1.3)
28.8 (0.0)
Note: In all the tables, the figures in parentheses indicate the extent of revision in median forecasts (percentage points) relative to the previous SPF round.
Table 2: Median Forecast of Real GVA growth from Q4:2016-17 to Q4:2017-18
(per cent)
Q4:16-17
Q1:17-18
Q2:17-18
Q3:17-18
Q4:17-18
Real GVA at basic prices
6.5 (-0.1)
7.0 (-0.2)
7.4 (-0.2)
7.4 (-0.1)
7.6
a. Agriculture and Allied Activities
5.0 (+1.5)
3.2 (+0.1)
3.5 (+0.4)
3.5 (+0.4)
3.9
b. Industry
6.8 (+1.6)
6.7 (+0.8)
7.0 (+0.6)
7.4 (+0.7)
7.6
c. Services
7.0 (-0.5)
8.0 (-0.4)
8.2 (-0.5)
8.5 (0.0)
8.5
From the summary distribution of forecasts, it is noticed that forecasters are more certain now than in the previous round of the survey that growth in 2017-18 would range between 7.0–7.4 per cent (Charts 1A and 1B).
2. Inflation
CPI headline inflation is expected to slowly increase over successive quarter to 5.3 per cent by Q4: 2017-18, with inflation excluding food and fuel likely to be sticky (forecasts have remained largely unchanged).
By contrast, forecasters have escalated their WPI inflation forecasts relative to current levels.
Table 3: Median Forecast of Quarterly Inflation
(per cent)
Q4:16-17
Q1:17-18
Q2:17-18
Q3:17-18
Q4:17-18
CPI-Combined – Headline
3.6 (-0.4)
3.9 (-0.2)
4.2 (-0.5)
4.8 (-0.1)
5.3
Core CPI-Combined (excluding food & fuel)
4.9 (0.0)
4.9 (0.0)
4.9 (0.0)
4.9 (+0.1)
4.9
WPI – Headline
5.9 (+1.6)
4.5 (+1.1)
4.5 (+1.0)
4.7 (+0.8)
3.7
3. Fiscal Deficit
The Central Government’s gross fiscal deficit (GFD) as well as the Combined GFD of the Centre and States is expected to improve in 2017-18 although marginally higher than in the last survey round.
Table 4: Median Forecast of Fiscal Deficit
(per cent of GDP at market prices)
2016-17
2017-18
Central Government Gross Fiscal Deficit
3.5 (0.0)
3.2 (+0.1)
Combined Gross Fiscal Deficit
6.5 (0.0)
6.3 (+0.3)
4. Money and Banking
Money and Credit are expected to expand at a faster rate during 2017-18 than in the preceding year, although these forecasts have been significantly pared relative to the previous survey round.
Table 5: Median Forecast of Annual Growth in Money and Credit
(per cent)
2016-17
2017-18
Money Supply (M3)
7.5 (-2.0)
10.5 (-1.4)
Bank Credit
6.0 (-1.7)
10.0 (-1.5)
5. External Sector
After a dismal performance in recent years, merchandise trade is expected to improve significantly in the year 2017-18, though forecasts of both exports and imports for 2017-18 have been revised downwards from the previous round.
Forecasters expect an increase in the current account deficit (CAD) during 2017-18.
Table 6: Median Forecast of Select External Sector Variables
2016-17
2017-18
Merchandise Exports – in US $ terms (annual growth in per cent)
2.8 (+0.6)
5.9 (-0.8)
Merchandise Imports– in US $ terms (annual growth in per cent)
-2.0 (+0.9)
7.1 (-0.5)
Current Account Deficit (per cent of GDP at market price)
0.9 (+0.1)
1.2 (+0.1)
Capital Account Balance (per cent of GDP at market price)
1.8 (0.0)
2.4 (-0.1)
6. Medium-term and Long-term Forecasts
The median forecasts for both the medium- and long-term have remained broadly unchanged relative to the previous round, though the forecast ranges have widened in the latest round (Charts 2A and 2B).
Median forecasts of inflation in the medium-term and long-term have also remained unchanged (Charts 3A and 3B).
Annex
Table A.1: Annual Forecasts for 2016-17
Key Macroeconomic Indicators
Annual Forecasts for 2016-17
Mean
Median
Max
Min
1
Real GVA at basic prices (growth rate in per cent)
6.7
6.7
7.1
6.3
a
Agriculture & Allied Activities (growth rate in per cent)
4.1
4.2
4.4
2.9
b
Industry (growth rate in per cent)
6.2
6.1
7.3
4.5
c
Services (growth rate in per cent)
7.7
7.6
8.8
6.8
2
Private Final Consumption Expenditure at current market price (growth rate in per cent)
10.9
11.9
12.6
6.5
3
Gross Saving (per cent of Gross National Disposable Income)
31.4
31.5
34.2
28.8
4
Gross Fixed Capital Formation (per cent of GDP)
28.0
27.0
31.2
26.6
5
Money Supply (M3) (growth rate in per cent)
7.9
7.5
11.4
6.3
6
Bank Credit of Scheduled Commercial banks (growth rate in per cent)
6.6
6.0
12.2
3.3
7
Combined Gross Fiscal Deficit (per cent of GDP)
6.6
6.5
7.3
6.0
8
Central Government Gross Fiscal Deficit (per cent of GDP)
3.5
3.5
3.7
3.2
9
Repo Rate(end period)
--
--
--
--
10
CRR (end period)
--
--
--
--
11
Yield of 91-Days Treasury Bills (end period)
6.2
6.00
6.8
5.9
12
YTM of Central Govt. Securities with term to maturity of 10-years (end period)
6.9
6.8
7.2
6.7
13
Overall Balance of Payments (in US $ bn.)
19.6
20.8
35.5
0.1
14
Merchandise Exports (in US $ bn.)
271.3
271.2
290.0
258.7
15
Merchandise Exports (growth rate in per cent)
2.6
2.8
6.0
-2.9
16
Merchandise Imports (in US $ bn.)
385.6
382.9
420.0
364.0
17
Merchandise Imports (growth rate in percent)
-1.7
-2.0
5.0
-6.5
18
Merchandise Trade Balance (per cent of GDP)
-5.1
-5.0
-4.3
-6.0
19
Net Invisible Balance (in US $ bn.)
99.1
98.2
110.0
89.0
20
Current Account Balance (in US $ bn.)
-17.9
-17.9
-3.0
-58.9
21
Current Account Balance (per cent of GDP)
-0.8
-0.9
-0.1
-1.5
22
Capital Account Balance (in US $ bn.)
35.4
35.5
52.2
14.0
23
Capital Account Balance (per cent of GDP)
1.7
1.8
2.5
0.6
Table A.2: Annual Forecasts for 2017-18
Key Macroeconomic Indicators
Annual Forecasts for 2017-18
Mean
Median
Max
Min
1
Real GVA at basic prices (growth rate in per cent)
7.3
7.3
7.6
6.6
a
Agriculture & Allied Activities (growth rate in per cent)
3.4
3.5
5.4
1.9
b
Industry (growth rate in per cent)
7.0
7.0
8.7
6.1
c
Services (growth rate in per cent)
8.4
8.5
9.1
7.2
2
Private Final Consumption Expenditure at current market price (growth rate in per cent)
11.9
12.1
14.9
7.5
3
Gross Saving (per cent of Gross National Disposable Income)
31.7
31.8
35.2
27.5
4
Gross Fixed Capital Formation (per cent of GDP)
28.3
28.8
30.7
26.0
5
Money Supply (M3) (growth rate in per cent)
10.5
10.5
12.0
8.4
6
Bank Credit of Scheduled Commercial banks (growth rate in per cent)
10.8
10.0
13.3
9.0
7
Combined Gross Fiscal Deficit (per cent of GDP)
6.3
6.3
6.9
5.8
8
Central Government Gross Fiscal Deficit (per cent of GDP)
3.2
3.2
3.3
3.0
9
Repo Rate(end period)
6.09
6.00
6.25
5.75
10
CRR (end period)
4.09
4.00
5.00
4.00
11
Yield of 91-Days Treasury Bills (end period)
6.3
6.3
6.7
6.0
12
YTM of Central Govt. Securities with term to maturity of 10-years (end period)
6.7
6.7
7.4
6.2
13
Overall Balance of Payments (in US $ bn.)
31.0
32.2
52.7
10.3
14
Merchandise Exports (in US $ bn.)
288.8
290.2
320.0
267.0
15
Merchandise Exports (growth rate in per cent)
5.7
5.9
10.0
2.3
16
Merchandise Imports (in US $ bn.)
415.7
412.8
440.0
397.0
17
Merchandise Imports (growth rate in per cent)
6.0
7.1
11.0
-6.5
18
Merchandise Trade Balance (per cent of GDP)
-5.2
-5.3
-4.5
-5.9
19
Net Invisible Balance (in US $ bn.)
102.0
100.6
116.3
90.0
20
Current Account Balance (in US $ bn.)
-25.5
-30.0
25.3
-58.9
21
Current Account Balance (per cent of GDP)
-1.2
-1.2
-0.3
-2.0
22
Capital Account Balance (in US $ bn.)
56.8
57.0
75.0
41.3
23
Capital Account Balance (per cent of GDP)
2.4
2.4
3.0
1.7
Table A.3: Quarterly Forecasts from Q3:2016-17 to Q2:2017-18
Key Macroeconomic Indicators
Quarterly Forecasts
Q4: 2016-17
Q1: 2017-18
Mean
Median
Max
Min
Mean
Median
Max
Min
1
Real GVA at basic prices (growth rate in per cent)
6.5
6.5
6.8
5.5
7.0
7.0
7.7
6.5
a
Agriculture & Allied Activities (growth rate in per cent)
4.6
5.0
6.0
2.7
3.3
3.2
5.9
1.0
b
Industry (growth rate in per cent)
6.6
6.8
8.3
4.9
6.7
6.7
8.9
5.2
c
Services (growth rate in per cent)
7.1
7.0
8.9
5.5
8.0
8.0
9.2
6.9
2
Private Final Consumption Expenditure (growth rate in per cent)
12.0
11.8
15.5
10.1
12.1
11.3
16.0
9.2
3
Gross Fixed Capital Formation (per cent of GDP)
27.1
26.1
33.9
25.6
28.6
28.1
32.5
26.5
4
₹ per U.S. Dollar (RBI reference rate-end period)
--
--
--
--
67.21
67.68
68.70
64.00
5
Repo Rate (end period)
--
--
--
--
6.20
6.25
6.25
6.00
6
CRR (end period)
--
--
--
--
4.00
4.00
4.00
4.00
7
Merchandise Export (in US$ bn.)
70.5
71.0
72.9
68.1
71.1
72.4
73.1
66.0
8
Merchandise Import (in US$ bn.)
103.5
102.5
120.1
96.4
100.6
101.4
108.0
89.4
9
Indian Crude Oil basket Price (in US$ per barrel)
54.1
54.5
55.6
51.9
54.0
55.0
57.0
49.3
Key Macroeconomic Indicators
Quarterly Forecasts
Q2: 2017-18
Q3: 2017-18
Q4:2017-18
Mean
Median
Max
Min
Mean
Median
Max
Min
Mean
Median
Max
Min
1
Real GVA at basic prices (growth rate in per cent)
7.3
7.4
7.9
6.7
7.3
7.4
7.7
6.4
7.2
7.6
7.9
3.0
a
Agriculture & Allied Activities (growth rate in per cent)
3.3
3.5
5.5
0.6
3.4
3.5
5.2
-0.4
3.9
3.9
7.6
1.1
b
Industry (growth rate in per cent)
7.3
7.0
9.2
5.8
7.5
7.4
9.8
5.3
7.7
7.6
10.9
5.6
c
Services (growth rate in per cent)
8.0
8.2
8.7
6.7
8.5
8.5
9.2
7.2
8.6
8.5
9.1
8.0
2
Private Final Consumption Expenditure (growth rate in per cent)
12.9
12.5
15.8
11.5
13.0
12.9
15.0
10.6
14.1
14.1
16.7
12.4
3
Gross Fixed Capital Formation (per cent of GDP)
27.7
27.1
30.5
25.7
27.6
26.9
31.9
25.6
32.1
26.9
69.5
24.7
4
₹ per U.S. Dollar (RBI reference rate-end period)
67.29
67.10
69.70
64.50
67.65
67.38
70.20
66.00
62.01
67.77
70.00
6.25
5
Repo Rate (end period)
6.17
6.25
6.25
6.00
6.09
6.00
6.25
5.75
5.93
6.00
6.25
4.00
6
CRR (end period)
4.07
4.00
5.00
4.00
4.08
4.00
5.00
4.00
4.11
4.00
5.00
4.00
7
Merchandise Export (in US$ bn.)
71.5
72.0
73.9
66.9
71.8
71.7
75.0
67.5
73.7
73.6
78.0
68.5
8
Merchandise Import (in US$ bn.)
101.6
102.8
112.0
90.0
101.6
103.2
106.8
91.5
104.3
103.7
116.6
90.5
9
Indian Crude Oil basket Price (in US$ per barrel)
55.9
57.0
62.0
49.4
56.9
55.0
64.0
50.4
58.8
57.8
67.0
53.0
Table A.4: Forecasts of CPI-Combined Inflation
(per cent)
CPI Combined Headline
Core CPI Combined (excluding food & fuel)
Mean
Median
Max
Min
Mean
Median
Max
Min
Q4:2016-17
3.7
3.6
4.0
3.4
4.9
4.9
5.0
4.7
Q1:2017-18
3.9
3.9
4.5
3.0
4.8
4.9
5.1
4.3
Q2:2017-18
4.2
4.2
5.6
3.0
4.9
4.9
5.4
4.5
Q3:2017-18
4.8
4.8
6.0
2.9
4.9
4.9
5.5
4.5
Q4:2017-18
5.1
5.3
6.5
3.4
4.9
4.9
5.8
4.1
Table A.5: Forecasts of WPI Inflation
(per cent)
WPI Headline
WPI-Manufactured Products
Mean
Median
Max
Min
Mean
Median
Max
Min
Q4:2016-17
5.7
5.9
6.1
4.3
3.4
3.7
4.0
2.4
Q1:2017-18
4.7
4.5
6.0
3.5
2.9
2.9
3.5
2.4
Q2:2017-18
4.4
4.5
6.1
2.6
3.0
3.0
4.0
2.1
Q3:2017-18
4.6
4.7
6.2
2.4
2.9
3.1
3.8
1.6
Q4:2017-18
3.9
3.7
6.3
2.2
2.7
3.0
3.6
1.2
Table A.6: Mean probabilities attached to possible outcomes of real GVA growth
Growth Range
Forecasts for 2016-17
Forecasts for 2017-18
Below 2.0 per cent
0.00
0.00
2.0 to 2.4 per cent
0.00
0.00
2.5 to 2.9 per cent
0.00
0.00
3.0 to 3.4 per cent
0.00
0.00
3.5 to 3.9 per cent
0.00
0.00
4.0 to 4.4 per cent
0.00
0.00
4.5 to 4.9 per cent
0.00
0.00
5.0 to 5.4 per cent
0.00
0.00
5.5 to 5.9 per cent
0.00
0.00
6.0 to 6.4 per cent
0.04
0.04
6.5 to 6.9 per cent
0.19
0.21
7.0 to 7.4 per cent
0.33
0.42
7.5 to 7.9 per cent
0.25
0.25
8.0 to 8.4 per cent
0.14
0.06
8.5 to 8.9 per cent
0.05
0.02
9.0 to 9.4 per cent
0.00
0.00
9.5 to 9.9 per cent
0.00
0.00
10.0 per cent or more
0.00
0.00
Table A.7: Mean probabilities attached to possible outcomes of CPI (Combined) inflation
Inflation Range
Forecasts for March 2017
Forecasts for March 2018
Below 0 per cent
0.00
0.00
0 to 0.9 per cent
0.00
0.00
1.0 to 1.9 per cent
0.00
0.00
2.0 to 2.9 per cent
0.02
0.02
3.0 to 3.9 per cent
0.35
0.13
4.0 to 4.9 per cent
0.42
0.33
5.0 to 5.9 per cent
0.16
0.31
6.0 to 6.9 per cent
0.05
0.16
7.0 to 7.9 per cent
0.00
0.04
8.0 to 8.9 per cent
0.00
0.01
9.0 to 9.9 per cent
0.00
0.00
10.0 to 10.9 per cent
0.00
0.00
11.0 to 11.9 per cent
0.00
0.00
12.0 to 12.9 per cent
0.00
0.00
13.0 to 13.9 per cent
0.00
0.00
14.0 per cent or above
0.00
0.00
Table A.8: Mean probabilities attached to possible outcomes of WPI inflation
Inflation Range
Forecasts for March 2017
Forecasts for March 2018
Below 0 per cent
0.00
0.00
0 to 0.9 per cent
0.01
0.01
1.0 to 1.9 per cent
0.02
0.02
2.0 to 2.9 per cent
0.03
0.12
3.0 to 3.9 per cent
0.26
0.29
4.0 to 4.9 per cent
0.08
0.28
5.0 to 5.9 per cent
0.27
0.20
6.0 to 6.9 per cent
0.31
0.05
7.0 to 7.9 per cent
0.02
0.03
8.0 to 8.9 per cent
0.00
0.00
9.0 to 9.9 per cent
0.00
0.00
10.0 to 10.9 per cent
0.00
0.00
11.0 to 11.9 per cent
0.00
0.00
12.0 to 12.9 per cent
0.00
0.00
13.0 to 13.9 per cent
0.00
0.00
14.0 per cent or above
0.00
0.00
Table A.9: Annual Average Percentage Change
Annual average percentage change over the next five years
Annual average percentage change over the next ten years
Mean
Median
Max
Min
Mean
Median
Max
Min
Real GVA
7.7
7.7
8.4
7.0
8.0
8.0
9.0
6.5
CPI Combined
4.8
4.8
6.0
4.2
4.6
4.5
5.5
4.0
WPI
4.2
4.0
5.5
3.0
4.0
4.1
4.5
2.5
1 Results the previous survey round were released on February 8, 2017 on the RBI website.
2 The results of the survey represent the views of the respondent forecasters and in no way reflect the views or forecasts of the Reserve Bank.
RbiTtsCommonUtility
PLAYING
LISTEN
LOADING...
0:062:49
Related Assets
RBI-Install-RBI-Content-Global
RbiSocialMediaUtility
Share this page:
Install the RBI mobile application and get quick access to the latest news!
RbiWasItHelpfulUtility
Was this page helpful?Thanks!
Would like to give more details?
Thank you for your feedback!Thank you for your feedback!