 IST,
IST,


Survey of Professional Forecasters on Macroeconomic Indicators - Results of the 59th Round
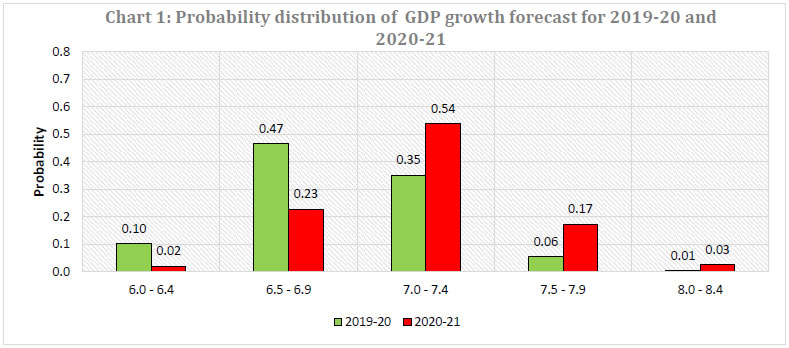
Growth is expected to improve in 2019-20 and firm up further in 2020-21. Consumer price inflation is expected to remain below 4.0 per cent till Q3:2019-20 and increase to 4.0 per cent in Q4:2019-20. The Reserve Bank has been conducting the Survey of Professional Forecasters (SPF) since September 2007. Thirty-two panellists participated in the 59th round of the survey conducted during July 20192. The survey results are summarised in terms of their median forecasts and consolidated in Annexes 1-7, along with quarterly paths for key variables. Highlights: 1. Output
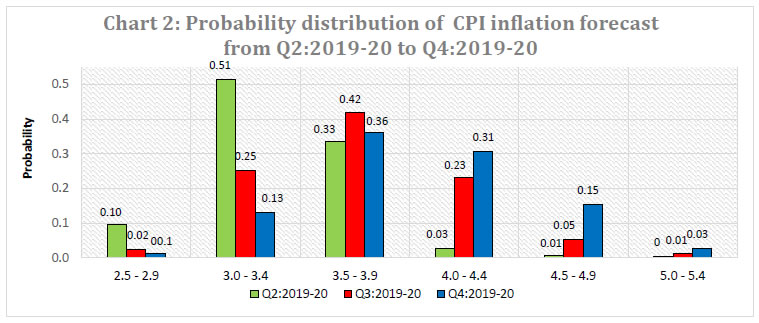
Note: Tails of the distribution are not presented in the chart. Detailed probability distributions are given in Annex 6. 2. Inflation
Note: Tails of the distribution are not presented in the chart. Detailed probability distributions are given in Annex 7. 3. External Sector
1 The results of the last survey round were released on June 6, 2019 on the Reserve Bank’s website. 2 The results presented here represent the views of the respondent forecasters and in no way reflect the views or forecasts of the Reserve Bank. | |||||||||||||||||||||||||||||||||||||||||||||||||||||||||||||||||||||||||||||||||||||||||||||||||||||||||||||||||||||||||||||||||||||||||||||||||||||||||||||||||||||||||||||||||||||||||||||||||||||||||||||||||||||||||||||||||||||||||||||||||||||||||||||||||||||||||||||||||||||||||||||||||||||||||||||||||||||||||||||||||||||||||||||||||||||||||||||||||||||||||||||||||||||||||||||||||||||||||||||||||||||||||||||||||||||||||||||||||||||||||||||||||||||||||||||||||||||||||||||||||||||||||||||||||||||||||||||||||||||||||||||||||||||

Share this page:


Install the RBI mobile application and get quick access to the latest news!
Scan the QR code to install our app


Page Last Updated on:


