RbiSearchHeader

Press escape key to go back

Past Searches

Theme
Theme
Text Size
Text Size
S3

Press Releases Marquee

RBI Announcements
RBI Announcements

RbiAnnouncementWeb

RBI Announcements
RBI Announcements

Asset Publisher

138134185

India’s International Investment Position (IIP), March 2025

Today, the Reserve Bank released data relating to India’s International Investment Position  for end-March 2025[1]

Key Features

IIP during January-March 2025:

  • Net claims of non-residents on India declined by US$ 34.2 billion during Q4:2024-25 to US$ 330.0 billion as at end-March 2025.

  • Higher rise in Indian residents’ overseas financial assets (US$ 60.0 billion) as compared to that in the foreign-owned assets in India (US$ 25.8 billion) led to the decline in net claims of non-residents during the quarter (Table 1).

  • Increase in reserve assets accounted for over 54 per cent of the rise in Indian residents’ overseas financial assets, followed by currency & deposits and direct investments.

  • Rise in loans (US$ 10.0 billion) and inward direct investment (US$ 9.7 billion) together accounted for over three-fourths of the rise in foreign liabilities of Indian residents during January-March 2025.

  • Reserve assets accounted for 58.7 per cent of India’s international financial assets (Table 3).

  • The ratio of India’s international assets to international liabilities increased to 77.5 per cent in March 2025 from 74.8 per cent a quarter ago (Chart 1 & Table 1).

  • The share of debt liabilities in total external liabilities increased during the quarter and stood at 54.8 per cent (Table 4).

IIP during April-March 2024-25:

  • During 2024-25, the net claims of non-residents declined by US$ 31.2 billion on the back of higher rise in India’s external financial assets (US $ 105.4 billion) vis-à-vis external financial liabilities (US $ 74.2 billion) (Table 1).

  • Over 72 per cent of the rise in India’s overseas financial assets was due to increase in overseas direct investment, currency & deposits, and reserve assets.

  • Inward direct investments, loans as well as currency & deposits accounted for over three-fourths of the rise in foreign liabilities during the year.

  • The ratio of India’s international financial assets to international financial liabilities increased to 77.5 per cent in March 2025 from 74.1 per cent a year ago (Chart 1 & Table 1).

Ratio of International Financial Assets and Liabilities to Gross Domestic Product (GDP):

  • As a ratio to GDP (at current market prices), residents’ overseas financial assets increased and external financial liabilities declined during 2024-25 (Table 2).

  • The ratio of net claims of non-residents on India to GDP improved to (-)8.7 per cent in March 2025 from (-)10.1 per cent a year ago, and (-)14.1 per cent five years ago.

(Puneet Pancholy)     
Chief General Manager

Press Release: 2025-2026/616


Ratio of International Financial Assets and Liabilities

Table 1:  Overall International Investment Position of India
(US$ billion)
Period Mar-24 (PR) Jun-24 (PR) Sep-24 (PR) Dec-24 (PR) Mar-25 (P)
Net IIP (A-B) -361.2 -366.9 -353.0 -364.2 -330.0
A. Assets 1,033.8 1,052.0 1,119.4 1,079.2 1,139.2
  1. Direct Investment 242.3 246.6 254.5 260.8 270.5
    1.1 Equity and investment fund shares 153.4 156.6 162.4 166.5 173.6
    1.2 Debt instruments 88.9 90.0 92.1 94.3 96.9
  2. Portfolio Investment 12.5 12.4 12.5 12.2 13.7
    2.1 Equity and investment fund shares 11.0 10.7 11.2 9.4 8.7
    2.2 Debt securities 1.5 1.7 1.3 2.8 5.0
  3. Other Investment 132.6 141.0 146.6 170.5 186.7
    3.1 Trade Credits 33.4 32.8 32.9 33.2 33.4
    3.2 Loans 17.6 20.8 22.1 22.5 25.9
    3.3 Currency and Deposits 53.5 57.8 56.1 68.6 79.3
    3.4 Other Assets 28.1 29.6 35.5 46.2 48.1
  4. Reserve Assets 646.4 652.0 705.8 635.7 668.3
B. Liabilities 1,395.0 1,418.9 1,472.4 1,443.4 1,469.2
  1. Direct Investment 542.9 552.8 555.3 547.1 556.8
    1.1 Equity and investment fund shares 511.1 520.6 522.8 513.0 521.9
    1.2 Debt instruments 31.8 32.2 32.5 34.1 34.9
  2. Portfolio Investment 277.3 277.4 294.3 276.6 272.0
    2.1 Equity and investment fund shares 162.1 160.9 170.9 155.6 141.9
    2.2 Debt securities 115.2 116.5 123.4 121.0 130.1
  3. Other Investment 574.8 588.7 622.8 619.7 640.4
    3.1 Trade Credits 123.7 125.9 131.3 135.6 131.2
    3.2 Loans 221.4 224.6 239.4 240.6 250.6
    3.3 Currency and Deposits 154.8 160.6 164.1 165.7 167.6
    3.4 Other Liabilities 74.9 77.6 88.0 77.8 91.0
          of which:          
             Special drawing rights (Net incurrence of liabilities)         21.9            21.8         22.4         21.6            22.0
Memo Item: Assets to Liability ratio (%) 74.1 74.1 76.0 74.8 77.5

Notes (applicable for all tables):
1. P: Provisional; PR: Partially Revised; and R: Revised.
2. The sum of the constituent items may not add to the total due to rounding off.


Table 2:  Ratios of External Financial Assets and Liabilities to GDP
(per cent)
Period Mar-23 (R) Mar-24 (PR) Mar-25 (P)
Net IIP (A-B)         -11.3         -10.1               -8.7
A. Assets           28.2           28.5              29.3
  1. Direct Investment             6.8             6.7                6.9
    1.1 Equity and investment fund shares             4.3             4.2                4.4
    1.2 Debt instruments             2.5             2.5                2.5
  2. Portfolio Investment             0.5             0.3                0.3
    2.1 Equity and investment fund shares             0.3             0.3                0.2
    2.2 Debt securities             0.2                -                  0.1
  3. Other Investment             3.2             3.6                4.8
    3.1 Trade Credits             0.8             0.8                0.8
    3.2 Loans             0.4             0.5                0.7
    3.3 Currency and Deposits             1.0             1.5                2.1
    3.4 Other Assets             1.0             0.8                1.2
  4. Reserve Assets           17.7           17.9              17.3
B. Liabilities           39.5           38.6              38.0
  1. Direct Investment           16.0           15.0              14.4
    1.1 Equity and investment fund shares           15.1           14.1              13.5
    1.2 Debt instruments             0.9             0.9                0.9
  2. Portfolio Investment             7.5             7.7                7.1
    2.1 Equity and investment fund shares             4.3             4.5                3.7
    2.2 Debt securities             3.2             3.2                3.4
  3. Other Investment           16.0           15.9              16.5
    3.1 Trade Credits             3.8             3.4                3.4
    3.2 Loans             6.2             6.1                6.5
    3.3 Currency and Deposits             4.3             4.3                4.3
    3.4 Other Assets             1.7             2.1                2.3
       of which:


          Special drawing rights (Net incurrence of liabilities)             0.7             0.6                0.6

Table 3: Composition of International Financial Assets and Liabilities of India
(per cent)
Period Mar-24 (PR) Jun-24 (PR) Sep-24 (PR) Dec-24 (PR) Mar-25 (P)
A. Assets
1. Direct Investment 23.4 23.4 22.7 24.2 23.7
2. Portfolio Investment 1.2 1.2 1.1 1.1 1.2
3. Other Investment 12.9 13.4 13.1 15.8 16.4
4. Reserve Assets 62.5 62.0 63.1 58.9 58.7
Total 100.0 100.0 100.0 100.0 100.0
B. Liabilities 
    1. Direct Investment 38.9 39.0 37.7 37.9 37.9
    2. Portfolio Investment 19.9 19.5 20.0 19.2 18.5
    3. Other Investment 41.2 41.5 42.3 42.9 43.6
Total 100.0 100.0 100.0 100.0 100.0

Table 4: Share of External Debt and Non-Debt Liabilities of India
(per cent)
Period Mar-24 (PR) Jun-24 (PR) Sep-24 (PR) Dec-24 (PR) Mar-25 (P)
Non-Debt Liabilities 48.3 48.0 47.1 46.3 45.2
Debt Liabilities 51.7 52.0 52.9 53.7 54.8
Total 100.0 100.0 100.0 100.0 100.0

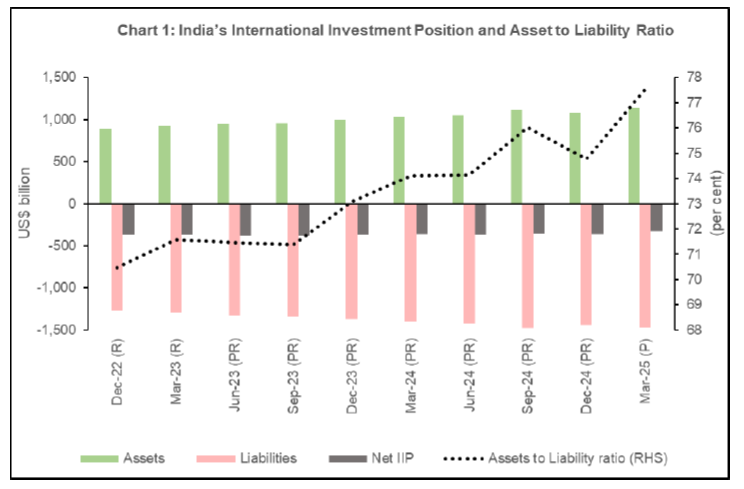
[1] India’s quarterly IIP is disseminated with a lag of one quarter and the previous quarterly IIP for end-December 2024 was released in the RBI website on March 28, 2025.

RbiTtsCommonUtility

प्ले हो रहा है
শুনি আছে

Related Assets

RBI-Install-RBI-Content-Global

RbiSocialMediaUtility

ভাৰতীয় ৰিজাৰ্ভ বেংক মোবাইল এপ্পলিকেষ্যন ইনষ্টল কৰক আৰু নৱীনতম বাতৰিৰ প্ৰৱেশাধিকাৰ পাওক!

Scan Your QR code to Install our app

RbiWasItHelpfulUtility

এই পৃষ্ঠাটো সহায়ক আছিল নে?