 IST,
IST,


IV. Fiscal Policy
Background and Approach to Fiscal Reforms in India
Performance During the 1990s
Assessment and Issues
Concluding Observations
Introduction
4.1 The external payments crisis of 1991 was, to a large extent, an inevitable consequence of the deteriorating fiscal situation during the 1980s. The 1980s, especially the second half, was marked by high and persistent fiscal deficits, accompanied by large revenue deficits. This had led to a significant enlargement of the debt-servicing obligations. In order to contain the burgeoning debt-service obligations, Government tapped financial surpluses of the household sector through statutory pre-emptions from financial intermediaries at below market clearing interest rates. This gave rise to a degree of financial repression. At the same time, increased financing of the Government deficit through automatic monetisation compromised the effectiveness of monetary policy and fuelled inflation. Against this background, when the Indian economy faced an unprecedented macroeconomic crisis in 1991, not surprisingly, fiscal consolidation constituted a major plank of the policy response.
4.2 The primary objective of the fiscal reforms as announced in the Union Budget 1991-92, was essentially to achieve a reduction in the size of deficit and debt in relation to GDP. It was envisaged that this would be achieved through revenue enhancement and curtailment in current expenditure growth while enlarging spending on investment and infrastructure so as to provide momentum to the growth process. These measures were also intended to curb the preemption of institutional resources by the Government and simultaneously to provide a level-playing field to the private investors. Accordingly, fiscal reforms in India were initiated in three distinct but interrelated areas: i) restoration of fiscal balance; ii) restructuring of public sector; and iii) strengthening of the fiscal-monetary co-ordination. The strategy for restoring fiscal balance comprised tax and non-tax reforms, expenditure management and institutional reforms. Public sector restructuring mainly involved divestment of Government ownership. Contemporaneously, the steps towards improving fiscal-monetary coordination encompassed deregulation of financial system, elimination of automatic monetisation, and reduction in pre-emption of institutional resources by the Government. At the sub-national level, fiscal adjustments began as a consequence of the deterioration in States’ finances, which exacerbated in the latter half of the 1990s. With a view to promoting State reforms, access to Central assistance as well as to guarantees for loans from multilateral agencies has been linked to their reform efforts.
4.3 The fiscal performance during the reform period, however, was characterised by a clear divide in the mid-1990s in the attainment of fiscal targets. There was evidence of the successful fiscal correction during 1991-92 to 1996-97 (except for 1993-94) in terms of a significant fall in the fiscal deficit and in public debt as a proportion of GDP. Since then, there has been a significant reversal of trend. Indeed, many deficit indicators presently are even higher than the levels prevailing at the time of the crisis in 1991. The revenue deficit has not only persisted, but has grown in size during this period. The resultant dissaving arising from the revenue deficit has reduced the aggregate saving and investment capacity in the economy. Consequently, there was a steady fall in the share of capital expenditure, impacting on the infrastructure investment and thereby threatening the growth potential of the economy. Several pointers indicate a reversal of the fiscal consolidation process in the recent years. These include decline in tax to GDP ratio, downward rigidity in current expenditure, steady deterioration in public investment in productive sectors, slow progress of Public Sector Undertakings (PSUs) restructuring and faster accumulation of public debt. A major drag on State finances has been the poor performance of State Public Sector Undertakings (SPSUs), particularly the State Electricity Boards (SEBs) and State Road Transport Undertakings (SRTUs). Thus, even after a decade of reforms, sustained fiscal consolidation remains unattained.
4.4 This Chapter reviews the fiscal situation that emerged in the reform period and contrasts it with the 1980s. It also evaluates and identifies major constraints in the process of fiscal consolidation. Section I briefly sets out the international experience on fiscal reforms in order to situate the Indian fiscal reforms in an international perspective. Section II reviews the fiscal situation during the 1980s in terms of alternative fiscal indicators. In the backdrop of deteriorating fiscal indicators, this section explains the reform strategy adopted in the 1990s setting out key measures that were undertaken. The fiscal performance during the 1990s, broadly conforming to the reform period starting 1991, is examined in terms of various indicators in Section III. Achievements as well as shortcomings of the reforms are spelt out on the basis of these indicators. Drawing on the preceding sections, Section IV makes an assessment of the fiscal reforms and identifies some of the emerging issues. Policy perspectives to further fiscal restructuring are set out as concluding observations in Section V.
I. FISCAL REFORMS - INTERNATIONAL EXPERIENCE
4.5 Fiscal sector reforms have emerged as an integral part of the overall macroeconomic policy framework in several countries belonging to both the advanced economies and the developing world since the late 1970s. A shift in the thinking on the role of fiscal policy arose, inter alia, from the competitive pressures from growing international integration of goods and capital markets and the consequent need for maintaining lower rates of inflation, which had constrained the Government’s ability to raise taxes and monetise deficits. Recent evidence suggests that fiscal contraction can be expansionary for growth as fiscal multipliers could not only be small, but negative as well. Endogenous growth models show that Government’s tax and expenditure policies can affect steady-state growth rates in either direction. Evidence on expansionary fiscal contraction has given more weight to the need for fiscal consolidation.
4.6 The strategy of fiscal adjustment followed by different countries could broadly be categorised into two types, viz., ‘Type 1’ and ‘Type 2’ (Alessina and Perotti, 1996). ‘Type 1’ (followed by most of the European countries in the 1990s) relies primarily on cuts in expenditure on transfers, social security and Government wages and employment. Tax increases are not emphasised and taxes on households either are not raised or are even reduced. On the contrary, ‘Type 2’ adjustments (as followed by most of the European countries in the 1980s) rely mostly on broad-based tax increases, and often the largest increases are on taxes on households and social security contributions. Expenditure cuts are almost all on public investment, while Government wages, employment, and transfers are completely untouched, or only slightly affected. There are episodes of fiscal consolidation where countries (e.g., in Ireland and Italy), which began with ‘Type 2’ kind of fiscal adjustment later switched over to ‘Type 1’.
4.7 Empirical results show that for the same size of fiscal adjustment, ‘Type 1’ adjustments induce a more lasting consolidation of the budget and are also expansionary. ‘Type 2’ adjustments, on other hand, are often reversed soon due to further deterioration of the budget, which have contractionary consequences on the economy. In a study of 20 OECD countries for the period 1960 to 1994, it was observed that of the total 60 episodes of fiscal consolidation efforts during the period, only 16 were successful, and among the successful cases, 73 per cent of the cases of adjustment were on the expenditure side as against only 44 per cent in case of unsuccessful cases (Alessina and Perotti, op. cit). Similarly, of the 74 episodes of fiscal adjustment in 20 countries during 1970 to 1995, it was observed that out of the 17 cases where adjustment was of ‘Type 1’, little less than half the cases were successful, while out of 37 cases of ‘Type 2’ adjustment, only one out of six cases was successful (Mcdermott and Wescott, 1996) (Table 4.1).
Table 4.1: Types of Fiscal Adjustment | ||
Parameter | Type 1 | Type 2 |
1 | 2 | |
Expenditure cuts | Primarily through expenditure cuts | Not so important |
Items of expenditure cuts | On transfers, social security and | Mostly cuts on public investment |
Tax increase | A small fraction of adjustment | Mainly through broad based tax |
Tax on households and | Not raised or even reduced | Largest tax increase is on households and social |
Prevalent during which | In the 1990s | In the 1980s |
Expansionary or | Mostly expansionary | Often contractionary |
Success rate | More successful | Less successful |
Source: Alessina and Perotti (1996) and Mcdermott and Wescott (1996). | ||
4.8 Apart from the type of adjustment, the size of fiscal adjustment has been a crucial element in the success of the fiscal adjustment efforts. This is because the size of fiscal consolidation is related to the overall scope of the reform programme and enhances the credibility of the Government’s commitment to the consolidation. It was observed that fiscal consolidation was sustainable in those cases where fiscal correction in terms of reduction of fiscal deficit was higher (4.0 per cent of GDP in a two-year period). In other cases, where the extent of correction was smaller, fiscal consolidation could not be sustained (Mcdermott and Wescott, op. cit). It has also been found that fiscal corrections do not have intended effects if they fail to indicate a permanent and decisive change in the stance of fiscal policy (Giavazzi and Pagano, 1996).
4.9 A noteworthy feature of the process of fiscal consolidation carried out in the 1990s was the introduction of a sound fiscal framework supported by institutional reforms, intended to reinforce political commitment to fiscal restraint in the face of pressure for expansion. The main justification for these institutional reforms is that they strengthen fiscal discipline and transparency, and therefore, increase accountability for the design and implementation of fiscal policy, while minimising the problems caused by lax fiscal policy. The 'Maastricht Treaty' followed by the 'Stability and Growth Pact' in the euro area, operation of the golden rule - borrowing only to finance capital spending - in UK since 1997 and the Fiscal Responsibility Act of 1994 in New Zealand are some of the examples of institutional reforms accompanying fiscal consolidation. The key elements that these frameworks share include an explicit legal basis, an elaboration of the guiding principles of fiscal policy, a clear statement of the objectives, an emphasis on the need for a long-term fiscal policy, and requirements for fiscal reporting to the public leading to improvement in fiscal performance.
4.10 The cross-country experience suggests that several important issues arise in the context of fiscal adjustment. These include:
the size of the fiscal adjustment to be made;
the composition of fiscal adjustment in terms of whether the adjustment needs to be carried out through cuts in expenditure or by raising revenue or a combination of both, and the components of expenditure and revenue to be adjusted;
the policy mix that must accompany a major fiscal adjustment;
concern for non-policy factors such as global economic growth which effects the consolidation process;
reversibility of the fiscal consolidation process;
the possible adverse macroeconomic impact of fiscal adjustment; and
adoption of appropriate accounting standards and adherence to a fiscal rule framework, that make for transparent and accountable budgeting.
II. BACKGROUND AND APPROACH TO FISCAL REFORMS IN INDIA
Background to Fiscal Reforms
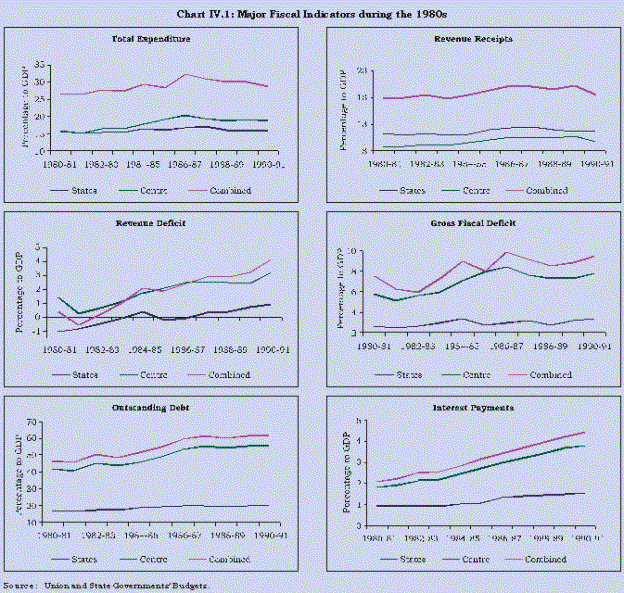
4.11 The need for comprehensive fiscal reforms in India was apparent during the late 1980s, as there was rapid deterioration in Government finances. During this period, the expenditure of the Central Government rose much faster than its revenue leading to a steep rise in the Centre’s fiscal deficit to GDP ratio. For the States, given the restrictions on their capacity to borrow, the increase in expenditure was relatively aligned to the corresponding rise in revenue. Consequently, the rise in the fiscal deficit of States was relatively less steep (Chart IV.1). The sharp increase in revenue deficit of the Central Government and the emergence of such deficits in State finances were the most worrisome developments in the fiscal scenario during the 1980s.
4.12 Reflecting these developments, there was a sharp increase in the outstanding liabilities of both Central and State Governments as ratio to GDP from 41.6 per cent and 16.7 per cent, respectively, in 1980-81 to 55.3 per cent and 19.4 per cent, respectively, in 1990-91. The growing size of liabilities eventually generated a considerable debt-service burden, with interest payments as ratio to GDP rising from 1.8 per cent to 3.8 per cent in case of the Centre and from 0.9 per cent to 1.5 per cent in case of States during the same period (Chart IV.1).
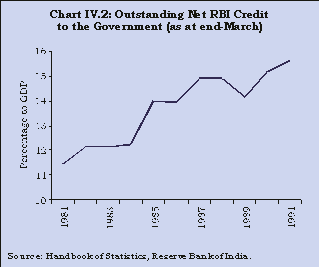
4.13 The underdeveloped nature of the Government securities market and the heavy dependence of Small Saving collections on the level of income resulted in an implicit upper ceiling on Govenment’s access to the market resources.1 This necessitated a large order of monetary accommodation from the Reserve Bank with its attendant monetary implications. The outstanding net Reserve Bank credit to the Government as ratio to GDP rose from 11.4 per cent as at end-March 1981 to 15.6 per cent as at end-March 1991 (Chart IV.2). In order to partially abate the inflationary pressure emanating from growing monetisation of fiscal deficit, discrete upward changes in Cash Reserve Ratio (CRR) were necessitated. With both CRR and Statutory Liquidity Ratio (SLR) approaching their statutory upper limits at the time of the onset of unprecedented macroeconomic crisis of 1991, and given the deleterious macroeconomic consequences of high fiscal deficit, the only option available was to adopt a quick fiscal restructuring programme along with other macroeconomic and institutional reforms.
Fiscal Reforms in India: Policy Measures and Developments
4.14 While a move towards fiscal adjustment was discernible in the pronouncements made as a part of long-term fiscal policy announced in the mid-1980s, a comprehensive fiscal reform programme at the Central Government level was initiated only at the beginning of the 1990s as part of the economic adjustment programme initiated in 1991-92. On the other hand, in the case of States, efforts towards fiscal adjustment began only in the late 1990s. Fiscal reforms in the States were, inter alia, necessitated by:
growing fiscal imbalances;
sluggishness in Central transfers resulting from falling tax to GDP ratio;
introduction of reform-linked assistance as a part of Medium-Term Fiscal Reform Programme on the basis of the recommendation of the Eleventh Finance Commission; and
adjustment programme undertaken in some of the States which are linked to borrowings from multilateral agencies.
Central Government
4.15 Fiscal reforms at the Centre covered tax reforms, expenditure pruning, restructuring of PSUs, and better coordination between monetary and fiscal policies.
(i) Tax Reforms
4.16 Restructuring of the tax system constituted a major component of fiscal reforms with the aim of augmenting revenues and removing anomalies in the tax structure. The main focus of the reforms was on simplification and rationalisation of both direct and indirect taxes drawing mainly from the recommendations of the Tax Reforms Committee, 1991 (Chairman: Raja J. Chelliah). Since the rates were very high and the structure of indirect taxes highly complex, it was considered undesirable to augment revenues merely by raising tax rates. The Committee had recommended adoption of a small number of simple broad-based taxes with moderate and limited number of rates, and with very few exemptions and deductions.
4.17 Accordingly, the tax rates were significantly rationalised and progressively brought down to the levels comparable to some of the developed economies. The key tax reforms have been:
lowering of the maximum marginal personal income tax rate from 60 per cent in 1980-81 to the present level of 33 per cent (inclusive of 10 per cent surcharge on annual income of above Rs.8.5 lakhs, announced in the Union Budget 2003-04);
widening of the tax base by way of a series of steps including introduction of presumptive taxes, adoption of a set of six economic criteria for identification of potential tax payers in urban areas and taxation of services;
reducing the corporate tax rate on both domestic and foreign companies to the current level of 35 per cent and 40 per cent, respectively, from a level of 65 per cent and 70 per cent in 1980-81;
unification of tax rates on closely held as well as widely held domestic companies;
rationalisation of capital gains tax and dividend tax;
progressive reduction in the peak rate of customs duty on non-agricultural products from a level of more than 300 per cent during the period just prior to reforms to the level of 25 per cent as announced in the Union Budget 2003-04; and
reduction of 11 major ad-valorem excise duties to three viz., central rate of 16 per cent, merit rate of 8 per cent and demerit rate of 24 per cent in year 1999-2000, introduction of a uniform 16 per cent CENVAT effective from 2000-01, while retaining special excise duties on specified goods and in the Union Budget 2003-04 rationalisation of excise rate structure by proposing a 3-tier structure of 8 per cent, 16 per cent and 24 per cent which are, however, not applicable to goods attracting specific duty rates.
4.18 The concern with tax rationalisation has been reflected in the appointment of a number of committees to review the tax system in the last few years. The Advisory Group on Tax Policy and Tax Administration for the Tenth Plan, 2001 (Chairman: Parthasarathi Shome) recommended deletion of a number of exemptions and deductions which have become redundant and are not in harmony with a modern tax regime (Government of India, 2001a). Similarly, the Expert Committee to Review the System of Administrative Interest Rates and Other Related Issues, 2001 (Chairman: Y.V. Reddy) recommended the withdrawal of tax concessions available on small savings (Government of India, 2001b). Furthermore, the Task Force on Direct Taxes and Indirect Taxes, 2002 (Chairman: Vijay Kelkar) has reiterated the need to withdraw exemptions and concessions to widen the tax base (Government of India, 2002a; 2002b).
(ii) Expenditure Management
4.19 Successive Central Government budgets in the 1990s contemplated a host of measures to curb built-in growth in expenditure and to bring about structural changes in the composition of expenditure. These included subjecting all ongoing schemes to zero-based budgeting and assessment of manpower requirements of Government departments. This was sought to be achieved by reviewing norms for creation of posts and fresh recruitment and introduction of a Voluntary Retirement Scheme (VRS) for surplus staff. The process also involved review of all subsidies with a view to introducing cost-based user charges wherever feasible, review of budgetary support to autonomous institutions and encouragement to PSUs to maximise generation of internal resources. These measures, by and large, focused on downsizing Government and reducing its role and administrative structure. Further, as an institutional arrangement, the Government constituted an Expenditure Reforms Commission (ERC) to look into areas of expenditure correction. Areas identified by the ERC include, inter alia, creation of a national food security buffer stock and minimisation of cost of buffer stock operations and rationalisation of fertiliser subsidies through dismantling of controls in a phased manner. It also included optimising Government staff strength by a ban on the creation of new posts for two years, introduction of VRS and redeployment of surplus staff in various Government departments and autonomous institutions, to which the Government provides budgetary support through grants. With a view to promoting transparency and curbing the growth of contingent Government liabilities, a Guarantee Redemption Fund has been set up as a part of expenditure management strategy. Steps undertaken in the light of above proposals included:
dismantling of the Administered Price Mechanism (APM) in the petroleum sector and the Oil Pool Account effective from April 2002;
restriction on fresh recruitments to 1 per cent of the total civilian staff strength over the 4 years beginning fiscal 2002-03; and
introduction of a new pension scheme of defined contribution for new recruits in the Budget for 2003-04.
(iii) Restructuring of the Public Sector
4.20 During the reform period, there has been a distinct change in the public perception in favour of reducing the size of public sector and improving private participation. With these underlying objectives, a two-pronged strategy was adopted by the Central Government – reduction in budgetary support to the PSUs and privatisation of existing PSUs.
(iv) Fiscal-Monetary Coordination
4.21 Another important objective of the reform process has been to improve fiscal-monetary coordination [Also see paras 5.27 to 5.29]. This involved steps to ensure wider participation in the Government securities market so as to facilitate elimination of automatic monetisation and pre-emption of institutional resources by the Government. During the 1990s, the Reserve Bank undertook a series of steps towards deepening and widening the Government securities market. Some of the major steps in this direction included aligning of coupon rates on Government securities with market interest rates, introduction of an auction system, introduction of primary dealers and setting up of Delivery versus Payment (DvP) system. Furthermore, following the ‘Supplemental Agreement’ between the Government of India and the Reserve Bank in September 1994, the abolition of ad hoc Treasury Bills was made effective from April 1997, thereby replacing the automatic monetisation of deficit by a system of Ways and Means Advances (WMA) to meet only the temporary mismatches in cash flows of the Central Government. Concomitant to these measures, Statutory Liquidity Ratio (SLR) was reduced to 25 per cent by 1997 and Cash Reserve Ratio (CRR) was reduced in phases to 4.75 per cent by November 2002.
(v) Institutional Measures
4.22 As an institutional mechanism to strengthen fiscal discipline, the Central Government is contemplating enactment of Fiscal Responsibility and Budget Management Bill (FRBM), 2000 (Government of India, 2000b). The Bill stresses on inter-generational equity in fiscal management and long-term macroeconomic stability. The original Bill envisaged a complete elimination of revenue deficit and reduction of the fiscal deficit-GDP ratio to 2 per cent by the Central Government by end-March 2006. The Bill also envisaged a reduction in total liabilities of the Centre to no more than 50 per cent of GDP by March, 2011. The Bill, introduced in the Parliament in 2000, was referred to the Standing Committee on Finance for examination and report. A revised Bill is expected to be introduced in Parliament soon.
State Governments
4.23 Measures initiated by the States may be broadly grouped under revenue mobilisation, expenditure containment, public sector restructuring and institutional reforms. In addition to States’ own efforts, the Centre has also taken initiatives to strengthen the reform process at the State level. Further, the policy initiatives undertaken by the Reserve Bank have a bearing on State finances as well. These measures are reviewed next.
(i) Tax Reforms
4.24 Recognising the need for strengthening their finances, States have initiated measures towards enhancement/restructuring of various taxes within their fold, such as, land revenue, vehicle tax, entertainment tax, sales tax, betting tax, electricity duty, tax on trades, professional tax and luxury tax. It was recognised that competitive sales tax reductions by States aimed at attracting investment led to revenue losses without commensurate gains. With a view to harmonising inter-State taxes and ultimately switch over to State-level value added tax (VAT), States introduced uniform floor rate during 2000. Currently, preparations are underway for the introduction of Value Added Tax (VAT) in April 2003.
(ii) Non-tax Measures
4.25 States have also undertaken measures to enhance non-tax revenues by reviewing/rationalising the royalties payable to them, including those on major and minor minerals, forestry and wildlife, revision of tuition fees, medical fees, irrigation water rates and tariffs on urban water supply. The issue of raising user charges commensurate with the cost of public services rendered, however, has not been given serious consideration yet. Recognising this aspect, the Medium Term Fiscal Reform Programmes finalised by several States have emphasised the cost effectiveness and raising of user charges of services rendered by them.
(iii) Expenditure Management
4.26 The State Governments’ measures to contain expenditure, inter alia, include restrictions on fresh recruitment/creation of new posts, review of manpower requirements and cut in establishment expenses and reduction in non-merit subsidies through better targeting.
(iv) Public Sector Restructuring
4.27 Several States have shown interest in undertaking a comprehensive review of the functioning of the State Public Sector Undertakings (SPSUs), including the possibility of closing down of non-viable units after providing for suitable safety-nets to the employees including VRS. States such as Tamil Nadu, Kerala, Haryana, Karnataka, Himachal Pradesh, Goa and Orissa have encouraged private sector participation in the transport and power generation sectors. In their recent budgets (2002-03), Karnataka has come out with a Policy Paper on restructuring of SPSUs, while Maharashtra has introduced a Bill for setting up a Board for Restructuring of the SPSUs. In order to strengthen the administrative machinery, many States have initiated measures to computerise their records as well as their day-to-day functioning.
4.28 Several States have also initiated measures to reform the power sector, which is crucial for the fiscal reforms. The main objective of these reforms was to mobilise private sector resources for augmenting power generating capacity. The additional capacity through independent power producers has, however, been far short of expectations. Recognising the need for transmission and distribution reforms, 21 States, have either constituted or notified the constitution of State Electricity Regulatory Commission (SERC).2 A majority of these States have also proposed to unbundle or corporatise the SEBs. One of the major tasks being entrusted to SERCs is to rationalise tariff rates. Further, 20 States have signed Memorandum of Understandings (MoUs) with the Union Ministry of Power to undertake reforms in a time-bound manner.
(v) Institutional Reforms
4.29 The institutional reforms undertaken by the States are also aimed at facilitating the fiscal consolidation process. Four States have initiated proposals to provide statutory backing to the fiscal reform process through enabling legislation. While Karnataka has already enacted the Fiscal Responsibility Bill in August 2002, Maharashtra and Punjab have introduced Fiscal Responsibility Bills in their legislatures. The Kerala Government has also proposed to introduce a Fiscal Accountability Bill.
4.30 In recent years, initiatives have been taken by some States to enhance transparency of budgetary operations. The Core Group on Voluntary Disclosure Norms for State Governments submitted its report in January 2001. The transparency in State budgets is sought to be enhanced in stages and a model format of the disclosure norms has been prescribed for the States by the Group. The States are being sensitised to the principle of transparency in Government operations so as to ensure macro fiscal sustainability and fiscal rectitude. In the Budgets for 2002-03, several States have published ‘Budget at a Glance’ along the lines of the Union Budget as a first step. Some of the States also provide details on outstanding guarantees. In addition, a few States have started disseminating information on consolidated budgetary position, which are inclusive of off-budget borrowings.
(vi) Centre’s Initiatives
4.31 In pursuance of the recommendations of the Eleventh Finance Commission (EFC), an Incentive Fund for State fiscal reforms has been set up at the Centre. The disbursements from the Incentive Fund will be based on a single monitorable fiscal objective. Accordingly, each State would need to achieve a minimum improvement of 5 percentage points in the revenue deficit as a proportion of their revenue receipt each year till 2004-05. For States with a revenue surplus, 3 percentage points improvement in the balance in the current revenue (BCR) is required for release of funds under this facility. Accordingly, several State Governments have drawn up Medium-Term Fiscal Reforms Programme (MTFRP) and entered into MoUs with the Union Ministry of Finance. The MTFRP of States cover various areas such as fiscal consolidation, public sector enterprises reform, power sector reforms and fiscal transparency.
4.32 The Union Budget 2002-03 made provisions for reform-linked assistance of Rs.12,300 crore for States under various schemes such as Accelerated Power Development and Reform Programme (APDRP), Accelerated Irrigation Benefit Programme (AIBP), Urban Reforms Incentive Fund (URIF), and Rural Infrastructure Development Fund (RIDF). In addition, a lump-sum amount of Rs.2,500 crore has been proposed for implementing policy reforms in sectors constraining growth and development.
(vii) Reserve Bank’s Initiatives
4.33 In the recent past, the Reserve Bank has initiated a close and intensive interaction with State Governments on a regular basis, and on a wide range of issues. Accordingly, several significant initiatives have been taken during the reform period:
In its role as a banker to States, the Reserve Bank had examined the implications of contingent liabilities/guarantees extended by States. The Technical Committee on State Government Guarantees, 1999 has recommended placing limits on Government guarantees;
Since 1999, States have also been encouraged to access the market for a part of their market borrowings. Within the approved borrowing programme, State Governments are provided with the option of raising resources in a flexible manner in terms of method, timing and maturity. State Governments can borrow from the market between 5 per cent to 35 per cent of the approved borrowing limit under the new scheme. So far, 12 States have raised funds directly from the market. The gains from the auction mechanism were seen from the fact that the weighted average interest rates were below the pre-announced rates;
The Reserve Bank has been advising the State Governments in areas such as cash management, funds management and reforms in budgetary practices;
Mounting debt of the State Governments is increasing the interest burden on State finances. To achieve a sustainable level of debt, since 1999-2000, a Consolidated Sinking Fund has been set up in the Reserve Bank, which is optional for State Governments. Eleven States have so far started operating the Consolidated Sinking Fund to meet redemption of their market loans. Each State is required to contribute 1 to 3 per cent of its outstanding market loans each year to the Fund; and
The Reserve Bank constituted a Group of State Finance Secretaries on State Government Guarantees in 2001 to analyse and classify different type of guarantees including letters of comfort issued by the States and to examine the fiscal risk under each type of guarantees.
III. PERFORMANCE DURING THE 1990s
4.34 Corrective measures on the fiscal front initiated at the beginning of the 1990s produced some promising results during the first half of the decade. Expenditure growth could be curtailed leading to a decline in the fiscal deficit and the outstanding liabilities of the Government to GDP ratio. During 1990-91 to 1996-97 (excluding 1993-94), the reduction in total expenditure to GDP ratio by more than 3.5 percentage points narrowed the fiscal gap by 3 percentage points and reduced the debt-GDP ratio by over 5 percentage points. However, the fiscal consolidation even during the first half of the 1990s was brought about primarily through curtailment in capital expenditure. Decline in consumption expenditure was relatively small. From 1997-98, expenditure started rising once again, and by the year 2001-02, all the major fiscal parameters, viz., revenue deficit, fiscal deficit, and public debt rose to levels higher than those prevalent at the beginning of the reform process (Chart IV.3, Table 4.2).
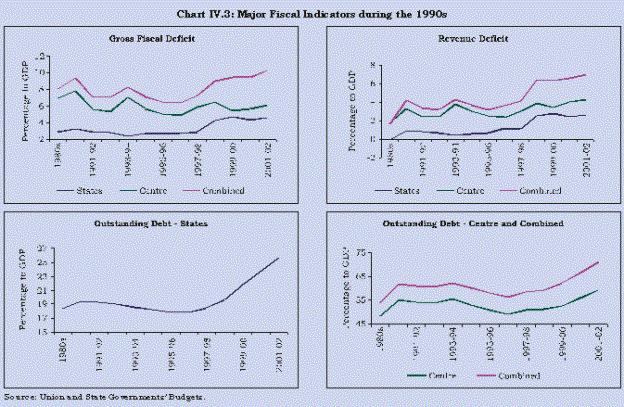
Table 4.2: Major Fiscal Indicators of the Government Sector* | ||||||
(Per cent) | ||||||
Item | 1981-82 to | 1990-91 to | 1997-98 to | ||||||
Average | Ratio to | Average | Ratio to | Average | Ratio to | ||||
Growth | GDP | Growth | GDP | Growth | GDP | ||||
1 | 2 | 3 | 4 | 5 | 6 | ||||
Revenue Receipts | 16.14 | 19.01 | 14.17 | 18.57 | 11.64 | 17.72 | |||
Total Expenditure | 16.21 | 28.84 | 13.12 | 27.01 | 14.62 | 27.68 | |||
Capital Expenditure | 12.93 | 8.23 | 6.59 | 4.81 | 16.29 | 3.96 | |||
Revenue Expenditure | 17.78 | 20.62 | 14.61 | 22.20 | 14.43 | 23.73 | |||
Gross Fiscal Deficit | 17.83 | 8.03 | 11.60 | 7.38 | 21.48 | 9.13 | |||
Revenue Deficit | 31.39 | 1.65 | 19.93 | 3.63 | 31.48 | 6.07 | |||
Development Expenditure | 15.59 | 18.11 | 11.00 | 15.32 | 13.43 | 14.33 | |||
Non-Developmental Expenditure | 17.23 | 10.45 | 16.13 | 11.69 | 16.03 | 13.35 | |||
* Government sector refers to finances of Central and State Governments. | |||||||||
Source : Union and State Governments’ Budgets. | |||||||||
Trends in Revenue
4.35 The efficacy of tax reforms for augmentation of tax revenue, expenditure correction, restructuring of public sector, public debt management policies and institutional reforms appears to be rather limited so far.
Trends in Tax Revenue
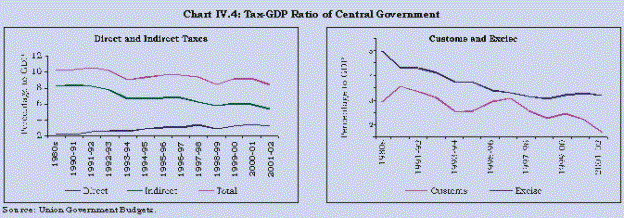
4.36 Tax reforms have generally led to a rise in tax revenue to GDP ratio across countries (Shome, 1992; Shome, 1995). In the Indian context, the expected increase in tax buoyancy a la ‘Laffer curve effect’ did not occur. Since the onset of tax reforms, the tax-GDP ratio of the Central Government has suffered a persistent decline. This has been a major drag on the reform process. The tax-GDP ratio declined from an average of 9.9 per cent during the 1980s to 9.7 per cent in the first half of the 1990s and further to 9.0 per cent in the second half of the 1990s. The pattern is, however, not the same across different types of taxes. Direct tax collection to GDP ratio rose steadily from 2.0 per cent in the 1980s to 2.3 per cent in the first half of the 1990s and further to 2.9 per cent in the latter half of the 1990s. On the other hand, the ratio of indirect tax collection to GDP declined from 7.9 per cent in the 1980s to 7.3 per cent and 6.1 in the first and second halves of the 1990s, respectively (Chart IV.4).
4.37 The decline in the tax to GDP ratio is explained by a combination of factors that led to a sharp fall in total tax buoyancy from 1.07 for the period 1981-93 to 0.96 for 1981-2001, implying buoyancy could be less than unity during the post-tax reform period 1994-2001. 3, 4 While the buoyancy of direct taxes is estimated to be higher at 1.19 for the period 1981-2001 as compared with 1.07 for the pre-tax reforms period (1981-1993), the buoyancy of indirect taxes dipped considerably to 0.88 from 1.07 in the corresponding period (Table 4.3).
Table 4.3: Buoyancies of Central Taxes | ||||
Tax | 1981 to 1993 | 1981 to 2001 | ||
1 | 2 | |||
1. | Total Tax to GDP | 1.07 | 0.96 | |
2. | Direct Tax to GDP | 1.07 | 1.19 | |
3. | Corporate Tax to GDP | 1.02 | 1.13 | |
4. | Personal Tax to GDP | 0.92 | 1.23 | |
5. | Indirect Tax to GDP | 1.07 | 0.88 | |
6. | Excise Tax to Manufacturing | 0.96 | 0.83 | |
7. | Excise Tax to GDP | 0.97 | 0.84 | |
8. | Customs Tax to Imports | 1.20 | 0.77 | |
9. | Customs Tax to GDP | 1.24 | 0.93 | |
Note | :. | Separate estimates for 1994-2001 were not attempted to ensure that adequate degrees of freedom are available | ||
Source | : | Computed using data on taxes from Union Budget documents and gross domestic product from National Accounts Statistics. | ||
4.38 The increase in direct tax collections despite a significant cut in marginal tax rates could be attributed to the combined effect of better compliance, broadening of the tax base and increase in income. The introduction of presumptive tax, adoption of economic criteria for identification of potential taxpayers and removal of some exemptions helped in base widening. Measures such as rationalisation and simplification, both in personal tax and corporate tax, would have induced better compliance. This apart, the revision in public sector wages following the recommendation of Pay Commission is also ascribed as a contributing factor in strengthening the direct tax collection (Rao, 2000), The estimate of personal income tax buoyancy does indicate that while there was a positive impact of pay hike, it has not been statistically significant at the conventional level.5
4.39 Unlike direct taxes, rate cuts have been important factors in reducing the indirect tax collection, as there was no commensurate gain in terms of base expansion or better compliance. It was expected that the sharp cut in custom duties from a peak rate of more than 300 per cent in the period just prior to reforms to about 30 per cent in 2002-03 would lead to a net fall in custom duty collections. Fall in excise duty collections, however, came as a surprise as the rate cuts were expected to boost growth in industrial output. The less than expected buoyancy in the excise tax seems to follow from slower than expected growth in industrial output during the major part of the reform period. The rising share of services in overall GDP which largely falls outside the tax net and progressive extension of MODVAT could have affected buoyancy estimates (Mohan, 2000). Ideally, credit extended to inputs under VAT system needs to be neutralised through increase in tax rates on end-products. Instead tax rates have been scaled back leading to a fall in excise tax collection (Shome, 1997). Another important reason for reduced revenue collection from both custom and excise duties is that the reduction in rates were not accompanied by removal of concessions and exemptions (Government of India, 2001a).
4.40 A comparison of alternative buoyancy estimates with respect to GDP and the actual base indicates that though there was a marked decline in buoyancy in case of both customs and excise during the reform period, the fall was partly made up by the pick up in imports in case of customs and some base expansion or better compliance in respect of excise. In the case of custom duties, the decline in buoyancy in terms of imports was much more than in terms of GDP. On the other hand, in case of excise, there was hardly any divergence between its buoyancy in terms of manufacturing output (which is the base for excise tax) and that in terms of GDP (Table 4.3).
4.41 Under the existing federal fiscal structure, the States’ rights to collect taxes are largely confined to indirect taxes, predominantly commodity taxes like sales tax and other indirect levies, such as State excise duties, service tax on entertainment, on betting and gambling and on passengers and goods. Direct taxes include few items like land revenue and agricultural income tax. Buoyancy estimates of sales tax (which accounts for around 60 per cent of States’ own revenue) and own tax for 15 major States during 1981 to 2000 show that the buoyancies of sales tax and own tax during the sub-period 1981 to 1993 were uniformly higher than the respective buoyancies for the full period, indicating significant fall in buoyancies during the reform period. An important reason for the fall in tax buoyancies is the competitive tax reductions by States to attract trade and industry (Government of India, 2000c). The decline in buoyancies also follows from higher growth in services, which are not adequately taxed but raises the Net State Domestic Product (NSDP). However for most of the States, buoyancies for both sales tax and own tax continued to be more than unity during the reform period (Table 4.4). Contemporaneously, for all the States combined, own tax revenue as a percentage to GDP increased from 5.1 per cent during the 1980s to 5.4 per cent during the first half of the 1990s. Though the ratio marginally declined from 5.5 per cent in 1994-95 to around 5.1 per cent in 1998-99, it improved to 5.6 per cent by 2000-01. Thus, on average, tax-GDP ratio for States during the reform period was higher than that of the 1980s.
Table 4.4: Buoyancy of State Taxes | |||||||||
(Per cent) | |||||||||
Own Tax Revenue | Sales Tax | ||||||||
Buoyancy | Ratio to NSDP | Buoyancy | Ratio to NSDP | ||||||
1981 to | 1981 to | 1981 | 1994 | 1981 to | 1981 to | 1981 | 1994 | ||
1993 | 2000 | to 1993 | to 2000 | 1993 | 2000 | to 1993 | to 2000 | ||
1 | 2 | 3 | 4 | 5 | 6 | 7 | 8 | ||
Andhra Pradesh | 1.03 | 0.93 | 9.23 | 7.71 | 1.08 | 1.07 | 4.81 | 5.18 | |
Assam | 1.30 | 1.22 | 3.95 | 4.74 | 1.35 | 1.23 | 2.46 | 2.92 | |
Bihar | 1.13 | 1.14 | 4.76 | 5.58 | 1.12 | 1.10 | 3.26 | 3.63 | |
Gujarat | 1.17 | 1.03 | 9.27 | 9.26 | 1.21 | 1.03 | 6.27 | 6.14 | |
Haryana | 1.08 | 0.98 | 8.80 | 8.20 | 1.08 | 1.07 | 4.09 | 4.42 | |
Karnataka | 1.14 | 1.07 | 10.11 | 10.84 | 1.22 | 1.13 | 5.53 | 6.45 | |
Kerala | 1.17 | 1.08 | 10.46 | 11.60 | 1.23 | 1.14 | 6.72 | 8.03 | |
Madhya Pradesh | 1.13 | 1.08 | 6.87 | 7.33 | 0.99 | 0.98 | 3.37 | 3.25 | |
Maharashtra | 1.03 | 0.98 | 8.79 | 8.52 | 1.00 | 0.95 | 5.59 | 5.12 | |
Orissa | 1.32 | 1.17 | 4.93 | 5.60 | 1.30 | 1.25 | 2.75 | 3.59 | |
Punjab | 0.96 | 0.92 | 8.09 | 7.23 | 0.98 | 0.93 | 3.71 | 3.34 | |
Rajasthan | 1.10 | 1.07 | 7.09 | 7.70 | 1.02 | 1.00 | 4.06 | 4.02 | |
Tamil Nadu | 1.05 | 1.03 | 10.65 | 11.06 | 1.06 | 1.02 | 7.01 | 7.25 | |
Uttar Pradesh | 1.17 | 1.10 | 5.65 | 6.18 | 1.14 | 1.09 | 3.03 | 3.27 | |
West Bengal | 1.19 | 0.98 | 6.23 | 5.85 | 1.17 | 1.02 | 3.62 | 3.62 | |
Note : | See note to Table 4.3. | ||||||||
Source : | Computed using data on taxes from State Budget documents and net state domestic product from National Accounts Statistics. | ||||||||
Trends in Non-Tax Revenue
4.42 A key objective of the reform process was the augmentation of non-tax revenue by way of enhancement of user charges and returns on Government investments through restructuring of PSUs. The intention of restructuring PSUs was to improve their efficiency and thereby enhance the capacity to generate returns on Government investments. Non-tax revenue of the Central Government as a proportion to GDP recorded an improvement from 2.1 per cent in 1990-91 to 3.0 per cent in 2001-02 (Chart IV.5). The trends in components of non-tax revenue reveal that increase in dividend and profits, and economic services, fully account for the improvement in Centre’s collection of non-tax revenue, as growth in other components continued to be stagnant during the reform period. Surplus transfers from the Reserve Bank, which is a major component of dividend and profits, increased from Rs.210 crore in 1990-91 to Rs.10,320 crore in 2001-02, thereby raising its share in the total from 1.8 per cent to 15.2 per cent (Table 4.5). The size of the transfer from the Reserve Bank, inter alia, grew on account of earnings from the deployment of foreign currency assets, conversion of 4.6 per cent Treasury Bills into marketable securities and discontinuation of the practice of crediting large sums to the National Industrial Credit (LTO) Fund.

Table 4.5: Composition of Non-Tax Revenue of the Central Government | |||||
(Per cent) | |||||
Item | 1980s | 1990-91 | 1996-97 | 2001-02 | |
1 | 2 | 3 | 4 | ||
1. | Interest Receipts | 68.5 | 72.9 | 67.9 | 52.4 |
2. | Dividends & Profits of which | 8.2 | 6.5 | 11.8 | 25.5 |
Reserve Bank Profits | 4.1 | 1.8 | 4.6 | 15.2 | |
3. | General Services | 3.5 | 4.2 | 4.0 | 4.2 |
4. | Social Services | 3.2 | 0.5 | 0.4 | 0.4 |
5. | Economic Services | 9.0 | 7.2 | 10.2 | 13.7 |
6. | Fiscal Services | 5.5 | 2.6 | 1.3 | 0.5 |
Source : Union Government Budgets. | |||||
4.43 For the States, the decline in the non-tax to GDP ratio was from 1.6 per cent in 1990-91 to 1.4 per cent in 2001-02 (Chart IV.5). No significant changes in their composition are discernible, barring a rise in the share of interest receipts and a distinct fall in the share of economic services (Table 4.6).
Table 4.6: Composition of Own Non-Tax Revenue of State Governments | ||||
(Per cent) | ||||
Non tax revenue | 1980s | 1990-91 | 1996-97 | 2000-01 |
1 | 2 | 3 | 4 | |
Interest Receipts | 28.2 | 26.0 | 34.7 | 36.4 |
Dividends and profit | 0.5 | 0.4 | 0.7 | 0.5 |
General Services | 12.9 | 20.7 | 22.6 | 19.4 |
Social Services | 8.2 | 6.3 | 5.1 | 7.3 |
Economic Services | 50.2 | 46.6 | 36.9 | 36.4 |
Source : State Governments’ Budgets. | ||||
4.44 The inability to raise user charges has been relatively more pressing for States than the Centre. The States account for nearly three-fourth of total spending on social services, and more than half of the total spending on economic services provided by the Government sector. User charges recovered from such services are much lower as compared with spending on such accounts. Our estimates of user charges for various services rendered by the State Governments indicate that cost recovery for education during the 1990s has been lowest at 1.2 per cent, followed by health (4.7 per cent) and irrigation (8.5 per cent), without any firm indication of improvement during the reform period.6
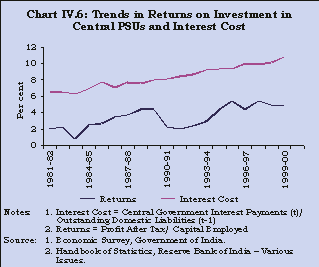
4.45 Apart from low user charges on the services rendered by the Government, the sluggishness in non-tax revenue also follows from continuing inadequate returns on public investment. The outstanding investment in Central PSUs amounted to Rs.3,03,400 crore as at end-March 2000. The State Governments’ investment amounted to nearly Rs.75,000 crore in statutory corporations and another Rs.42,000 crore in the Government companies as at end-March 1999. In the case of Central PSUs, although returns on capital employed have improved from a low level of 2.5 per cent in the 1980s to 2.8 per cent in the early 1990s and further to around 5.0 per cent in the latter half of the 1990s, dividends from PSUs remain inadequate to finance future investment opportunities through internal finance (Chart IV.6). Beside operational inefficiency, the poor returns on investments in, both, Central and State PSUs also reflect the limitations of pricing policies as well as heavy implicit and explicit subsidies (Box IV.1).
Box IV.1 Public sector undertakings (PSUs), wholly or partially owned by the Government, affect the fiscal position of the Government through their operations. While PSUs contribute to the exchequer by way of dividend payments, interest payments and through indirect taxes and other duties, there are also transfers of funds from the exchequer to the PSUs in the form of budgetary support. These modes of transfer reflect explicit impact of PSU operations on the fiscal position of the Government. There are also other implicit transfers through tax and subsidies embedded in the policies of the Government. For instance, a PSU enjoying monopoly status due to entry restrictions and pricing its products on cost plus basis generally amounts to an implicit tax on the public and subsidy to the PSU. On the other hand, provision of commodities to a select clientele or segment of the population at a price less than the cost would amount to a implicit subsidy to the public and a tax on the PSUs. The fiscal impact of PSU operations depends upon, both, the efficiency levels and government policies. An efficient PSU may not only generate internal resource to finance its capital needs, but may also generate surpluses for the exchequer. On the other hand, a poor performer may be a drag on the finances of the Government. Besides efficiency, ability of the enterprise to generate surpluses/internal resources is also intimately linked with the policies of the Government. Implicit tax or subsidies can constrain or enhance the ability of the enterprise to generate additional resources. Owing to implicit subsidies to the public, an enterprise efficient otherwise can turn into a financial drag in explicit terms whereas an inefficient enterprise owing to implicit tax on the public can generate surpluses for the exchequer. Therefore, any valid assessment of the fiscal impact of the operations of the PSUs should essentially take into account both the explicit and implicit aspects of the transactions/transfers between the Government and the PSUs. |
4.46 In the case of State-level enterprises, returns do not cover even a fraction of their cost of funds (Government of India, 2000c). Capital invested in SEBs account for the bulk of investments made by the State Governments. Although the Electricity (Supply) Act, 1948 requires SEBs to earn a minimum yield of 3 per cent on their net fixed assets, they have rather registered a persistent negative return over the years (Box IV.2). The State Road Transport Undertakings (SRTUs), the other segment attracting major public investments, have also been a drag on the State budgets.
Box IV.2 Poor financial performance of public sector undertakings (PSUs) has been the most debilitating drag on the public finances in India, as a large amount of budgetary funds are locked in these enterprises. Investment in these enterprises takes the form of equity as well as loans (Government of India, 2000). As on March 31, 2001, there were 834 State level PSUs, and total investment in them was estimated at Rs.1,72,198 crore. The State Electricity Boards (SEBs) account for the bulk of the States’ investments in PSUs. Far from yielding three per cent rate of return on their net fixed assets as stipulated in the Electricity (Supply) Act, 1948, the SEBs registered a negative return of 12.7 per cent on their capital in 1992-93, which went up to 43.1 per cent in 1999-2000, revealing a steady deterioration. The commercial losses of SEBs increased from Rs.3,083 crore in 1990-91 to Rs.26,343 crore in 1999-2000. The deteriorating financial position of SEBs has been due mainly to a high level of receivables (about 33 per cent of annual revenue in 1999-2000), low plant load factor (67.3 per cent in 1999-2000 as against an ideal PLF of 80 per cent and above), high transmission and distribution (T&D) losses (31 per cent in 1999-2000, as against about 10 per cent in advanced countries), irrational pricing policy (recovery rate of 67.8 per cent of cost of power supply in 1999-2000), high share of establishment and administration costs in total cost (13.3 per cent in 1999-2000). Most of the SEBs are in severe financial stress. As a result, they have not been able to pay for the power, equipment and raw material supplied to them by Central Public Sector Undertakings (CPSUs). Their total outstanding dues to CPSUs have risen to more than Rs.41,000 crore as on February 28, 2001.The operations of SEBs have also impacted State finances significantly. The subsidies provided by the State Governments to partly compensate the SEBs for the subsidised sale of electricity to agriculture and domestic sectors increased from Rs.3,182 crore in 1992-93 to Rs.11,265 crore in 1999-2000 (Government of India, 2002c). State Governments have also been providing guarantees in respect of SEBs’ loans from Power Finance Corporation, Life Insurance Corporation, General Insurance Corporation, Unit Trust of India and Rural Electrification Corporation and payment assurances to private power projects for sale of electricity to SEBs. These guarantees have exposed the States to fiscal risk, as in the event of default, these guarantees will have to be taken on States’ budgets, which will impact their finances further. The ‘Expert Group on SEBs’ Outstanding Dues’ (Chairman: Montek Singh Ahluwalia) submitted its report in May 2001, which was endorsed by the Empowered Group of Chief Ministers in March 2002. As per the recommendations of the Empowered Group, the outstanding dues of SEBs to the CPSUs amounting to about Rs.44,000 crore as on September 30, 2001 were to be taken on State Governments’ account and securitised by the concerned States through a one-time settlement by issuing tax-free bonds with coupon rate of 8.5 per cent to CPSUs, along with the clear understanding that SEBs will henceforth pay their current dues to CPSUs. This was to enable SEBs to clean up their books and raise resources to fund their development schemes. In addition, this would also meet equity requirements of CPSUs and leverage them for their expansion schemes. The scheme is making headway as a substantial number of State Governments have consented to it in the context of meeting payment obligations of SEBs to National Thermal Power Corporation (NTPC), the CPSU which has the largest accumulated receivables from SEBs and successive utilities. This scheme will, however, further impact the State finances as the State Governments will be required to make provision for meeting debt service obligations for the bonds issued to CPSUs on the one hand and ensuring payment of SEBs’ current dues to CPSUs on the other in their budgets in the coming years. As a medium-term strategy to make SEBs viable, it is useful to adopt cost-based pricing for each consumer segment and to raise the average tariff levels as recommended by the Report of the Expert Group on Commercialisation of Infrastructure Projects (NCAER, 1996). Further reforms in this area could also include introduction of ‘time-of-day’ pricing, explicit targeting of subsidies and ‘power pooling’ arrangement. |
Resource Transfer to States from the Centre
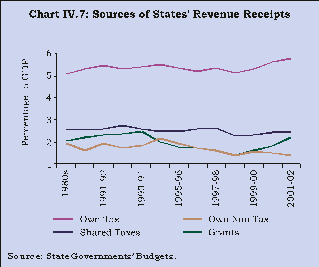
4.47 In addition to States’ own tax and non-tax revenue, the resource base of State Governments also includes transfers from the Central Government in the form of devolution of Central taxes and grants-in-aid and contribution. Both forms of transfers to States have decelerated over time. Although successive Finance Commissions recommended devolution of higher amounts through either upward revisions of the coverage of the shareable items, or by increasing the magnitude of the States’ share (Tenth Finance Commission, 1994), the quantum of funds transferred to States as a ratio to GDP has been lower in the 1990s as compared to that of the 1980s, reflecting sluggishness or lower buoyancy of Central taxes (Chart IV.7). The Centre-State tax sharing system has been pointed out as one of the factors having disincentive and efficiency reducing effects on tax collection (Srinivasan, 2000). The main argument here is that the Centre’s efforts in collecting income tax, which is to be shared, would be less vigorous than in the case of custom duties, which accrue fully to the Central Government. The argument, however, does not receive support from the observed recent trends. Buoyancies of direct taxes estimated above showed marked improvement while that of custom duties slumped sharply during the reform period. Moreover, changes in the transfer formula by the Eleventh Finance Commission, 2000, has further reduced this possible bias, as all the taxes have become shareable with effect from 2000-01.
4.48 To sum up, the sluggishness in Central Government revenues was largely the result of lower buoyancy of indirect taxes caused by cut in tax rates without adequate expansion in the tax base. The inadequate growth in States’ revenue, on the other hand, was the result of their inability to levy appropriate user charges and tax the services sector, combined with lower Central transfers due to falling tax buoyancy.
Trends in Expenditure
4.49 Government consumption and investment spending constitute an important part of aggregate demand in the economy. It influences growth through several channels. An increase in public spending on physical capital could positively influence the long-term growth. The impact of such spending in human capital formation could be larger but benefits require longer gestation period. So is the case with Government spending on research and development (R&D). As such, any programme of stabilisation-cum-adjustment, has to give considerable attention to the expenditure side of fiscal restructuring. It is important to plan expenditure reduction while improving quality of public spending to aim simultaneously at supporting growth with equity and improving fiscal balances. In India, expenditure/GDP ratio of the Centre had risen from about 12.3 per cent in 1970-71 to around 20 per cent in the latter half of the 1980s. This had placed a difficult burden on budgetary balances. With a view to narrowing down the fiscal gap, particularly by bridging the revenue deficit, a cut in current expenditure was considered essential.
4.50 The steps taken to compress expenditure led to a reduction in the size of overall public expenditure as a ratio to GDP in the initial years of the 1990s. The combined expenditure of Centre and State Governments as a ratio to GDP declined from 28.8 per cent in 1990-91 to 25.1 per cent in 1996-97. However, the trend reversed and the expenditure to GDP ratio once again began to follow an upward movement after 1996-97 and reached 29.5 per cent in 2001-02. Furthermore, the efforts to augment investment expenditure by cutting consumption expenditure did not materialise. This was due to the fact that at, both, the national and sub-national levels of Government, expenditure correction was brought about mainly through cut in capital expenditure. Between 1990-91 to 1996-97, although combined revenue expenditure fell by 1.2 percentage points, it increased again by about 3.6 percentage points between 1996-97 and 2001-02. On the other hand, there was a steep fall of 2.5 percentage points in the capital expenditure to GDP ratio between 1990-91 and 1996-97, though it rose marginally by 0.8 percentage point between 1996-97 to 2001-02. Thus, since the beginning of the 1990s upto 2001-02, while the revenue expenditure to GDP ratio increased from 22.8 per cent to 25.2 per cent, the capital expenditure to GDP ratio declined from 6.0 per cent to 4.4 per cent (Chart IV.8, Table 4.7). The deterioration in capital expenditure contributed to the decline in the share of public investment from 9.3 per cent of GDP in 1990-91 to 6.3 per cent in 2001-02.
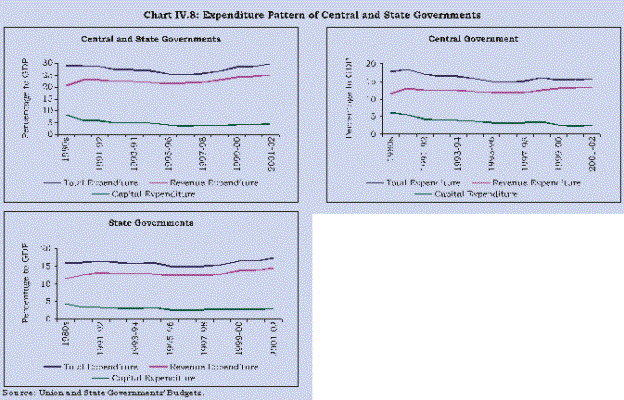
Table 4.7: Trends in Government Expenditure | ||||
(Percentage to GDP) | ||||
1980s | 1990-91 | 1997-98 | ||
to 1996-97 | to 2001-02 | |||
1 | 2 | 3 | 4 | |
Centre | Total Expenditure | 17.74 | 16.29 | 15.59 |
Revenue Expenditure | 11.49 | 12.28 | 12.70 | |
Capital Expenditure | 6.25 | 4.01 | 2.89 | |
States | Total Expenditure | 15.90 | 15.64 | 15.77 |
Revenue Expenditure | 11.61 | 12.67 | 13.07 | |
Capital Expenditure | 4.29 | 2.97 | 2.70 | |
Combined | Total Expenditure | 28.84 | 26.01 | 27.68 |
Revenue Expenditure | 20.62 | 22.20 | 23.73 | |
Capital Expenditure | 8.23 | 4.81 | 3.95 | |
Source : Union and State Governments’ Budgets. | ||||
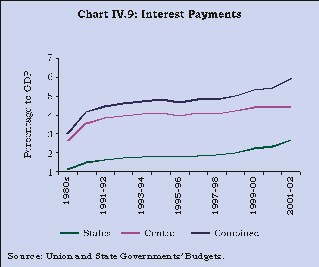
4.51 The major contributing factor imparting a downward rigidity to the revenue expenditure relates to items of committed expenditure, of which, interest payments and expenditure on wages and salaries are prominent. Interest payments as a ratio to GDP increased from 3.8 per cent in 1990-91 to 4.7 per cent in 2001-02 for the Central Government, while for the States, the corresponding rise was steeper from 1.5 per cent to 2.8 per cent (Chart IV.9). During the phase of fiscal consolidation, even though the debt to GDP ratio for the Central and State Governments fell from 61.7 per cent in 1990-91 to 56.5 per cent in 1996-97, the rise in the weighted average interest rate on Central Government and State Governments market borrowings, following the progressive alignment of coupon rates with market interest rates, led to the rise in interest payments. On the other hand, in the latter half of the 1990s, though the cost of borrowings declined consistently due to fall in market interest rates, interest payments continued to rise unabated. This essentially reflects the impact of sizeable outstanding liabilities contracted at higher interest rates during the first half of the 1990s, and also the return to rising deficit, and consequent, increase in public debt to GDP ratio to 71.1 per cent by 2001-02.
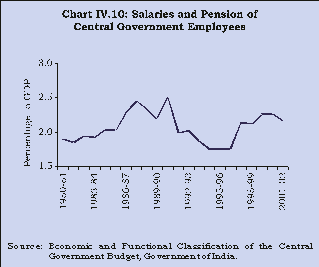
4.52 The rising wage bill has been considered as an important element in fiscal deterioration in recent years. One view is that the rise in spending on wages and salaries and pension was the prime factor for the abnormal rise in revenue expenditure during the 1990s (Acharya, 2001; Rao, 2000). The Eleventh Finance Commission (EFC), on the other hand, notes that the surge in revenue expenditure towards the late 1990s cannot be attributed only to salary and pension revision, though it led to immediate and acute fiscal stress all round (Government of India, 2000c). A similar view is expressed by Mohan (2000) who notes that, for the Central Government, spending on salaries and pension as a proportion to GDP during the 1990s was much lower than that in the 1980s.
4.53 The growth in Central Government spending on wages and salaries and pension was restrained during the period from 1990-91 to 1996-97. As a proportion to GDP, it dropped by around 0.8 percentage point. With the implementation of the Fifth Pay Commission award towards the late 1990s, the wage bill could not be kept constricted (Chart IV.10). Though the present expenditure on salaries and pensions for the Central Government employees as a percentage to GDP is still lower than it was at the end of the 1980s, the sharp rising trend is worrisome. It may be added that with downsizing of the Government as part of the reform process, the share of its wage bill in GDP should decline substantially. As liberalisation of the economy puts upward pressure on wage rates in competitive sectors that attract fresh domestic and foreign capital, preferred strategy would be to redeploy the surplus labour from the public sector to more productive sectors. This will reduce the wage bill burden in a much more meaningful way.
4.54 Downward rigidity has also been discernible in expenditure on subsidies, which is another major constituent of the revenue expenditure. Subsidies are an important policy instrument. Apart from impacting the expenditure side of the fisc, these affect domestic resource allocation, income distribution and expenditure efficiency. Subsidies can also affect international competitiveness by introducing distortions in international trade. Apart from providing implicit subsidies through under-pricing of public goods and services, Governments also extend subsidies explicitly on items such as exports, interest on loans, food and fertilisers. Owing to the conscious efforts made by the Government, total explicit subsidies of the Central Government, which constituted 2.14 per cent of GDP in 1990-91 were reduced to nearly 1 per cent by 1995-96. Cut in subsidies in the beginning of the reform period was brought about largely through the phasing out of export subsidies (cash compensatory support) which amounted to nearly Rs. 2,750 crore (0.5 per cent of GDP) in the year 1990-91. During the second half of the 1990s, the size of subsidies again started rising and increased to 1.36 per cent of GDP by 2001-02 (Table 4.8).
Table 4.8: Central Government Expenditure on Subsidies – Major Heads | |||||
(Figures in rupees crore) | |||||
Year | Food | Fertilisers | Interest | Exports | Total |
1 | 2 | 3 | 4 | 5 | |
1990-91 | 2,450 | 4,389 | 379 | 2,742 | 12,158 |
(0.43) | (0.77) | (0.07) | (0.48) | (2.14) | |
1995-96 | 5,377 | 6,735 | 34 | 318 | 12,666 |
(0.45) | (0.57) | (–) | (0.03) | (1.07) | |
2001-02 | 17,499 | 12,595 | 210 | N.A. | 31,207 |
(0.76) | (0.55) | (0.01) | (1.36) | ||
Figures in parentheses are ratios to GDP. | |||||
– negligible. | |||||
Source : Union Government Budgets. | |||||
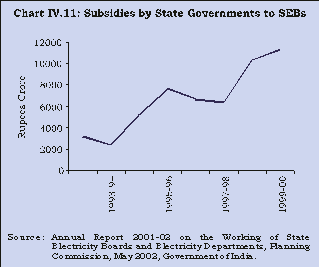
4.55 Details on State Government subsidies are not available in their budget documents but the indications are that the trend is similar to that of the Central Government, as reflected from the quantum of subsidies extended to some of the SEBs by the respective State Governments (Chart IV.11).

4.56 The downward inflexibility in the subsidies was essentially on account of the growing size of food subsidy, which recorded nearly a six-fold rise over the reform period. It has been observed that a sizeable proportion of food subsidy is due to the carrying cost of the food stock (Balakrishnan and Ramaswami, 2000). Thus, a significant part of subsidies goes to make up for the inefficiencies embedded in institutional arrangements meant for providing subsidy rather than benefiting the targeted group. Although subsidies are extended by the Government on the grounds that the poor are benefited, evidence shows that impact on poverty and nutritional status of the population is very limited (Srinivasan, 2000; Government of India, 1997). Expressing similar concerns, it has been stated that the argument that subsidies are meant for the poor has little basis in actual practice. The better-off sections of the society consume most of such services (Mohan, 2000). It has been shown that during 1986-87, the public distribution system (PDS) and other consumer subsidy programmes accounted for less than 2.7 per cent of per capita expenditure of the poor in rural areas and 3.2 per cent in urban areas (Radhakrishna and Subbarao, 1997). This indicates that phasing out of subsidies would have a very limited impact on the poor and less so in rural areas. However, there is a need for ensuring safety-net for the poor segment of population, whose ability to adjust to areas of work in the face of restructuring is rather limited. In order to ensure availability of food to the poor, the Government launched the Targeted Public Distribution System (TPDS) in June 1997. The Scheme was targeted to families Below Poverty Line (BPL)/ Antyodaya Anna Yojana (AAY) families in a transparent and accountable manner. The ability of the scheme to make a lasting dent on poverty would depend on the ability to create adequate entitlements through employment opportunities for the poor. Such policies would support income improvement without the burden of large fiscal subsidies.
4.57 In sum, it seems that the reversal in expenditure correction followed from the downward rigidity in consumption expenditure, particularly, in the interest payments for both the Central and the State Governments. The pay revision in the late 1990s further compounded the problem, while provision of subsidies continued to remain inefficient. In the event, capital expenditure had to bear the brunt of restraint placed on expenditure.
Restructuring of Public Sector
4.58 A major source of revenue imbalances, reflected in dissaving of the public sector is rooted in the poor profitability of the PSUs. The operations of PSUs have been on non-commercial lines. The returns on capital invested by the Government have been low. As a result, adequate resources in the form of profit and dividends are not forthcoming. With poor internal resource generation, PSUs had to depend on external financing from budgetary and non-budgetary sources.
4.59 Against this backdrop, public sector restructuring had two-fold objectives - to provide fiscal support to the Government in terms of additional resources and to improve the efficiency of these enterprises. Given the need to expand activities such as education, health and medicine, it was envisaged that substantial additional resources could be generated through a programmed disinvestment of some PSUs. With disinvestment, private shareholders are expected to enhance discipline by their monitoring. Managers, who act as agents of the shareholders, are forced to act in their interests by increasing the value of the firm. This would transform the PSUs on more efficient lines.
4.60 During the 1990s, there was a significant decline in the budgetary support available to the PSUs. Budgetary support to the total capital expenditure of Central Government PSUs declined sharply from 39.7 per cent during the Seventh Plan period to 12.7 per cent during the Eighth Plan period and further to 11.9 per cent by 1998-99 (Table 4.9). Furthermore, allocation of SLR bonds was completely phased out and the issue of tax-free and Government guaranteed bonds was also considerably reduced.
Table 4.9: Explicit Fiscal Impact of Operations of Public Sector Undertakings | ||||||
(Rs. crore) | ||||||
Item | Seventh Plan | Eighth Plan | 1998-99 | |||
1 | 2 | 3 | ||||
Net Internal Resources | 20,755 | 64,761 | 19,295 | |||
(32.3) | (42.3) | (53.9) | ||||
Extra Budgetary Resources | 18,054 | 68,766 | 12,281 | |||
(28.1) | (45.0) | (34.2) | ||||
Budgetary Support | 25,537 | 19,455 | 4.250 | |||
(39.7) | (12.7) | (11.9) | ||||
Note | : | Figures in parentheses are percentages to the total. | ||||
Source | : | Public Sector Enterprises Survey, various issues. | ||||
4.61 Although there is a considerable improvement as regards the direct impact of PSU operations on the budget, they continue to be a drag on the fisc. As stated earlier, the returns on the investment in these units do not cover even the cost of borrowed funds invested by the Government in these units. The profits after tax earned by PSUs on their capital are far lower than the implied average interest rate paid by the Central Government on its outstanding domestic liabilities (Table 4.10). Moreover, aggregate profitability measure is a bit misleading since it includes State oil and petroleum monopolies. Even for PSUs, which compete with the private enterprises, the returns have been generally lower than that of the competing firms in the private sector.
Table 4.10: Performance Indicators of Public Sector Undertakings | ||||
Year | Capital | Profit | Returns on | Average Interest |
Employed | after Tax | Capital | Paid by | |
(Rs. Crore) | (Rs. Crore) | (per cent) | Government | |
(per cent) | ||||
1 | 2 | 3 | 4 | |
1980s | 43,575 | 1,379 | 2.5 | 7.0 |
1990-91 to | 1,36,439 | 3,974 | 2.8 | 8.8 |
1995-96 | ||||
1996-97 to | 2,62,400 | 12,925 | 4.9 | 10.2 |
2001-02 | ||||
Source : Economic Survey, Government of India, various issues. | ||||
4.62 The programme of divestment in PSUs had slippages due to pricing problems and sluggishness of the capital market in the late 1990s. Targets set for divestments could not be achieved in most of the years (barring 1991-92, 1994-95 and 1998-99) during the decade of the 1990s (Chart IV.12). Since 1991-92, Government equity has been divested in 48 units and strategic sale was undertaken in another 16 units. Of the total amount of Rs.78,300 crore targeted to be mobilised through divestments/strategic sale, Rs.30,917 crore could be realised up to March 31, 2002. Initially the Government (with the exception of Modern Foods) sold only minority stakes in different PSUs. However, since 2000, the Government began strategic sales as these were judged to be revenue enhancing and signalled commitment to enhanced efficiency that transfer of management could bring about. To establish a systematic policy approach to disinvestments and privatisation and give fresh impetus to strategic sales of identified PSUs, the Government has established a new Department for Disinvestment.
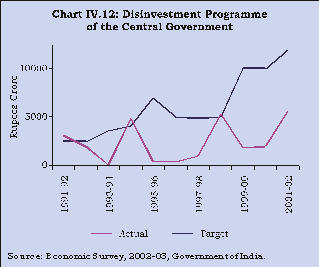
4.63 Efforts to phase out inefficient PSUs were also made at the State level. According to available information from the Ministry of Disinvestment, 19 States have identified 290 State-level public enterprises for disinvestments; restructuring or closure has been initiated in 221 of these enterprises. So far, 69 units have been closed down, while 33 units have been privatised. It may be mentioned that an approximately 919 State-level public enterprises have run an accumulated loss of Rs.23,377 crore by end-March 2001. Furthermore, 409 out of these 919 enterprises are loss making, while 180 are non-working. The implicit subsidies in State-level enterprises are known to have risen substantially since the mid-1980s. In this context, there is a need to take the disinvestment programme for State enterprises on an accelerated footing.
Monetary-Fiscal Coordination
4.64 As stated earlier, the growing fiscal deficit during the pre-reform period was increasingly financed through the pre-emption of institutional resources at sub-market rates by progressive increase in SLR and monetisation by the Reserve Bank. These developments eventually resulted in crowding out of private investment, growing financial repression and imposed constraints on the conduct of monetary policy. Thus, the efforts towards better monetary-fiscal coordination were aimed at elimination of automatic monetisation by the Reserve Bank and movement away from financial repression through the reduction in statutory pre-emption of banks and long-term resources to allow a level-playing field to private investors. With these underlying objectives, a series of structural and institutional reforms were initiated during the 1990s which, inter alia, included aligning coupon rates on Government securities with market interest rates, introduction of auction system, introduction of system of primary dealers and setting up of D vP system. These measures resulted in the emergence of an active, wide and deep Government securities market and paved the way for complete elimination of automatic monetisation and substantial lowering of statutory pre-emption of institutional resources by the Government.
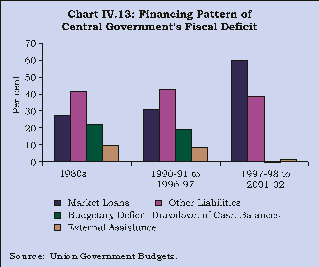
4.65 These developments were also reflected in the structural change in the financing pattern of fiscal deficit during the reform period - with a marked shift towards market borrowings. Accordingly, the share of market borrowings, which constituted 26.9 per cent of gross fiscal deficit (GFD) in the 1980s rose sharply to 59.1 per cent in the latter half of the 1990s and financed about 70 per cent of the GFD by 2001-02. On the other hand, ad hoc Treasury Bills which financed a sizeable proportion of GFD, both in the 1980s and in the 1990s upto 1996-97, no longer exist as a financing item with their replacement by WMA in 1997-98. Similarly, the share of external finance which was around 10 per cent in the 1980s also came down sharply to an average of 2.9 per cent during 1997-98 to 2001-02. The share of other liabilities has been relatively stable and averaged around 40.0 per cent, both, in the 1980s as well as in the 1990s (Chart IV.13).
4.66 In case of State Governments, the fiscal gap is financed by way of loans from the Centre, small savings and market borrowings. Like the Central Government, the share of market borrowings in financing GFD of States has steadily increased. The financing pattern of the GFD indicates that, on an average, the share of loans from the Centre and small savings declined from 51.9 per cent and 37.1 per cent, respectively, in the 1980s to 47.5 per cent and 36.6 per cent, respectively, during the 1990s. 7 The share of market borrowings rose from 11.0 per cent to 15.8 per cent between these two periods (Chart IV.14).
4.67 The growing reliance on market borrowing for financing the fiscal deficit has been accompanied by restraint on reserve money growth and moderation of inflationary pressure. This has also had the effect of raising interest payments. In order for the strategy to finance fiscal deficit through borrowings at market related rates to have a favourable macroeconomic impact, some discipline on growth of the fiscal deficit is necessary.
4.68 In addition to borrowings to finance the fiscal deficit, Governments, both at the Centre and State levels, also avail WMA from the Reserve Bank to bridge short-term mismatches in revenue and expenditure. While WMA is envisaged to be a short-term funding, in many States, it is continuously rolled over. In this context, the Report of the Advisory Committee on WMA to State Governments (Chairman: C. Ramachandran) has noted that WMA has assumed the form of a long-term financing facility in many States with the progressive deterioration in their fiscal balances over the years (RBI, 2003). The Committee has recommended that States need to use the facility of WMA only for meeting the temporary liquidity mismatches rather than as a near budgetary resource.
Public Debt
4.69 The objective of fiscal reforms to prevent further accumulation of public debt is intimately linked to the objective of reining in the fiscal deficit. Since the public debt of the Government is broadly the accumulation of liabilities created by the Government to finance its deficit over the years, debt parameters in general move in tandem with the trends in fiscal deficit. Thus, reflecting the downward rigidity in the fiscal deficit, the objective to curtail growth of public debt was also not achieved, particularly since the mid-1990s. The outstanding debt of the Government sector as a proportion to GDP after witnessing improvement from 61.7 per cent in 1990-91 to 56.5 per cent in 1996-97 rose once again, and by the year 2000-01, the debt-GDP ratio at 66.4 per cent exceeded the level at the beginning of the reform process.
4.70 Although the primary deficit declined in the 1990s as compared to that in the 1980s, the growth in debt-service burden as a result of growing reliance on high cost market borrowings largely contributed to the downward inflexibility in the debt-GDP ratio. The weighted average interest rate on Central Government securities almost doubled from 7.03 per cent in 1980-81 to a peak level of 13.75 per cent in 1995-96. Since then the interest rates have declined gradually to 11.77 per cent in 1999-2000 and further to 9.44 per cent in 2001-02. Moreover, the higher implicit cost of borrowings through small savings and provident funds, owing to tax concessions, also placed additional burden on Government resources.
4.71 In addition to the size of debt appearing on the budget/balance sheets of the Governments, there has been a steep rise in the off-budget liabilities arising on account of guarantees extended by the Governments. The guarantees given by the combined Government rose in nominal terms from Rs.1,00,603 crore as at end-March 1993 to Rs.2,61,975 crore as at end-March 2002, though as a ratio to GDP they declined from 13.4 per cent to 11.4 per cent during the same period. The Central Government outstanding guarantees increased from Rs.58,088 crore in 1993 to Rs.95,859 crore in 2002. As a percentage of GDP, these guarantees dropped from 7.8 per cent to 4.2 per cent over the same period. Thus, in terms of contingent liabilities, there are clear signs of fiscal prudence by the Centre in the reform period. In contrast, State Governments’ (17 major States) outstanding guarantees increased sharply from Rs.42,515 crore in 1993, comprising 5.7 per cent of GDP, to Rs.1,66,116 crore in 2002, comprising 7.2 per cent of GDP ( Table 4.11).
Table 4.11: Outstanding Government Guarantees | ||||||||
(Amount in Rs. crore) | ||||||||
Year | Centre | States | Total | |||||
Amount | % to GDP | Amount | % to GDP | Amount | % to GDP | |||
1 | 2 | 3 | 4 | 5 | 6 | |||
1993 | 58,088 | 7.8 | 42,515 | 5.7 | 1,00,603 | 13.4 | ||
1994 | 62,834 | 7.3 | 48,866 | 5.7 | 1,11,700 | 13.0 | ||
1995 | 62,468 | 6.2 | 48,479 | 4.8 | 1,10,947 | 11.0 | ||
1996 | 65,573 | 5.5 | 52,631 | 4.4 | 1,18,204 | 9.6 | ||
1997 | 69,748 | 5.1 | 63,409 | 4.6 | 1,33,157 | 9.7 | ||
1998 | 73,877 | 4.9 | 73,751 | 4.8 | 1,47,628 | 9.7 | ||
1999 | 74,606 | 4.3 | 97,454 | 5.6 | 1,72,060 | 9.9 | ||
2000 | 83,954 | 4.3 | 1,32,029 | 6.8 | 2,15,983 | 11.2 | ||
2001 | 86,862 | 4.1 | 1,68,712 | 8.0 | 2,55,574 | 12.1 | ||
2002 | 95,859 | 4.2 | 1,66,116 | 7.2 | 2,61,975 | 11.4 | ||
Sources : | 1. | Data on Centre’s guarantees are sourced from finance accounts and budget documents of the Central Government. | ||||||
2. | Data on States’ guarantees are based on information received from State Governments. Data pertain to 17 major States. | |||||||
4.72 A rise in contingent liabilities, particularly in case of State Governments, essentially reflects the practice followed by the State Governments to set up corporations to borrow from the market to undertake departmental jobs. In view of low user charges and inefficient operations of PSUs, these contingent liabilities are a potential threat to the stability and sustainability of the fiscal system.
4.73 To overcome such disquieting trends in State Governments’ finances, many States in their budgets have initiated fiscal measures such as setting up of consolidated sinking fund, guarantee redemption fund, statutory and administrative limits on guarantees and restructuring of PSUs. This follows the recommendation of the Technical Committee on State Government Guarantees (1999). Besides, some States have also taken decision to charge guarantee commission on outstanding guaranteed amount.
4.74 The conceived strategy of fiscal consolidation as reflected in various official pronouncements focused on compressing consumption expenditure and augmenting revenue. This is akin to ‘Type 1’ approach of fiscal consolidation experimented elsewhere as enumerated in Alessina and Perotti (1996). In terms of actual outcome, however, the adjustment was predominantly brought through cuts in capital expenditure. This is similar to Alessina and Perotti’s ‘Type 2’ approach, though the essential difference in the Indian case has been that household taxes have been reduced but the tax base has not widened significantly. The inability to effect a large cut in consumption component of expenditure resulted in an increasing proportion of borrowed funds being preempted by such expenditure. This could slow down future revenue growth. Inadequate returns on Government expenditure get reflected in rising debt-service obligations. This gives rise to the emergence of a vicious cycle of deficit and debt.
4.75 The detailed analysis of the fiscal performance during the reform period drew attention to the downward rigidity in current expenditure. In the face of sluggish revenue growth, this results in a persistent increase in revenue deficit. This has been a critical factor in the resurgence of fiscal deficit during the latter half of the 1990s. Although the tax reform measures initiated have imparted rationality to the tax structure, the revenue buoyancy expected through a Laffer-curve effect has not come through. This is because cuts in indirect tax rates were not accompanied by removal of concessions and exemptions. Therefore, there has been neither significant increase in the tax base nor has tax compliance improved. With the result, the improvement in direct tax collection on account of an expansion of tax base and perhaps better compliance was not adequate to compensate the drop in customs and excise duty collections. Eventually, the tax-GDP ratio suffered deterioration during the reform period. The non-tax revenue of the Centre as a proportion to GDP recorded some rise, whereas the same in the case of States registered a decline during the 1990s. Poor cost recovery for the services provided by the Governments has been responsible for this trend. Inadequate progress in public sector restructuring, specifically reflected in the inability to raise user charges and continued low returns on investments, have also resulted in stagnation in non-tax revenue at, both, the Central and State Governments level. Thus, on the whole, reforms did not result in adequate pick up in revenue growth in relation to growing expenditure requirement during the 1990s.
4.76 The faster growth in committed expenditure like interest payments, wages and salaries and subsidies has imparted downward inflexibility in revenue expenditure. More importantly, expenditure on interest payments continued to grow unabated, reflecting the impact of sizeable outstanding liabilities contracted at higher interest rates in the first half of the 1990s.
4.77 Progress towards better fiscal-monetary coordination during the reform period was an important achievement. The major policy initiative in this direction was the elimination of automatic monetisation of Central Government fiscal deficit. This, together with structural and institutional reforms undertaken by the Reserve Bank in the 1990s, has strengthened the public debt management process enabling wider market participation in the Government securities market and significant reduction in the pre-emption of institutional resources by the Government to finance fiscal gap. The Government borrowings at market related rates have intended to provide level-playing field for the private investor. It was also expected to induce fiscal discipline. The overall reform experience has been that, while the public debt management has been made market-based, fiscal deficits remain unrestrained. Market based regime with unrestrained fiscal deficit could worsen the fiscal situation. The above development unfolds certain important issues for the Indian fiscal system.
Emerging Issues
4.78 The analysis shows that the level of fiscal deficit relative to GDP in India at present is higher than not only that of most internationally comparable benchmark levels ( e.g. the Maastricht Treaty requires fiscal deficit to be 3.0 per cent of GDP) but also the levels recommended by the Eleventh Finance Commission (6.5 per cent of GDP for Government sector, 4.5 per cent for Central Government and 2.5 per cent for States). Furthermore, the present level has also exceeded the levels witnessed on the eve of the 1991 crisis. Notwithstanding these developments, most other macroeconomic parameters have been sustainable. As a result, the higher fiscal deficit has not spilled over to the external sector. In this setting, questions have been raised whether the high fiscal deficit should be a matter of much concern. A judgement on this issue over a longer horizon would have to factor in the possibility of adverse movements in the interest rates and inflation rates.
4.79 An important observation that could be made from a comparative analysis of the finances of the Centre and State Governments is that deterioration of finances during the latter part of the reform period was much sharper for the States than that for the Central Government. Although the growth of revenue for the States and the Central Government was comparable, expenditure growth was much steeper for the States than that for the Central Government. Consequently, the rise in fiscal deficit of States was sharper than that of the Central Government. Data show that during 1996-97 to 2001-02, States accounted for more than half of the rise in the fiscal deficit of the combined Government. In this context, it is important to consider whether worsening fiscal situation of States is on account of their own operations or owing to the factors such as central transfers and rising interest payments, which are not fully under their control.
4.80 Another issue which emerges in the context of downward rigidity exhibited by the fiscal deficit is the rise in debt-GDP ratio. It needs to be reviewed whether the fiscal stance and the debt accumulation process is sustainable or not. This is particularly so as the debt-servicing of market loans now accounts for more than 70 per cent of the gross market borrowings.
4.81 As stated earlier, the underlying objective of improving monetary-fiscal co-ordination by eliminating automatic monetisation and reducing pre-emption of institutional resources was to contain crowding-out arising from pre-emption of funds by the Government and, thus, allow level-playing field to the private investor. Although the Government at present borrows from the market on equal terms with private borrowers, the crowding-out effect of Government borrowings still remains a critical issue in view of the high fiscal deficit.
4.82 In the context of role of fiscal policy in reinvigorating growth, it needs to be recognised that the fiscal stance affects output itself as well as the variability of output. Imbalances between aggregate demand and aggregate supply feed back into the realised fiscal deficit. Given this simultaneity, an important question is to examine the design of fiscal policy to see whether fiscal policy automatically smoothens the business cycle or discretionary interventions are required. This aspect is usually examined by looking at built-in automatic stabilisers and by decomposing the actual fiscal deficit into a structural component (unresponsive to cycles in the economy) and a cyclical component (responsive to cycles). Previous research has shown that fiscal deficits in India have been predominantly structural with cyclical component almost negligible (RBI, 2002). This suggests that discretionary policy had an important role to play in counter-cyclical measures in the Indian context.
4.83 Of the above issues, three viz., (i) macroeconomic impact of fiscal deficit, (ii) worsening of State finances and (iii) debt-sustainability are addressed in remaining part of the section.
Macroeconomic Impact of Fiscal Deficit
4.84 The high fiscal deficit and sharp increase in the size of outstanding liabilities of the Government during the 1990s did not have any adverse macroeconomic impact as witnessed in the beginning of the 1990s. This has led to the revival of the view that higher fiscal deficits should not be a matter of much concern. It is argued that fiscal deficits would be inflationary only if the system is at full employment or is characterised by supply bottlenecks in certain sectors. Given the fact that there is excess industrial capacity along with large food stocks, large foreign exchange reserves and low inflation, a monetised deficit is not only non-inflationary, but virtuous from the point of view of growth (Chandrasekhar, 2000).
4.85 At the first look, the argument appears plausible as it could be observed that the spill-over effect of the high fiscal deficit in the external sector did not occur. However, this period was marked by dampened investment demand from the private sector with recessionary conditions. The overall saving-investment gap was narrowed as a result and this was reflected in low current account deficit. Furthermore, the recessionary conditions coupled with the availability of sizeable forex reserves, large food stocks and downward trend in global prices helped in containing inflationary pressures in the Indian economy. Continuing foreign exchange inflows and the recessionary conditions enabled the Reserve Bank to move to a softer interest rate regime in spite of a rising fiscal deficit.
4.86 It has, however, been shown that while public investment spending crowds in private investment and is expansionary in nature, consumption spending by the Government causes economic contraction (RBI, 2002). In fact, considerable scepticism has been expressed towards the success of expansionary fiscal policy, which does not consider the quality of expenditure (Chelliah, 2001). The Report of the Economic Advisory Council, Government of India, 2001 stresses that a high fiscal deficit, by raising real interest rates, crowds out private investment as Government borrowing is predominantly used to finance the revenue deficits. Relying on the reduced form evidence pertaining to the 1990s, fiscal expansion in the Indian context is observed to be contractionary (Khatri and Kochhar, 2002). It may be added that fiscal consolidation in the first half of the 1990s was accompanied by high income growth. Also, a deterioration in fiscal position in the second half of the 1990s occurred along with deceleration in income growth. It has also been shown that in India, during the eleven year period since 1986-87, an increase in the Central Government’s fiscal deficit (inclusive of oil pool account) by one per cent of GDP was associated with a reduction in private corporate investment by one per cent of GDP (Srinivasan, 2000).
4.87 It needs to be recognised that the fortuitous conditions that have restricted the adverse macroeconomic impact of high fiscal deficit are transitory in nature. With a revival of economic activity, spurred by a pick-up in the private investment demand, rise in fiscal deficit could raise the saving-investment gap and eventually raise interest rate and widen current account deficit. The problem could be compounded if inflationary pressures reemerge due to buoyant economic activity or some exogenous shock. In view of this, sustainability of deficit and debt and fiscal consolidation continues to be a matter of serious concern.
Worsening State Finances
4.88 The down slide in the fiscal performance of the States has assumed serious proportions. Several factors have been identified by a number of studies for the widening fiscal gap of the State Governments. Evidence set out in Box IV.3 indicates that expenditure on wages, salaries and pension, growing size of interest payments, inability to levy adequate user charges and falling buoyancy in Central transfers are the prominent reasons for the deterioration of State finances.
Box IV.3 Studies analysing the fiscal situation of the State Governments have identified a number of factors responsible for the disparity in the growth of receipts and expenditure, and the consequent widening of fiscal gap. The inability to contain consumption expenditure due to explicit and implicit subsidies, which are mostly cornered by the influential segments of the society, and the reluctance to raise additional resources on the part of the States have been the main causes for the deterioration of fiscal situation in States (Kurian, 1999). Another important factor is the competitive reduction in taxes leading to mere redistribution of existing capital among the States at the cost of significant revenue foregone, while not being able to levy taxes on services and agricultural income (Rao, 2002). It has, however, been argued that inadequate revenue mobilisation efforts is not across all the States, and is limited only to high-income category States. The increase in non-developmental expenditure on the other hand is principally due to rising interest payments, which are not strictly under the control of State Governments. Instead, the sluggishness in Central transfers is the major factor, which has contributed to the increase in the resource gap in the revenue account, and consequently, led to increasing reliance on higher cost borrowings thereby mounting the interest burden of States and further widening the revenue gap (Chakraborty, 1999). Among the various revenue receipt items, central transfers have grown at the slowest rate, reflecting the precariousness of Centre’s own finances (Rao, 2002). Another view points out that there is no link between capacity to borrow and the return on services provided by the Government. Since there is not enough incentive for the Government to undertake appropriate levy of user charges, States are encouraged to become fiscally irresponsible and to subject user charges to populist considerations (Mohan, 2000; Acharya, 2002). Pay revisions following recommendations of the Fifth Pay Commission for the Central Government have also been identified as the trigger point for the sharp deterioration in States finances. The impact of pay revision has been much more severe on the States than on the Centre as the share of salary expenditure in total expenditure is much higher in the case of States (Rao, 2002; Acharya, 2002). The impact of pay revision have been so significant that in Madhya Pradesh, Maharastra and Uttar Pradesh, the total additional expenditure on account of salary revision would exceed the capital outlays of States. Thus, they cannot provide more resources for physical and social infrastructure (Bajaj, 1999). On the other hand, it is suggested that State finances remained relatively stable prior to the 1990s, as the Centre was in a position to exercise effective control through system of fiscal transfers, investment licensing and lending policies of the financial institutions. The control was effective as long as interest rates were repressed permitting borrowings at low cost, the supply of subsidised services like power to agriculture were limited and flow of private investment was controlled through the ‘license Raj’. In the post-reform period, with liberalisation, the internal logic of the control system began to collapse and the State finances deteriorated continuously (McCarten, 2002). In the context of this argument, it needs to be noted, however, that State finances had started deteriorating prior to the launching of economic reforms. Deterioration of State finances is also analysed by identifying the demand side and supply side factors. On the demand side are the factors relating to fiscal populism, while on the supply side is the softening of budget constraint implicit in constitutional restrictions on borrowings. The hard budget constraint faced by the States in the past restricted the growth of deficits of State Governments. Given the increasing demand for expenditure, the States have softened the hard budget constraint through several ways thereby contributing to deterioration in their finances. At least three factors are identified, which are: growth of small savings which used to be on-lent by the Centre /National Small Savings Fund (NSSF) to the State of origin up to a specified proportion (100 per cent since 2002-03) of the net accretion, borrowing through State level public sector enterprises, accumulation of large arrears by State Electricity Boards to central agencies and rolling over of short-term accommodation provided by RBI in the form of WMA. |
4.89 Analysis of the data since 1980-81 suggests that an inverse relationship prevails between cost recovery and the fiscal deficit (Chart IV.15). On the other hand, co-movements between expenditure (on both interest payments and on wages and salaries) and the fiscal deficit indicated positive relationship. A rise in interest payments or wages and salaries generally exert upward pressure on fiscal deficit. The positive relationship between interest payments and GFD was, however, not observed during the first half of the 1990s. Similarly, transfer ratio, which is defined as the proportion of total expenditure which is not met by Central transfers also exhibits a positive relationship showing that with a fall in Central transfers, the fiscal deficit of the States, in general, worsens.
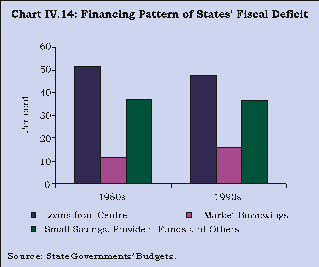
4.90 Although the studies surveyed identify nearly the same set of factors, they differ in terms of the relative importance attached to each of the factor. There are large disparities across the States in terms of level of income and the tax and expenditure policies pursued by the respective Governments. Accordingly, the impact of various factors (as enumerated above) are likely to vary across the States. Any sluggishness in central transfers would impact more on the States whose fiscal conditions are weak. Similarly, the level of revenue receipts in each State would depend upon the level of income, quality of tax administration and the policies pursued by the Government regarding user charges. Therefore, recognising that there is a need to track the changes, both, over the period and across the States, a panel data exercise for the 15 major States over the period from 1980 to 2000 has been undertaken to assess the relative strength of factors affecting the State finances. The methodology and other technical details have been set out in Box IV.4.
Box IV.4 Following the discussion above, four factors responsible for the deterioration of fiscal condition of the State Governments have been identified. These are rising interest payments (IP), inadequate recovery of costs or lower user charges (COSTR), rising expenditure on wages and salaries (WS) and sluggishness in the Central transfers to States (TFR).8, 9, 10 All these factors, except COSTR are expected to have a positive sign. The estimated panel regressions take the following form: GFD/NSDP = f (IP/NSDP, WS/NSDP, TFR, COSTR) Equations have been estimated in double log form. In order to assess the impact of reforms and decipher the relative importance of the factors responsible for the deterioration, the estimates have been made for the 15 major States, separately for the period, 1980-81 to 1989-90, and for the period, 1990-91 to 1999-200011. Results of estimated fixed effect models are presented below. Period 1980-81 to 1989-90 GFD/NSDP = 0.06 IP + 3.08 TFR – 1.18 COSTR + 0.88 WS Period 1990-91 to 1999-2000 GFD/NSDP = 0.35 IP + 2.50 TFR – 0.35 COSTR + 0.25 WS ** significant at 1 per cent level, * significant at 5 per cent level, # significant at 10 per cent level. |
4.91 The exercise does reveal that spending on interest payments, which had no significant impact during the 1980s turned into a prominent determinant of the fiscal deficit of States during the 1990s. On the other hand, all other factors viz., the transfer ratio, user charges and spending on wages, salaries and pension, while continuing to be significant factors determining the fiscal deficit of States in both the periods, were relatively less important (in terms of value of coefficients) during the 1990s. Notably, this finding is contrary to the general belief that rise in expenditure on wages and salaries has been the major cause for deterioration in the fiscal condition of the State Governments during the 1990s.12
Debt Sustainability
4.92 The underlying theoretical notion of fiscal stability and sustainability is that real interest rate must not exceed the real output growth of the economy to ensure that debt/output ratio does not grow to explosive proportions. If the interest rate exceeds the output growth rate, and the larger is the gap between the two rates, the higher would be the growth in debt-GDP ratio. This would require generation of adequate primary surplus equivalent to the gap between the interest rate and the output growth rate to stabilise the debt-GDP ratio. Conversely, by this condition, even if the rate of output growth exceeds the interest rate, a large primary deficit can still lead to rise in the debt-GDP ratio. Thus, the positive differential between the output growth rate and the interest rate is not the sufficient condition for sustainability. Sufficient condition for sustainability requires that the initial debt stock equals the present discounted value of primary surpluses in the future (Blanchard, 1980). The latter condition which is popularly termed as the inter-temporal budget constraint or the ‘present value constraint approach’ ensures that the debt-GDP ratio does not grow inexorably. This approach essentially brings to the fore that it is the behaviour of the lenders to the Government that ultimately determines the sustainability of fiscal policy. The underlying notion is that, in the wake of explosive rise in debt-GDP ratio, lenders may lose confidence in the ability of the Government to honour its commitments and may become unwilling to subscribe to Government debt any more.
4.93 In the Indian context, a number of studies have empirically tested sustainability of public debt. Amongst the earlier studies, Seshan (1987) found that the internal debt of the Government that had evolved by the mid-1980s was unsustainable. Analysing the alternative modes of financing Government deficit, it was shown that while the debt financing was unsustainable, resorting to monetary financing would lead to a vicious circle of large deficit, higher monetary financing and more inflation leading again to a higher deficit (Rangarajan, Basu and Jadhav, 1989). Many other studies in the 1990s, and thereafter, also show the unsustainability of Indian public debt (Buiter and Patel, 1992; Jha, 2001).
4.94 The sustainability of the public debt in terms of both the approaches viz., accounting approach or Domar’s stability condition and the ‘present value constraint approach’ is assessed in this section. In the accounting approach, a comparison of weighted average interest rate on the Government borrowings and the GDP growth rate indicates that the differential between the two rates has narrowed down considerably. During 1990s, at least on three occasions, the weighted average interest rate on Central Government securities exceeded the output growth rate (Chart IV.16). Although these results point towards pressure on the sustainability of the public debt during the second half of the 1990s, the concomitant fall in primary deficit as a proportion to GDP has enhanced the zone of comfort.
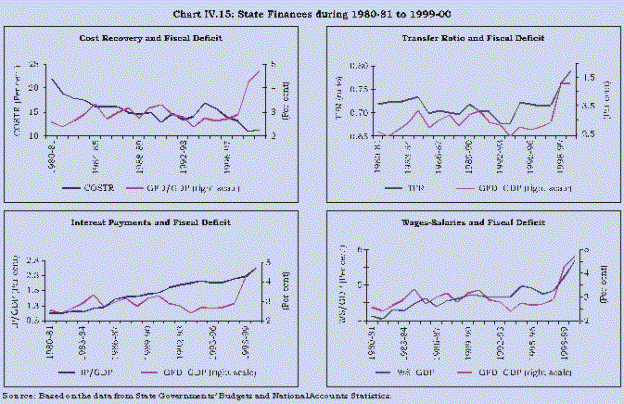
4.95 In the second approach, the hypothesis in the tradition of Buiter and Patel (1992) was tested. The method involves discounting the nominal stock of Government debt with an appropriate interest rate and assessing the stationarity of the resultant discounted series. Since the interest rate on pubic account liabilities are not market determined, total internal liabilities excluding public account liabilities were discounted with the weighted average interest rate on Government dated securities (Chart IV.17). The discounted series was tested for stationarity by alternative tests, viz., Augmented Dicky-Fuller and Phillips-Perron Unit root tests. Both the unit root tests show non-stationarity of the discounted series (Table 4.12).
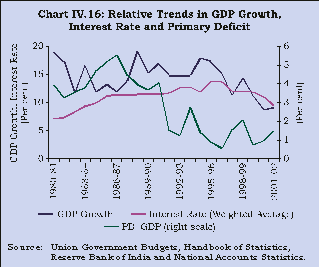
Table 4.12: Test of Stationarity for Central and State Government Debt | ||||||
ADF | Phillips-Perron | |||||
No Trend | Trend | No Trend | Trend | |||
1 | 2 | 3 | 4 | |||
Central Government | 0.50 | -2.66 | 1.55 | -2.64 | ||
State Government | 1.23 | -2.06 | 1.90 | -1.97 | ||
Note : | All the values are insignificant at 5 per cent significance level. | |||||
4.96 Since the above results could be biased, as they do not account for any possible structural break following reforms, unit root tests with structural break were also conducted. Three alternative models were tested: (i) change in intercept (model 1); (ii) change in intercept and in the slope (model 2); and (iii) change in slope but both segments of the trend function are joined at the point of break (model 3) (Perron, 1997). In none of the models, the discounted debt series was stationary. These results indicate that the continuation of current fiscal stance could make public debt of both the Central and State Governments unsustainable unless corrective measures are undertaken to rein in the fiscal deterioration (Table 4.13).
Table 4.13: Test of Stationarity for Central and State Government Debt with Structural Break | ||||
Model 1 | Model 2 | Model 3 | ||
1 | 2 | 3 | ||
Central Government | -4.15 | -2.99 | -2.59 | |
State Government | -2.54 | -3.04 | -3.34 | |
Note : | All the values are insignificant at 5 per cent significance level. | |||
4.97 The analysis and assessment in the preceding sections clearly revealed that the significant fiscal consolidation in the immediate aftermath of the fiscal reforms was essentially brought about through cut in investment expenditure, as rise in committed revenue expenditure could not be curtailed. Within a short span, it became increasingly obvious that the Indian approach to fiscal correction was not sustainable. While reduction in investment spending affected future growth prospects with consequent slowdown in revenue receipts, the interest payments and public debt continued to grow, resulting in reversal of fiscal consolidation process in the latter half of the 1990s. Downward rigidity in the revenue deficit, which amounts to dissaving by the Government sector, has significant implications for the growth target of 8 per cent set in the Tenth Five Year Plan. This would require an investment rate of about 32 per cent, whereas, over the years, the investment rate has stagnated at around 24 to 25 per cent of GDP. Acceleration of saving and investment rate would critically depend upon the efforts to restore balance on the revenue account of both the layers of Governments.
4.98 The key factors underlying the growing resource gap across the States are uneconomical level of user charges particularly in the power sector, sluggishness in the Central transfers due to low buoyancy of Central taxes and the rising interest payments. Restoration of revenue balance both at the Central and the State level would require that user charges are adequately raised, the tax collection machinery is overhauled to achieve better tax compliance, returns on Government investment in PSUs are raised through appropriate pricing policies eliminating implicit subsidies and the burden on the fisc is lowered through phasing out of unviable public sector units. The introduction of VAT should eliminate the practice of competitive tax concessions, which has seriously dampened tax buoyancies.
4.99 The sizeable outstanding liabilities contracted at higher rates during the late 1980s and the early 1990s and the resultant mounting interest payments have contributed to the widening fiscal gap. The scheme of swapping States’ outstanding liabilities to the Central Government on account of small savings could make a major dent in the growth of interest payments. For the Central Government, aggressive restructuring and divestment in unviable public sector units could bring in sizeable resources to redeem a part of outstanding liabilities and consequent reduction in interest payments.
4.100 The elimination of automatic monetisation and reduction in pre-emption of institutional resources by the Government has provided a conducive environment to generate market liquidity and softening of interest rates in the economy. However, with a widening of the fiscal gap, it would be increasingly difficult to maintain a softer interest rate regime. In such an eventuality, it would not only crowd out the private investment initiative, but would also make public debt highly unstable given the level of returns on Government investments.
4.101 The institutional support in the form of fiscal rules should be the prime mover of future agenda of fiscal consolidation programme. Such fiscal rules could prescribe quantitative limits for elimination of the revenue deficit, reduction in the fiscal deficit and the public debt over a specific period in a phased manner. Advocates of expansionary fiscal policy have, however, cautioned against the stringent fiscal rules to avoid impairment of future growth prospects (Rakshit, 2001; Patnaik, 2001, Shetty, 2001). In a recessionary environment along with low inflation, growing forex reserves and comfortable level of food stocks, there is a definite role for the expansionary fiscal policy. The apprehension is that the stringent fiscal rules may hinder appropriate steps by the Government. However, it may be noted that such rules generally make a clear distinction between public consumption and public investment expenditure while envisaging a complete elimination of revenue deficit. Rule based fiscal policy would facilitate the path for durable fiscal consolidation through mandatory fiscal discipline, enhanced accountability and improved transparency in fiscal operations.
4.102 In the above context, it may be mentioned that the RBI Annual Reports 2000-01 and 2001-02 have set out a policy prescription for further fiscal consolidation. According to these Reports, the path of durable fiscal consolidation is through fiscal empowerment i.e., by expanding the scope and size of revenue flows into the Budget. Furthermore, a fiscal strategy based on revenue maximisation would also provide the necessary flexibility to shift the pattern of expenditures and redirect them productively. Revenue maximisation requires that the tax system be reformed through widening the tax base, simplification of tax rules, review of exemptions/incentives and strict tax compliance.
1. | Government securities had a captive market of banks & financial institutions. |
2. | The States are: Andhra Pradesh, Arunachal Pradesh, Assam, Bihar, Chhattisgarh, Delhi, Goa, Gujarat, Haryana, Himachal Pradesh, Karnataka, Kerala, Madhya Pradesh, Maharashtra, Orissa, Punjab, Rajasthan, Tamil Nadu, Uttaranchal, Uttar Pradesh and West Bengal. |
3. | All important tax reform measures were initiated since 1992-93, therefore, separate estimates have been made for period from 1980-81 to 1992-93 and from 1980-81 to 2000-01. |
4. | Tax buoyancy is defined as percentage change in tax collection as a ratio to percentage change in tax base, i.e., (? X / X) / (? Y/ Y) where X is the tax collection and Y is the tax base. |
5. | Estimate with a dummy which is 1 for the period 1997-98 to 2000-01 to account for pay hike shows that the coefficient of the dummy is positive but not significant at 90 per cent confidence level. |
Personal Tax = -6.79 + 1.06 GDP + 0.44 DUMMY | |
(7.92) (1.65) | |
R2 = 0.9 DW = 1.4 | |
6. | User charges have been estimated as percentages of non-tax revenue to non-plan revenue expenditure. Data have been sourced from State Government Budget Documents. |
7. | Figures from 1990-2000 have been adjusted for new accounting procedure owing to creation of National Small Savings Fund (NSSF) so as to make the data for the 1980s and the 1990s comparable. |
8. | User charges or cost recovery are not available directly, therefore, they are captured through a proxy variable (COSTR) computed as non-tax revenue as a ratio to revenue expenditure. |
9. | Expenditure on wages and salaries is also not available directly, therefore, it is captured through a proxy variable (WS) computed from administrative expenditure plus non-plan revenue spending on education plus spending on pensions. |
10. | Central transfers were captured through a variable transfer ratio (TFR) defined as total expenditure minus Centre’s transfers to States as a ratio to total expenditure. |
11. | For the pre-reform period, data for 14 States has been used as Goa gained statehood only in late 1980s. |
12. | Results need to be seen in the context that wages, salaries and pension as a proportion to GDP were generally stable during most part of the 1990s. Sharp increase occured only in the late 1990s subsequent to fifth pay commission award. |

এই পৃষ্ঠাটো শ্বেয়াৰ কৰক:


ভাৰতীয় ৰিজাৰ্ভ বেংক মোবাইল এপ্পলিকেষ্যন ইনষ্টল কৰক আৰু নৱীনতম বাতৰিৰ প্ৰৱেশাধিকাৰ পাওক!
আমাৰ এপটো ইনষ্টল কৰিবলৈ QR ক’ড স্কেন কৰক


পৃষ্ঠাটো শেহতীয়া আপডেট কৰা তাৰিখ:


