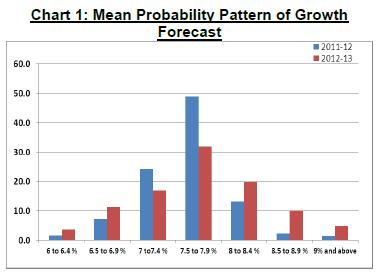
The Reserve Bank has been conducting the survey on a quarterly basis from the quarter ended September 2007. The results of the survey represent views of the respondent forecasters and in no way reflect the views or forecasts of the Reserve Bank of India. The latest survey round relates to the second quarter of 2011-12, i.e., July-September 2011. 26 professional forecasters have participated in this round. Some of the salient features are as follows: 1. Annual Forecasts: - For 2011-12, forecasters have revised real GDP growth rate forecasts downwards to 7.6 per cent1 from 7.9 per cent in last survey. Forecasts for agriculture and industry have been revised downwards to 3.2 per cent and 6.4 per cent respectively whereas services growth has been revised marginally upwards to 9.1 per cent (Table 1). The forecasters were asked to assign probabilities to the possibility that year-on-year real GDP growth rate will fall into various ranges. For 2011-12, they have assigned maximum probability of 48.9 per cent to 7.5-7.9 per cent growth range for GDP (Chart 1).
| Table 1: Median Forecast of Real GDP: Annual* | | | Median Forecasts (%) | | 2011-12 | 2012-13 | | Real GDP Growth | 7.6
(-0.3) | 7.7
(-0.6) | | Agriculture & Allied Activities | 3.2
(-0.2) | 3.0
(-0.6) | | Industry | 6.4
(-1.0) | 6.9
(-1.2) | | Services | 9.1
(+0.1) | 9.0
(-0.4) | | *: For tables 1 to 5 & 9 figures in bracket are increase/decrease of forecasts from last round of survey. |
 -
For 2011-12, the domestic saving rate is forecast to be 34.0 per cent, and the rate of gross domestic capital formation at 34.5 per cent, both revised downwards from the previous survey. The rate of gross fixed capital formation is projected to be 30.1 per cent, revised downwards from last survey. The forecasters have predicted private final consumption expenditure at current prices to grow at the rate of 16.0 per cent, remained unchanged from last round (Table 2). -
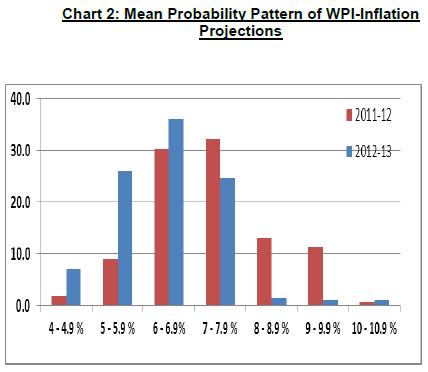
The forecasters were asked to assign probabilities to the various ranges that WPI based inflation would fall into by the end of current financial year. Forecasters have assigned the highest probability (32.1 per cent) that it will fall in 7.0-7.9 per cent in end-March of 2011-12, with a downward bias (Chart 2). | Table 2: Median Forecast of Savings and Capital Formation | | | 2011-12 | 2012-13 | | PFCE Growth Rate | 16.0
(0.0) | 14.9
(-1.1) | | GDS Rate | 34.0
(-0.2) | 34.6
(-0.4) | | of which Private Corp. Sector | 8.5
(0.0) | 9.0
(0.0) | | GDCF Rate | 34.5
(-1.0) | 35.0
(-1.4) | | GFCF Rate | 30.1
(-0.3) | 32.0
(0.0) |
- The profit growth of corporate sector (of BSE listed companies) in 2011-12 has been projected to be 9.8 per cent, revised downwards from 12.1 per cent in the previous round of survey. Broad money (M3) growth projection is revised marginally downwards to 16.5 per cent in 2011-12 from the earlier forecast of 17.0 per cent. In 2011-12, bank credit is expected to grow at the rate of 18.0 per cent, revised downwards from the last round of survey (Table 3).
| Table 3: Median Projections for Markets | | Growth Rates | 2011-12 | 2012-13 | End Period | 2011-12 | 2012-13 | | M3 | 16.5
(-0.5) | 17.0
(0.0) | INR/USD | 47.0
(+2.5) | 45.0
(+1.5) | | Bank Credit | 18.0
(-1.0) | 18.0
(-1.5) | T-Bill 91 days Yield in % | 8.3
(+0.3) | 7.7
(+0.1) | | CPAT | 9.8
(-2.3) | 10.0
(-7.5) | 10 year Govt. Sec. Yield in % | 8.3
(0.0) | 8.0
(0.0) | -
Central Government’s fiscal deficit is forecast at 5.3 per cent of GDP in 2011-12, which has remained unchanged from the last survey. The combined gross fiscal deficit of central and states is placed at 8.1 per cent of GDP in 2011-12, revised marginally upwards from 8.0 per cent in the last survey (Table 4). -
The forecasters expect repo rate to be at 8.50 per cent in end-March 2011-12, which is revised upwards from 8.00 per cent projected in the last survey (Table 5). | Table 4: Median Forecast for Fiscal Deficit | | | 2011-12 | 2012-13 | | Combined Gross Fiscal Deficit | 8.1
(+0.1) | 7.4
(+0.3) | | Central Govt. Fiscal Deficit | 5.3
(0.0) | 4.9
(+0.3) |
| Table 5: Median Forecast for Policy Rates | | | 2011-12 | 2012-13 | | Repo | 8.50
(+0.50) | 7.50
(-0.25) | | CRR | 6.00
(0.0) | 6.00
(0.0) | - Exports are expected to grow at 19.5 per cent in 2011-12, which is revised downwards from 20.5 per cent in the last survey. Imports are expected to grow by 24.4 per cent in 2011-12, revised upwards from 23.0 per cent in the last survey. Net surplus under invisibles is placed at US$ 93.8 billion in 2011-12, which is revised downwards from the last survey (Table 6).
| Table 6: Median Forecasts for External Sector | | | 2011-12 | 2012-13 | | Overall BoP (in US $ bn.) | 13.8 | 19.5 | | Export (in US $ bn.) | 299.1 | 358.5 | | Export (growth rate in %) | 19.5 | 20.0 | | Import (in US $ bn.) | 443.7 | 505.5 | | Import (growth rate in %) | 24.4 | 18.0 | | Trade Balance (% of GDP) | -7.6 | -7.2 | | Invisible Balance (US $ bn) | 93.8 | 104.2 | | Current Account Balance (US $ bn) | -56.9 | -60.6 | | Capital Account Balance (US $ bn) | 65.0 | 80.0 | 2. Quarterly Forecasts: - The real GDP growth in the second quarter of 2011-12 is projected at 7.5 per cent, which is revised downwards from 7.7 per cent in the last survey. Median forecasts for the second quarter of 2011-12 for real GDP originating from agriculture, industry and services sectors are projected to be 3.8 per cent, 6.0 per cent and 9.0 per cent, respectively. The forecast has been revised downwards from 4.8 per cent for agriculture sector and for industry from 6.2 per cent of the last survey. For services sector, the forecast is revised upwards from 8.7 per cent in the last survey. Index of Industrial Production growth forecast in the second quarter of 2011-12 is now placed at 6.0 per cent, revised downwards from 6.3 per cent in the last survey (Table 7).
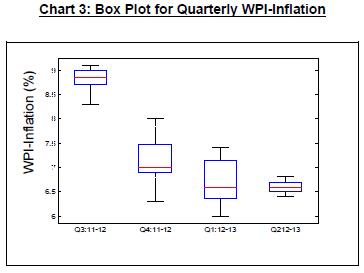
| Table 7: Median Forecasts for Quarterly GDP and IIP | | Growth Rate in % | Q2: 11-12 | Q3: 11-12 | Q4: 11-12 | Q1: 12-13 | Q2: 12-13 | | Overall GDP | 7.5 | 7.7 | 7.8 | 7.6 | 7.6 | | Agri. & Allied Act. | 3.8 | 2.7 | 3.1 | 3.0 | 3.2 | | Industry | 6.0 | 7.1 | 7.6 | 7.2 | 6.8 | | Services | 9.0 | 9.2 | 9.1 | 8.9 | 9.1 | | IIP | 6.0 | 5.8 | 5.4 | 6.0 | 6.5 | - Forecasters’ median estimate for average WPI inflation in the third quarter of 2011-12 is at 8.8 per cent, which has been remained unchanged from the last survey. For the fourth quarter of 2011-12, WPI-inflation forecast is 7.0 per cent (Table 8). The box plot of the WPI-inflation forecast is also presented in Chart 3.
| Table 8: Median Forecast for WPI and CPI-IW Inflation: Quarterly | | | WPI | WPI-MP | CPI-IW | | Q3:11-12 | 8.8 | 7.0 | 8.5 | | Q4:11-12 | 7.0 | 5.8 | 7.3 | | Q1:12-13 | 6.6 | 5.4 | 7.0 | | Q2:12-13 | 6.6 | 5.8 | 6.5 |
3. Long Term Forecasts: - Long term forecast for real GDP for the next five years (2012-2016) is 8.0 per cent, which is revised downwards from the last survey. For the next ten years (2012-2021), the GDP is expected to grow at 8.0 per cent, which is revised downwards from the last survey (Table 9). Over the next five years, WPI inflation is expected to be 6.0 per cent, revised downwards from last survey. CPI-IW inflation forecast over next five years remained unchanged at 7.0 per cent. Over the next ten years, WPI inflation is expected to be 6.0 per cent, revised upwards from 5.7 per cent in last survey. CPI-IW inflation is revised downwards to 6.2 per cent from 6.5 per cent over the next ten years.
| Table 9: Long Term Median Forecasts for Growth and Inflation | | Growth rate in % | Next Five Years | Next Ten Years | | Real GDP | 8.0 (-0.5) | 8.0 (-0.8) | | WPI | 6.0 (-0.3) | 6.0 (+0.3) | | CPI-IW | 7.0 (0.0) | 6.2 (-0.3) |
Annex | Table A.1 : Annual Forecasts for 2011-12 | | | Key Macroeconomic Indicators | Annual Forecasts for 2011-12 | | Mean | Median | Max | Min | | 1 | Real GDP growth rate at factor cost (in per cent) | 7.6 | 7.6 | 8.0 | 7.1 | | a | Agriculture & Allied Activities | 3.3 | 3.2 | 5.3 | 1.7 | | b | Industry | 6.5 | 6.4 | 8.0 | 5.1 | | c | Services | 9.1 | 9.1 | 9.6 | 8.2 | | 2 | Private Final Consumption Expenditure at current market price (growth rate in per cent) | 15.9 | 16.0 | 17.5 | 14.5 | | 3 | Gross Domestic Saving (per cent of GDP at current market price) | 33.9 | 34.0 | 35.0 | 32.0 | | | of which Private Corporate Sector | 8.2 | 8.5 | 9.0 | 7.1 | | 4 | Gross Domestic Capital Formation (per cent of GDP at current market price) | 33.8 | 34.5 | 36.0 | 28.2 | | 5 | Gross Fixed Capital Formation (per cent of GDP at current market price) | 30.5 | 30.1 | 34.1 | 27.0 | | 6 | Money Supply (M3) (growth rate in per cent) | 16.4 | 16.5 | 18.0 | 15.0 | | 7 | Bank Credit (growth rate in per cent) | 17.9 | 18.0 | 20.2 | 16.0 | | 8 | Combined Gross Fiscal Deficit (per cent of GDP) | 8.1 | 8.1 | 10.0 | 6.8 | | 9 | Central Govt. Fiscal Deficit (per cent of GDP) | 5.4 | 5.3 | 6.0 | 5.1 | | 10 | Corporate profit after tax (growth rate in per cent) | 10.0 | 9.8 | 16.0 | 4.0 | | 11 | Repo (end period) | 8.50 | 8.50 | 8.50 | 8.25 | | 12 | Reverse Repo (end period) | 7.50 | 7.50 | 7.50 | 7.25 | | 13 | CRR (end period) | 6.00 | 6.00 | 6.25 | 5.00 | | 14 | INR/ 1USD (RBI reference rate-end period) | 47.1 | 47.0 | 50.5 | 45.0 | | 15 | T-Bill 91 days Yield (Weighted average cut-off yield) | 8.2 | 8.3 | 8.7 | 7.7 | | 16 | 10 year Govt. Securities Yield (per cent-average) | 8.3 | 8.3 | 9.0 | 8.0 | | 17 | Overall Balance (in US $ bn.) | 14.6 | 13.8 | 28.0 | 8.2 | | 18 | Export (in US $ bn.) | 299.5 | 299.1 | 320.6 | 285.0 | | | Export (growth rate in percent) | 22.2 | 19.5 | 45.0 | 14.0 | | 19 | Import (in US $ bn.) | 446.6 | 443.7 | 478.1 | 427.0 | | | Import (Growth rate in percent) | 24.2 | 24.4 | 34.5 | 15.3 | | 20 | Trade Balance (% of GDP) | -8.0 | -7.6 | -6.3 | -14.1 | | 21 | Invisible Balance (US $ bn) | 92.6 | 93.8 | 107.0 | 70.0 | | 22 | Current Account Balance (US $ bn) | -56.2 | -56.9 | -42.0 | -73.3 | | 23 | Current Account Balance (% of GDP) | -3.0 | -2.9 | -2.1 | -5.7 | | 24 | Capital Account Balance (US $ bn) | 66.1 | 65.0 | 80.6 | 56.0 | | 25 | Capital Account Balance (% of GDP) | 3.5 | 3.3 | 6.8 | 2.8 |
| Table A.2 : Annual Forecasts for 2012-13 | | | Key Macroeconomic Indicators | Annual Forecasts for 2012-13 | | Mean | Median | Max | Min | | 1 | Real GDP growth rate at factor cost (in per cent) | 7.7 | 7.7 | 8.5 | 6.5 | | a | Agriculture & Allied Activities | 3.3 | 3.0 | 4.4 | 2.6 | | b | Industry | 6.9 | 6.9 | 9.1 | 5.0 | | c | Services | 9.0 | 9.0 | 9.8 | 8.2 | | 2 | Private Final Consumption Expenditure at current market price (growth rate in per cent) | 14.4 | 14.9 | 18.5 | 7.5 | | 3 | Gross Domestic Saving (per cent of GDP at current market price) | 34.3 | 34.6 | 35.1 | 33.0 | | | of which Private Corporate Sector | 8.7 | 9.0 | 9.2 | 8.0 | | 4 | Gross Domestic Capital Formation (per cent of GDP at current market price) | 34.1 | 35.0 | 36.2 | 28.0 | | 5 | Gross Fixed Capital Formation (per cent of GDP at current market price) | 31.3 | 32.0 | 34.5 | 26.0 | | 6 | Money Supply (M3) (growth rate in per cent) | 16.9 | 17.0 | 18.7 | 15.5 | | 7 | Bank Credit (growth rate in per cent) | 18.7 | 18.0 | 22.9 | 16.0 | | 8 | Combined Gross Fiscal Deficit (per cent of GDP) | 7.6 | 7.4 | 11.0 | 6.5 | | 9 | Central Govt. Fiscal Deficit (per cent of GDP) | 5.0 | 4.9 | 6.0 | 4.4 | | 10 | Corporate profit after tax (growth rate in per cent) | 12.1 | 10.0 | 20.0 | 5.0 | | 11 | Repo (end period) | 7.7 | 7.50 | 8.5 | 6.8 | | 12 | Reverse Repo (end period) | 6.7 | 6.8 | 7.5 | 5.8 | | 13 | CRR (end period) | 5.7 | 6.00 | 6.0 | 4.0 | | 14 | INR/ 1USD (RBI reference rate-end period) | 45.1 | 45.0 | 47.0 | 43.1 | | 15 | T-Bill 91 days Yield (per cent-end period) | 7.7 | 7.7 | 8.2 | 7.1 | | 16 | 10 year Govt. Securities Yield (per cent-end period) | 8.1 | 8.0 | 8.4 | 7.7 | | 17 | Overall Balance (in US $ bn.) | 20.3 | 19.5 | 40.0 | 0.9 | | 18 | Export (in US $ bn.) | 359.5 | 358.5 | 405.0 | 325.5 | | | Export (growth rate in percent) | 19.1 | 20.0 | 31.0 | 11.0 | | 19 | Import (in US $ bn.) | 516.7 | 505.5 | 585.0 | 425.0 | | | Import (Growth rate in percent) | 18.3 | 18.0 | 30.0 | 10.0 | | 20 | Trade Balance (% of GDP) | -7.1 | -7.2 | -5.9 | -8.3 | | 21 | Invisible Balance (US $ bn.) | 103.5 | 104.2 | 134.5 | 82.0 | | 22 | Current Account Balance (US $ bn) | -62.5 | -60.6 | -49.0 | -90.0 | | 23 | Current Account Balance (Growth in per cent) | -2.6 | -2.5 | -2.0 | -3.0 | | 24 | Capital Account Balance (US $ bn) | 78.5 | 80.0 | 88.7 | 65.0 | | 25 | Capital Account Balance (Growth in per cent) | 3.3 | 3.4 | 3.7 | 2.7 |
| Table A.3: Quarterly Forecasts Q2: 2011-12 to Q2: 2012-13 | | Key Macroeconomic Indicators | Quarterly Forecasts | | Q2:11-12 | Q3:11-12 | | Mean | Median | Max | Min | Mean | Median | Max | Min | | Real GDP growth rate at factor cost (per cent) | 7.3 | 7.5 | 7.8 | 6.0 | 7.6 | 7.7 | 8.2 | 6.4 | | Agriculture & Allied Activities | 4.1 | 3.8 | 6.3 | 3.0 | 2.9 | 2.7 | 5.7 | 0.5 | | Industry | 6.2 | 6.0 | 7.8 | 5.0 | 6.9 | 7.1 | 8.5 | 5.1 | | Services | 8.8 | 9.0 | 9.5 | 7.1 | 9.2 | 9.2 | 9.9 | 8.0 | | IIP growth rate (per cent) | 5.9 | 6.0 | 7.5 | 4.5 | 5.9 | 5.8 | 7.9 | 3.6 | | Private Final Consumption Expenditure (growth rate in per cent) | 12.9 | 15.5 | 18.8 | 5.0 | 13.1 | 14.0 | 17.0 | 6.6 | | Gross Domestic Capital Formation (per cent of GDP at current market price) | 34.2 | 34.2 | 34.2 | 34.2 | 34.5 | 34.5 | 34.5 | 34.5 | | Gross Fixed Capital Formation (per cent of GDP at current market price) | 29.3 | 29.0 | 33.5 | 26.0 | 30.0 | 29.5 | 34.0 | 25.0 | | Corporate profit after tax (growth rate in per cent) | 4.5 | 5.8 | 9.0 | -2.6 | 9.2 | 7.9 | 15.0 | 6.0 | | INR/ 1USD (RBI reference rate- end period) | 48.3 | 49.0 | 49.1 | 45.0 | 48.2 | 48.0 | 50.0 | 45.2 | | Repo Rate (end period) | 8.25 | 8.25 | 8.50 | 8.25 | 8.50 | 8.50 | 8.50 | 8.25 | | Reverse Repo Rate (end period) | 7.25 | 7.25 | 7.50 | 6.25 | 7.50 | 7.50 | 7.50 | 7.25 | | CRR (end period) | 6.00 | 6.00 | 6.00 | 6.00 | 6.00 | 6.00 | 6.00 | 5.50 | | BSE INDEX (end period) | 16538 | 16499 | 16700 | 16454 | 16500 | 16500 | 17000 | 16000 | | Export (US $ bn.) | 72.9 | 75.0 | 80.8 | 61.5 | 73.4 | 73.7 | 81.2 | 65.0 | | Import (US $ bn.) | 109.2 | 109.2 | 115.7 | 100.5 | 109.4 | 106.5 | 125.3 | 100.0 | | Trade Balance (US $ bn.) | -32.2 | -34.8 | -14.0 | -39.0 | -32.2 | -37.7 | -14.2 | -44.1 | | Oil Price(in US$ per barrel) | 104.9 | 107.0 | 112.5 | 90.0 | 103.1 | 100.4 | 110.0 | 99.0 |
| A.3 (contd.) | | Key Macroeconomic Indicators | Quarterly Forecasts | | Q4:11-12 | Q1:12-13 | Q2:12-13 | | Mean | Median | Max | Min | Mean | Median | Max | Min | Mean | Median | Max | Min | | Real GDP growth rate at factor cost (per cent) | 7.7 | 7.8 | 8.4 | 6.8 | 7.6 | 7.6 | 8.1 | 6.7 | 7.6 | 7.6 | 8.2 | 6.5 | | Agriculture & Allied Activities | 3.2 | 3.1 | 5.5 | 1.0 | 3.1 | 3.0 | 4.2 | 1.6 | 3.1 | 3.2 | 4.4 | 1.5 | | Industry | 7.0 | 7.6 | 8.9 | 4.4 | 6.9 | 7.2 | 8.3 | 5.2 | 6.7 | 6.8 | 8.2 | 4.7 | | Services | 9.1 | 9.1 | 10.3 | 8.0 | 8.9 | 8.9 | 9.8 | 8.0 | 8.8 | 9.1 | 9.2 | 8.0 | | IIP growth rate (per cent) | 5.8 | 5.4 | 7.8 | 3.9 | 6.2 | 6.0 | 8.0 | 4.6 | 6.5 | 6.5 | 8.2 | 5.1 | | Private Final Consumption Expenditure (%growth) | 13.9 | 15.5 | 17.0 | 7.0 | 13.5 | 15.5 | 18.5 | 5.2 | 13.5 | 15.0 | 18.8 | 5.6 | | Gross Domestic Capital Formation (% of GDP at current market price) | 34.8 | 34.8 | 34.8 | 34.8 | 35.0 | 35.0 | 35.0 | 35.0 | 35.0 | 35.0 | 35.0 | 35.0 | | Gross Fixed Capital Formation (% of GDP at current market price) | 30.6 | 31.0 | 35.0 | 25.0 | 31.0 | 32.0 | 35.4 | 24.0 | 30.7 | 31.4 | 35.6 | 23.0 | | Corporate profit after tax (growth rate in per cent) | 14.4 | 13.0 | 25.3 | 6.2 | 11.0 | 7.0 | 20.0 | 6.0 | 11.6 | 7.0 | 22.0 | 5.8 | | INR/ 1USD (RBI reference rate- end period) | 47.0 | 47.0 | 50.5 | 45.0 | 46.3 | 46.1 | 50.0 | 43.7 | 46.0 | 45.8 | 51.5 | 43.5 | | Repo Rate (end period) | 8.50 | 8.50 | 8.50 | 8.25 | 8.27 | 8.4 | 8.50 | 7.75 | 8.1 | 8.3 | 8.5 | 7.5 | | Reverse Repo Rate (end period) | 7.50 | 7.50 | 7.50 | 7.25 | 7.3 | 7.4 | 7.5 | 6.8 | 7.1 | 7.3 | 7.5 | 6.5 | | CRR (end period) | 6.00 | 6.00 | 6.25 | 5.00 | 5.9 | 6.0 | 6.0 | 5.0 | 5.8 | 6.0 | 6.0 | 5.0 | | BSE INDEX (end period) | 16700 | 16400 | 17500 | 16200 | 17500 | 17200 | 18500 | 16800 | 17867 | 17600 | 19000 | 17000 | | Export (US $ bn.) | 72.7 | 73.3 | 75.9 | 67.3 | 72.0 | 72.9 | 80.1 | 62.0 | 77.3 | 78.2 | 89.0 | 64.0 | | Import (US $ bn.) | 110.1 | 107.4 | 116.0 | 106.0 | 109.2 | 107.5 | 122.5 | 99.1 | 116.2 | 116.9 | 129.1 | 102.0 | | Trade Balance (US $ bn). | -33.3 | -39.0 | -10.8 | -41.7 | -32.6 | -38.0 | -14.4 | -42.4 | -34.2 | -38.0 | -15.6 | -41.5 | | Oil Price(in US$ per barrel) | 103.0 | 102.0 | 113.0 | 98.0 | 100.1 | 100.0 | 103.0 | 95.2 | 101.1 | 102.5 | 104.0 | 95.0 |
| Table A.4: Forecasts for WPI and CPI-IW | | | WPI | WPI-MP | CPI-IW | | Mean | Median | Max | Min | Mean | Median | Max | Min | Mean | Median | Max | Min | | Q3:11-12 | 8.8 | 8.8 | 9.2 | 8.3 | 7.1 | 7.0 | 7.7 | 6.4 | 8.5 | 8.5 | 9.4 | 7.8 | | Q4:11-12 | 7.1 | 7.0 | 8.0 | 6.3 | 5.9 | 5.8 | 7.9 | 4.2 | 7.4 | 7.3 | 8.6 | 6.7 | | Q1:12-13 | 6.7 | 6.6 | 7.4 | 6.0 | 5.5 | 5.4 | 6.9 | 4.6 | 7.3 | 7.0 | 9.2 | 6.4 | | Q2:12-13 | 6.6 | 6.6 | 6.8 | 6.4 | 5.7 | 5.8 | 6.7 | 4.5 | 6.9 | 6.5 | 7.9 | 6.0 |
| Table A.5: Mean probabilities attached to possible outcomes of GDP | | Growth Range | Forecasts for 2011-12 | Forecasts for 2012-13 | | Below 3 per cent | 0.1 | 0.2 | | 3 to 3.4 per cent | 0.1 | 0.2 | | 3.5 to 3.9 per cent | 0.1 | 0.2 | | 4 to 4.4 per cent | 0.1 | 0.2 | | 4.5 to 4.9 per cent | 0.1 | 0.2 | | 5 to 5.4 per cent | 0.1 | 0.2 | | 5.5 to 5.9 per cent | 0.1 | 0.2 | | 6 to 6.4 per cent | 1.6 | 3.7 | | 6.5 to 6.9 per cent | 7.3 | 11.3 | | 7 to 7.4 per cent | 24.2 | 16.9 | | 7.5 to 7.9 per cent | 48.9 | 31.9 | | 8 to 8.4 per cent | 13.2 | 19.8 | | 8.5 to 8.9 per cent | 2.4 | 10.1 | | 9 to 9.4 per cent | 0.4 | 3.9 | | 9.5 to 9.9 per cent | 0.3 | 0.2 | | 10 to 10.4 per cent | 0.1 | 0.2 | | 10.5 to 10.9 per cent | 0.1 | 0.2 | | 11 to 11.4 per cent | 0.1 | 0.2 | | 11.5 to 11.9 per cent | 0.1 | 0.2 | | 12 percent or more | 0.1 | 0.2 |
| Table A.6: Mean probabilities attached to possible outcomes of WPI | | Growth Range | Forecasts for End-March 2011-12 | Forecasts for End-March 2012-13 | | Below -3 per cent | 0.1 | 0.2 | | -3 to -2.1 per cent | 0.1 | 0.2 | | -2 to -1.1 per cent | 0.1 | 0.2 | | -1 to -0.1 per cent | 0.1 | 0.2 | | 0 to 0.9 per cent | 0.1 | 0.2 | | 1 to 1.9 per cent | 0.1 | 0.2 | | 2 to 2.9 per cent | 0.1 | 0.2 | | 3 to 3.9 per cent | 0.1 | 0.2 | | 4 to 4.9 per cent | 1.7 | 7.1 | | 5 to 5.9 per cent | 9.1 | 26.1 | | 6 to 6.9 per cent | 30.4 | 36.1 | | 7 to 7.9 per cent | 32.1 | 24.6 | | 8 to 8.9 per cent | 13.1 | 1.4 | | 9 to 9.9 per cent | 11.4 | 1.0 | | 10 to 10.9 per cent | 0.6 | 1.0 | | 11 to 11.9 per cent | 0.1 | 0.2 | | 12 to 12.9 per cent | 0.1 | 0.2 | | 13 to 13.9 per cent | 0.1 | 0.2 | | 14 to 14.9 per cent | 0.1 | 0.2 | | 15 per cent and above | 0.1 | 0.2 |
| Table A.7: Annual Average Percentage Change | | Annual average percentage change over the next five years | Annual average percentage change over the next ten years | | | Real GDP | WPI Inflation | CPI-IW Inflation | | Real GDP | WPI Inflation | CPI-IW Inflation | | Minimum | 7.8 | 4.5 | 6.0 | Minimum | 7.5 | 4.5 | 5.0 | | Lower Quartile | 8.0 | 6.0 | 6.5 | Lower Quartile | 8.0 | 5.5 | 6.0 | | Median | 8.0 | 6.0 | 7.0 | Median | 8.0 | 6.0 | 6.2 | | Upper Quartile | 8.3 | 6.5 | 7.5 | Upper Quartile | 8.5 | 6.0 | 7.0 | | Maximum | 9.5 | 7.2 | 9.0 | Maximum | 9.5 | 6.7 | 9.0 | | Mean | 8.2 | 6.1 | 7.0 | Mean | 8.2 | 5.8 | 6.4 | | S.D | 0.5 | 0.6 | 0.8 | S.D | 0.5 | 0.6 | 1.0 |
|
 IST,
IST,