 IST,
IST,


Non-Banking Financial Institutions
During 2012-13, the non-banking financial sector witnessed further consolidation as the number of Non-Banking Financial Companies (NBFCs) operating in the economy declined. On the whole, Non-Banking Financial Institutions (NBFIs) had a comfortable capital adequacy position. Several regulatory guidelines were issued by the Reserve Bank to increase the resilience of the sector. From time to time, the Reserve Bank has also been carrying outreach and sensitisation programmes, besides issuing public notices, cautioning the general public not to fall prey to fictitious offers promising unsustainable returns by individuals, unincorporated bodies and companies. 1. Introduction 6.1 Non-Banking Financial Institutions (NBFIs) are a heterogeneous group of institutions that cater to a wide range of financial requirements and can broadly be grouped as financial institutions (FIs), non-banking financial companies (NBFCs) and primary dealers (PDs). This chapter provides an analysis of financial performance and soundness indicators related to each segment of NBFIs during 2012-13 and is organised as follows. Section 2 analyses the financial performance of FIs, while Section 3 discusses the financial performance of NBFCs accepting public deposits (NBFCs-D), Non- Deposit taking Systemically Important NBFCs (NBFCs-ND-SI) and residuary non-banking companies (RNBCs). Section 4 provides an analysis of the performance of PDs in primary and secondary markets, which is followed by an overall assessment in the last section. 2. Financial Institutions 6.2 As at end-March 2013, there were four financial institutions (FIs) under the regulation and supervision of the Reserve Bank viz., the Export-Import Bank of India (EXIM Bank), National Bank for Agriculture and Rural Development (NABARD), National Housing Bank (NHB) and Small Industries Development Bank of India (SIDBI) (Table VI.1). The Industrial Investment Bank of India (IIBI), the fifth FI, is in the process of voluntary winding-up. The Ministry of Finance had issued a gazette notification to this effect on September 16, 2012.
Operations of Financial Institutions Decline in the financial assistance sanctioned and disbursed by Financial Institutions 6.3 The financial assistance sanctioned and disbursed by FIs decreased during 2012-13 (Table VI.2). Assets and Liabilities of FIs 6.4 The combined balance sheet of all the four FIs expanded by 15.9 per cent during 2012-13 (Table VI.3). On the liability side, “deposits” along with “bonds and debentures” constituted more than 60 per cent of total liabilities. On the assets side, “loans and advances” continued to be the single largest component, accounting for 88.8 per cent of total assets. Resources Mobilised by FIs Lower resources raised, but increased dependence on foreign currency resources 6.5 Total resources raised by FIs during 2012-13 were lower than the previous year. Both short-term and long-term resources raised declined, while those raised through foreign currency recorded a sharp increase (Table VI.4). Rise in foreign currency borrowings was mainly with respect to EXIM Bank as it more than doubled its external borrowings during the year. 6.6 In the money market, among the four FIs, NABARD raised the largest amount of resources followed by EXIM Bank, SIDBI and NHB (Table VI.5). Commercial papers (CPs) were the major instruments for raising funds from the money market for all the four FIs during 2012-13.
Sources and Uses of Funds Sharp rise in external sources of funds raised by FIs 6.7 During 2012-13, funds raised by FIs from external sources increased by 73.4 per cent, while that from internal sources decreased by 9.3 per cent (Table VI.6). Share of “other” sources of funds for the FIs more than doubled to 8.1 per cent. In case of deployment of funds, the share of fresh deployments declined sharply to 43.8 per cent, whereas the funds used in other deployments surged significantly to 28.2 per cent. Maturity and Cost of Borrowings and Lending 6.8 During 2012-13, while the weighted average cost (WAC) of rupee resources raised by NHB and NABARD decreased, that for SIDBI increased marginally and for EXIM Bank, it remained at the previous level of 9 per cent (Table VI.7). NABARD had the highest WAC of rupee resources raised and SIDBI had the least. Insofar as weighted average maturity (WAM) is concerned, while SIDBI had the longest WAM of 4.9 years, NABARD had the shortest WAM of 1.8 years. During 2012-13, while NHB lowered its long-term prime lending rate (PLR), EXIM Bank and SIDBI kept their PLRs unchanged (Table VI.8).
Financial Performance of FIs Rise in profitability due to increase in non-interest income 6.9 Financial performance of FIs improved during 2012-13 as both their operating and net profits increased. Increase in FIs’ operating expenses during 2012-13 was mainly led by higher wage bill (Table VI.9). Return on assets (RoA) in respect of all the FIs remained almost stable during 2012-13. Amongst the FIs, SIDBI had the highest RoA followed by NHB, EXIM Bank and NABARD (Table VI.10).
Soundness Indicators Asset Quality Impaired assets increased during the year 6.10 As compared to last year, net NPAs of FIs at aggregate level increased mainly on account of higher net NPAs in respect of EXIM Bank, SIDBI and NHB. The largest quantum of net NPAs was held by SIDBI, followed by EXIM Bank, and NHB. NABARD had the least NPAs among the FIs and its NPA position, in fact, improved during the year (Table VI.11). The rise in net NPAs of NHB was on account of restructured loan accounts being classified as “sub-standard” asset (Table VI.12). 6.11 During 2012-13, while the FIs’ total loss assets declined, the quantum of sub-standard and doubtful assets increased. EXIM Bank and SIDBI’s sub-standard assets increased, whereas those of NABARD declined substantially.
Capital Adequacy Capital adequacy position of FIs remains comfortable 6.12 The CRAR of all the FIs was lower during 2012-13 than the previous year. However, all the four FIs maintained a CRAR higher than the minimum stipulated norm of 9 per cent (Table VI.13). 3. Non-Banking Financial Companies 6.13 Based on liabilities, NBFCs are classified into two categories - Category “A” companies (NBFCs-D), and Category “B” companies (NBFCs not raising public deposits or NBFCs-ND). NBFCs-D are subject to requirements of capital adequacy, maintaining liquid assets, exposure norms (including restrictions on exposure to investments in land, building and unquoted shares), ALM discipline and reporting requirements. Category “B” companies, in contrast, were subject to minimal regulation till 2006. However, since April 1, 2007, non-deposit taking NBFCs with assets of `1 billion and above have been classified as NBFCs- ND-SI and prudential regulations such as capital adequacy requirements and exposure norms along with reporting requirements have been made applicable to them. Capital market exposure (CME) and asset liability management (ALM) reporting and disclosure norms were also made applicable to them at different points of time. 6.14 In terms of activities undertaken, NBFCs are classified into eight categories, viz., Asset Finance Companies (AFCs), Investment Companies (ICs), Loan Companies (LCs), Infrastructure Finance Companies (IFCs), Core Investment Companies (CICs), Infrastructure Debt Fund - Non-Banking Financial Companies (IDF-NBFCs), Non-Banking Financial Company - Micro Finance Institutions (NBFC-MFIs) and NBFC-Factors. 6.15 During 2012-13, various policy measures were introduced to improve the regulation and supervision of NBFCs (see Chapter III). The Reserve Bank has been carrying outreach and sensitisation programmes, besides issuing public notices, from time to time, cautioning the general public not to fall prey to fictitious offers promising unsustainable returns by individuals, unincorporated bodies and companies. Further, the Reserve Bank has also advised the public to evaluate their investment decisions carefully, including making deposit with NBFCs. The Reserve Bank also clarified that it does not regulate chit fund activities or Collective Investment Schemes (CIS). It regulates only those NBFCs that conduct financial activity as their principal business and that it has authorised only a few of them to accept deposits and such entities do not enjoy DICGC’s deposit insurance facility. 6.16 In the aftermath of recent global financial crisis, the operations of shadow banking system have come under scrutiny of regulators in large number of economies. The form of shadow banking prevalent in developed economies and other EMEs is very different from what prevails in India. In India, NBFCs, which remain outside the regulatory framework as applicable to banks, in essence, are referred to as shadow banking (Box VI.1). 6.17 As per the ownership structure of NBFCs- ND-SI and deposit-taking NBFCs as at end-March 2013, it is found that a majority of them were non-government Public Limited Companies (Table VI.14). Box VI.1: The recent global financial crisis brought to fore the role of ‘shadow banking’ and the related issues. Shadow banking essentially refers to a system wherein financial entities (such as money market entities, private equity funds, hedge funds, securitisation companies, structured investment vehicles, etc.) undertake credit intermediation activities akin to banks, while remaining outside the traditional regulatory regime, which are otherwise applicable to banks. In 2007, Paul McCulley had coined the term “shadow bank” mainly referring to US-based non-bank financial institutions engaging in maturity transformation (use of short-term deposits to finance long-term loans). The Financial Stability Board (FSB) has defined “shadow banking” as “credit intermediation involving entities and activities (fully or partially) outside the regular banking system”. It is estimated that the global shadow banking system could have been running to $67 trillion at the end of 2011, which is 25 per cent of the total financial intermediation (FSB, 2012). According to a report by FSB (2012), the largest relative presence of a shadow banking system (NBFIs/OFIs) is in Netherlands (45 per cent), followed by USA (35 per cent), Hong Kong (around 35 per cent), the euro area (30 per cent), Switzerland, UK, Singapore, and Korea (all around 25 per cent). The modus operandi of shadow banking lacks transparency with respect to its business model, leverage position; ownership, etc. which leaves it less amenable to regulatory framework. Since shadow bank entities have no access to central bank funding or safety nets like deposit insurance, they remain vulnerable to shocks posing systemic risk depending on their size and inter-connectedness with the formal financial system. While the merits of the shadow banking system of providing quick, customised, cost-effective, and an alternate source of credit and liquidity remains undisputed, its capacity to precipitate systemic crisis, which was manifested in the recent global financial crisis, cannot be wished away. In the years preceding the recent global financial crisis, these entities expanded into new vistas of financial activities/ instruments, which, at times, also crossed borders to meet the growing risk appetite of various investors. The expansion of shadow banking activities was apathetic to the risks associated with them. The existence of shadow banking system was stated to have amplified the magnitude of the crisis owing to the following factors. Firstly, the interconnection between the regular banking and shadow banking systems had increased as the banks were lenders to these entities. Products issued by the latter enhanced the leveraged position of the banks and put them to a higher risk position. Secondly, due to the near absence of regulation, the shadow banking system was able to operate without internalising the true cost of its risk and more entities (including banks) preferred to take the route of shadow banking that circumvented banking regulations. This type of regulatory arbitrage led to a system-wide build-up of huge leverage and risks. Thirdly, since shadow banks relied more on short-term deposit-like funding, which had no deposit insurance, loss of confidence resulted in “runs” on these unregulated institutions. While the role of shadow banking generated apparent economic efficiencies through financial innovations, the crisis demonstrated that shadow banking also created new channels of contagion and systemic risk transmission between traditional banks and the capital markets. Therefore, globally a need was felt to bring such unregulated entities under the regulatory architecture. The United States passed the Dodd-Frank Act in 2010 that strengthened the arms of the Federal Reserve to regulate all institutions of systemic importance. In order to control burgeoning shadow banking activities, the European Union has put in place some measures, which inter alia include prudential rules concerning securitisation, regulation of credit rating agencies, etc. Further, at the request of the G-20 countries, FSB has been framing policies to strengthen the oversight and regulation of the shadow banking system at international level so that the risks emanating from them may be mitigated. In India, NBFCs, which perform bank-like credit intermediation activities, while remaining outside the banking regulatory framework, essentially embody the shadow banking system (Sinha, 2013). The form of “shadow banking system” (for example, hedge funds, proprietary funds, special investment vehicles and leveraged funds) as it exists in much of the developed world is largely unrelated to the Indian context. India is essentially a bank-dominated financial system wherein banks account for about 60 per cent of the financial sector’s assets. The assets of entire “other financial intermediaries” (OFIs) accounted for approximately 24 per cent of bank assets as on March 31, 2012, whereas the assets of the NBFC sector alone accounted for 12 per cent, which denotes the significance of NBFCs in the shadow banking system (Sinha, op. cit.). Thus, as compared to other advanced economies, the size and activities of shadow banking in India are relatively smaller. Furthermore, unlike many advanced countries, in India, there is a well-defined regulatory framework for NBFCs and overtime, progressive and prudent regulatory measures have brought consolidation in the sector. Albeit, the global financial crisis in 2008 put some pressure on the NBFC sector in the country due to funding inter-linkages among NBFCs, mutual funds and commercial banks, these were duly resolved. The crisis, however, brought to the fore certain regulatory issues concerning the NBFC sector, particularly risks arising from regulatory gaps, arbitrage and systemic inter-connectedness. These are being continually addressed through appropriate regulatory measures. Recently, the Reserve Bank of India also appointed a Working Group to macro-map the shadow banking sector in India. The Working Group is expected to submit the report in due course. References Financial Stability Board (2011): ‘Shadow Banking: Scoping the Issues’, A Background Note of the Financial Stability Board. Financial Stability Board (2012): Global Shadow Banking Monitoring Report 2012. Sinha, Anand (2013): Regulation of Shadow Banking – Issues and Challenges, Reserve Bank of India Bulletin, March.
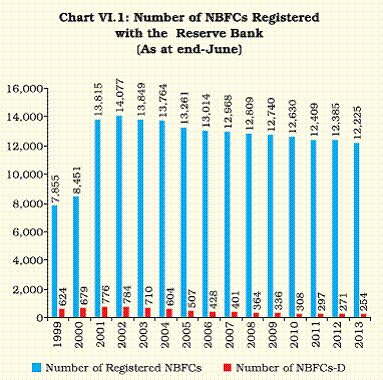
Profile of NBFCs (including RNBCs) The NBFC segment is witnessing consolidation 6.18 The total number of NBFCs registered with the Reserve Bank declined marginally to 12,225 as at end-June 2013 (Chart VI.1). The number of NBFCs-D during 2012-13 declined mainly due to the cancellation of Certificates of Registration (CoR) and migration to non-deposit-taking category. 6.19 Though the number of NBFCs in business declined, their total assets, and net owned funds increased marginally. Public deposits mobilised by them also increased. Holding of public deposits by the Residuary Non-Banking Companies(RNBCs) contracted (Table VI.15).
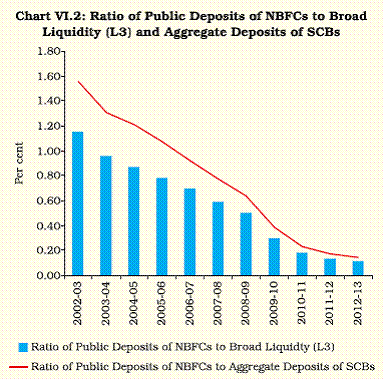
6.20 Despite a rise in deposits mobilised by NBFCs, the ratio of NBFCs’ public deposits to aggregate deposits of scheduled commercial banks (SCBs) continued to decline during 2012-13. The ratio of NBFCs’ deposits to the broadest measure of liquidity aggregates, L31, also declined during the year (Chart VI.2). Operations of NBFCs-D (excluding RNBCs) The consolidated balance sheet of NBFCs-D expanded modestly 6.21 During the year, the consolidated balance sheet of NBFCs-D expanded marginally by 2.2 per cent (Table VI.16). On the liability side, during 2012-13, borrowings from banks, albeit declined, constituted the biggest source of funding for NBFCs-D. Debentures and public deposits were the next important sources of finance. Borrowings from FIs were relatively minimal but this picked up dramatically by 170 per cent during the year. On the contrary, borrowings from government and inter-corporate borrowings declined substantially. On the asset side, loans and advances of NBFCs-D constituted close to three-fourth of their assets. The investments declined during the year mainly on the back of a decline in investments in equity shares. The investments in commercial paper also declined substantially. Investment in government securities, debentures & bonds, and mutual funds schemes, however, showed an increase.
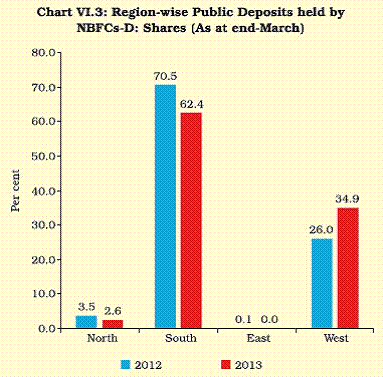
6.22 The number of deposit-taking NBFCs declined during the year. Notwithstanding this, deposits mobilised and borrowings increased during the year. Among the NBFCs-D, while the balance sheet of Asset Finance Companies (AFCs) grew, that of Loan Companies (LCs) shrunk (Table VI.17). Size-wise Classification of Deposits of NBFCs-D Larger NBFCs-D mobilised a large chunk of public deposits 6.23 Six larger companies, constituting just about 2.8 per cent of the total number of NBFCs-D, mobilised about 95 per cent of total deposits of the NBFCs-D at end-March 2013 (Table VI.18). Regional Dispersion of Deposits Mobilised by NBFCs-D Majority of public deposits were mobilised in the southern region 6.24 Region-wise, the northern zone had the highest number of deposit taking NBFCs followed by the southern region. However, about 60 per cent of the public deposits were mobilised in the southern region. A similar pattern can be observed in the case of metropolitan cities. While New Delhi accounted for the largest number of NBFCs-D, Chennai held the largest share of 63.1 per cent in total public deposits of NBFCs-D (Table VI.19 and Chart VI.3). In the western zone, the amount of public deposits held by NBFCs-D increased significantly despite a decline in their numbers during 2012-13. This is particularly evident in Mumbai.
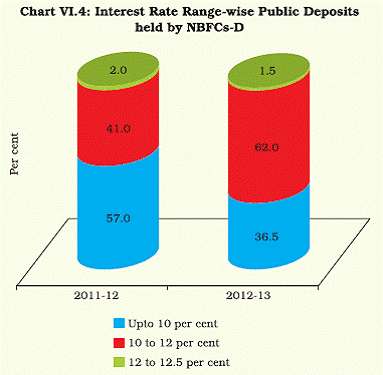
Interest Rate on Public Deposits with NBFCs-D Public deposits in the interest range of 10 to 12 per cent grew sharply 6.25 In the wake of a tightened liquidity environment, a relatively large chunk of public deposits raised by NBFCs-D were in the interest rate range of 10 to 12 per cent. Accordingly, during 2012-13, the share of deposits having interest rate upto 10 per cent came down to 36.5 per cent from 56.9 per cent last year (Table VI. 20 and Chart VI.4). Maturity Profile of Public Deposits of NBFCs-D 6.26 During the year, a large proportion of public deposits raised by NBFCs-D belonged to the short to medium-term of the maturity spectrum. There was a notable rise in the share of short-term deposits (less than a year) as also long-term deposits with tenure of five years and above (Table VI.21 and Chart VI.5).
6.27 Total borrowings of NBFCs-D increased in 2012-13 due to a significant rise in the borrowings of AFCs, which offset the reduction in the borrowings of LCs (Table VI.22). NBFCs-D borrowed mainly from banks and financial institutions and through floating debentures. Assets of NBFCs-D Asset size of the NBFCs-D sector expanded moderately during the year 6.28 Notwithstanding a decline in the asset size of LCs, the total assets of the NBFCs-D sector registered a marginal increase during 2012-13 mainly due to rise in assets of AFCs (Table VI.23). Component-wise, advances accounted for a predominant share in total assets followed by investment. Asset Size-wise Distribution of NBFCs-D Highly skewed distribution of assets of NBFCs-D 6.29 At end-March 2013, about 5 per cent of NBFCs-D had an asset size of more than `5,000 million and accounted for about 97 per cent of total assets of all NBFCs-D (Table VI.24).
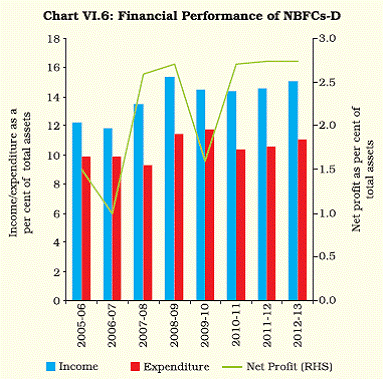
Financial Performance of NBFCs-D Financial performance of NBFCs-D sector showed marginal improvement. 6.30 During the year, though the net profit of NBFCs-D showed marginal improvement, RoA remained at the previous year’s level at 2.7 per cent (Chart VI.6). In view of increased costs, cost-to-income ratio of the NBFCs-D also rose during the year (Table VI.25). Soundness Indicators: Asset Quality of NBFCs-D Deterioration in asset quality of NBFCs-D 6.31 For the last couple of years, the asset quality of the NBFCs-D has been deteriorating. Continuing with last year’s higher level of NPA, it further deteriorated during 2012-13 (Table VI.26). Weakening of the asset quality of NBFCs-D broadly followed the prevailing trend of rising NPAs in the banking sector and may, inter alia, be attributed to slackened economic activity. 6.32 A bulk of the NPAs of NBFCs-D were concentrated in AFCs. During 2012-13, the gross NPAs pertaining to AFCs increased by `7 billion, whereas for LCs it went up only by `1 billion. The NPA ratios for both groups of NBFCs-D increased during the year on top of higher increase in NPAs in the previous year (Table VI.27).
6.33 Of the three NPA categories, the share of sub-standard assets increased during 2012-13, which reflected deterioration in asset quality. Substandard assets rose, both with respect to AFCs and LCs (Table VI.28).
6.34 Of the total 209 reporting NBFCs-D, 206 companies had maintained a CRAR in excess of 15 per cent as at end-March 2013 (Table VI.29). Further, 173 companies had CRAR above 30 per cent. The ratio of public deposits to net owned fund (NOF) of NBFCs-D increased marginally as at end-March 2013 (Table VI.30). Although the number of companies above the NOF of `5,000 million had reduced to seven, their total NOF rose marginally (Table VI.31).
Residuary Non-Banking Companies (RNBCs) RNBCs are in the process of migrating to other business models 6.35 The assets of RNBCs declined marginally during the year ended-March 2013 (Table VI.32). Their assets mainly consisted of fixed deposits/ certificates of deposits of SCBs followed by bonds/debentures and investments in unencumbered approved securities. The NOF of RNBCs during 2012-13 remained more or less at the same level as in the previous year. Both the income and expenses of RNBCs declined during 2012-13. As the decline in total income of RNBCs was less than the decline in total expenditure, their operating profits increased modestly. Furthermore, on account of lesser tax outgo as compared to the previous year, RNBCs’ net profit (PAT) increased by 9.1 per cent during 2012-13.
Regional Pattern of Deposits of RNBCs 6.36 At end-March 2013, there were two RNBCs, located in eastern and northern regions. Given regulatory stipulations, RNBCs are in the process of migrating to other business models and these companies will have to reduce their aggregate liabilities to the depositors (ALDs) to “nil” by end- June 2015. Accordingly, public deposits held by the two RNBCs continued to decline during 2012- 13. (Table VI.33).
Investment Pattern of RNBCs 6.37 During 2012-13, the investments of RNBCs declined, which is in line with the regulatory stipulations mentioned in previous paragraph (Table VI.34).
NBFCs-ND-SI NBFCs-ND-SI raised more resources through debentures, borrowings from banks and FIs 6.38 The consolidated balance sheet of NBFCs- ND-SI expanded by 19.5 per cent during 2012-13. On the liability side, borrowings (secured and unsecured) by NBFCs-ND-SI, which constituted more than two-thirds of total liabilities, increased significantly by 22.2 per cent during the year (Table VI.35). The NBFCs-ND-SI borrowed mainly by floating debentures, followed by borrowings from banks and FIs, commercial paper, and intercorporate borrowings. Unsecured borrowings of NBFCs-ND-SI, constituting slightly less than half the total borrowings, expanded significantly and outpaced the growth in secured borrowings during 2012-13. The unsecured borrowings were largely raised through debentures, followed by borrowings from banks, commercial paper, inter-corporate borrowings and borrowings from FIs. Amongst the unsecured modes, “borrowings from FIs” more than doubled (126.4 per cent) during 2012-13, while borrowings from unsecured debentures and commercial paper grew by 32.2 and 25.1 per cent, respectively. Unsecured borrowings from banks increased marginally during 2012-13.
6.39 The asset position of NBFCs-ND-SI further strengthened in 2012-13. Loans and advances, which formed a major part of the assets, increased by 22 per cent. The rise in hire-purchase assets and investment also propped up the asset position of NBFCs-ND-SI. The leverage ratio of the NBFCs- ND-SI sector had increased marginally to 3.20. Exposure of this segment to capital market as a per cent of total assets declined from 8.9 per cent to 8.1 per cent during the year. Borrowings of NBFCs-ND-SI by Region The northern region continued to be the main source of funds 6.40 Analysis of region-wise borrowings of the NBFCs-ND-SI reveals the dominance of northern and western regions; together they constituted more than 70 per cent of the total borrowings during the year ended-March 2013. Compared to other regions, the eastern and southern regions showed higher growth in borrowings (Table VI.36).
Financial Performance NBFCs-ND-SI showed improved financial position 6.41 The financial performance of the NBFCs-NDSI sector improved as reflected in an increase in their net profit during 2012-13 (Table VI.37). Net profit as a per cent to total income as also to total assets increased marginally during the year. 6.42 While the ratio of gross NPAs of NBFCs-NDSI to their total assets had increased marginally, the net NPAs to total assets declined during the year (Table VI.38).
6.43 As at end-March 2013, a majority of the reporting companies maintained the stipulated minimum norm of 15 per cent capital adequacy as measured by CRAR. Only 12 per cent of the total reporting companies had a CRAR of less than 15 per cent and almost all of them were either investment companies or loan companies (Table VI.39). NBFCs-ND-SI have adequate scope to utilise their capital for further expansion. The exposure of the banking system to the NBFCs-NDSI sector was largely in the form of term and working capital loans; and most of these loans were extended by nationalised banks and the State Bank Group (Table VI.40). Debentures and commercial papers floated by NBFCs-ND-SI to the banking sector were, by and large, subscribed to by new private banks and foreign banks, respectively. 6.44 In the past few years, there has been a surge in gold loans in the country. While banks still dominate the business of lending against the collateral of gold, there has been a significant rise in lending against gold by NBFCs-ND-SI in recent years. The number of NBFCs-ND-SI engaged in the gold loan business also increased from six to eight during the year. In view of concerns relating to financial stability due to heavy concentration of portfolio, prudential guidelines were issued to such NBFCs-ND-SI (gold-loan NBFCs) so that they disclosed the percentage of gold loans to the total assets in their balance sheet and maintained a loan-to-value (LTV) ratio not exceeding 60 per cent. Further, to address customer grievances and concerns, NBFCs were also asked to adhere to a revised fair practices code (Box VI.2).
Box VI.2: In recent years, gold-loan NBFCs have recorded significant growth, both in terms of the size of their balance sheets and geographic penetration across the country. As at end- March 2013, gold-loan NBFCs accounted for almost 5 per cent of the total assets of the NBFCs-ND-SI sector, and around 28.6 per cent of the total assets of loan companies (LCs). To fuel their business growth, these NBFCs, in turn, relied heavily on public funds raised through bank borrowings and issuance of non-convertible debentures to retail investors. The “single product” business model such as gold-loan NBFCs’ high reliance on bank funds entail concentration risk (arising from credit, market, liquidity and operational risks) and systemic concern. Accordingly, a Working Group was set up by the RBI to study issues related to gold imports and review extant regulatory norms relating to gold loans and recommend modifications, if any (Chairman: Shri K.U.B. Rao). The Working Group submitted its final report along with recommendations on February 6, 2013. To address some of the concerns relating to financial stability, the segment of gold-loan NBFCs was advised to maintain a loan-to-value (LTV) ratio not exceeding 60 per cent and disclose the percentage of such loans to their total assets in their balance sheets. If the loans extended by an NBFC comprised 50 per cent or more of its financial assets, it would maintain a minimum Tier l capital of 12 per cent by April 01, 2014. Further, all NBFCs were instructed not to lend against bullion/primary gold and gold coins. Drawing from some of the recommendations of the aforesaid Working Group, the extant guidelines issued on Fair Practices Code for such NBFCs were amended and revised guidelines were issued on February 18, 2013. Accordingly, such NBFCs should put in place a grievance redressal mechanism with due approval from their respective boards and the name of the grievance redressal officer should be displayed prominently at all branches. Such NBFCs were also advised to display the Fair Practices Code prominently in vernacular languages. Further, they were instructed to maintain transparency in loan pricing and follow KYC norms. NBFCs have also been exhorted to put in place adequate security and insurance on gold collateral and have a board-approved auction policy in place. They have been advised to disclose details regarding the auction procedure in the loan agreement itself and not to participate in their auctions. Further, in May 2013, it was clarified that no advances should be granted by NBFCs for purchase of gold in any form, including primary gold, gold bullion, gold jewellery, gold coins, units of gold Exchange Traded Funds (ETF) and units of gold Mutual Funds. The guidelines were further refined on September 16, 2013. Accordingly, to ensure safety of gold and borrowers’ convenience, gold-loan NBFCs have been advised to put in place an appropriate safe and secure infrastructure for storage of gold ornaments accepted as collaterals by them. The gold-loan NBFCs that wish to open branches in excess of 1000 numbers have been mandated to seek prior approval from the Reserve Bank. No new branches would be allowed to be opened unless suitable arrangements for security and storage of gold jewellery, including safe deposit vault, is made. For eschewing arbitrariness and to ensure transparency in valuing gold jewelleries, NBFCs are required to follow a standard method for arriving at the value. Accordingly, the gold jewellery accepted as collateral will have to be valued at the average of the closing price of 22 carat gold for the preceding 30 days quoted by the Bombay Bullion Association Ltd. Furthermore, while accepting gold as collateral, the NBFC should give a certificate to the borrower on its letterhead mentioning the purity and weight of collateralised gold. The gold-loan NBFCs have also been asked to put in place Board approved policies to satisfy the ownership of the gold jewellery and ensure that KYC norms are followed. Further refinement in the auction process has been advised. NBFCs have been advised to disburse high value loan (`1 lakh and above) through cheques. They have been proscribed from issuing misleading advertisements like claiming the availability of loans in a matter of 2-3 minutes. Furthermore, NBFCs lending against the collateral of gold have been exhorted to insist on a copy of Pan card of the borrower for all transactions above `5 lakhs. Such NBFCs have also been asked to standardise the documentation across all their branches. 4. Primary Dealers 6.45 As at end-June 2013, there were 21 Primary Dealers (PDs) operating in financial markets, of which 13 were run by banks and were called as bank-PDs and the remaining eight were non-bank entities, which are known as standalone PDs and registered as NBFCs under Section 45 IA of the RBI Act, 1934. Operations and Performance of PDs 6.46 During 2012-13, the bid-to-cover ratio in both dated Government of India (GoI) securities and treasury bills of PDs were marginally higher than they were in the previous year. All the PDs achieved the stipulated minimum success ratio (bids accepted to the bidding commitment) of 40 per cent for treasury bills (T-Bills) and cash management bills (CMBs) put together, both in the first and second half of the year. As compared to last year, the success ratio in T-Bill auctions was marginally higher (Table VI.41). 6.47 During 2012-13, dated securities worth `5,580 billion were issued under the GoI’s normal market borrowing programme as compared to the issuance of ` 5,100 billion in the previous year. In the auctions of dated securities, the share of PDs (bids accepted to the securities issued) increased from 47.7 per cent in 2011-12 to 51.1 per cent in 2012-13. As compared to 14 instances of partial devolvement for `121.1 billion on the PDs in 2011- 12, there were only two such instances for `18.3 billion during 2012-13, which reflected favourable bond market conditions during the year.
Performance of Standalone PDs Share of trading activity of PDs in the secondary market shrank 6.48 In the secondary market, PDs individually achieved the required minimum annual total turnover2 (outright and repo transactions) ratio of 5 times in G-Secs and 10 times in T-Bills. PDs also achieved the minimum annual outright turnover ratio of 3 times in G-Secs and 6 times in T-Bills. Notwithstanding a higher turnover in the secondary G-Sec market during 2012-13, the share of standalone PDs in the total market volume shrank on account of an increase in trading activities of other financial entities such as banks and insurance companies. The share of standalone PDs declined, from 26.3 to 16.4 per cent in outright transactions and from 20.3 to 19.2 per cent in repo transactions, respectively during the year (Table VI.42). Sources and Application of Funds of Standalone PDs Investment by PDs in CPs, the corporate bond market and equities increased significantly 6.49 Though the capital of PDs declined by 2.2 per cent in 2012-13, it was more than compensated by a sharp rise in reserves and surplus resulting in an increase in the net owned funds (NOF) to the tune of 5.8 per cent. Borrowings remained the major source of funds, accounting for 84 per cent of the total funds. Both secured and unsecured loans availed by PDs increased but their growth remained lower than that of the preceding year. As per their application of funds, there was a significant increase in investments in commercial papers (CPs), bonds and equities (Table VI.43). Financial Performance of Standalone PDs Sharp increase in income led to an increase in profit 6.50 The profit after tax of standalone PDs showed a significant increase of 146 per cent during 2012- 13 on account of huge growth in trading profits on the back of declining interest rate scenario for the later part of 2012-13 (Table VI.44). Mirroring the improvement in PAT, the return on net worth (RoNW) and the return on average assets (RoAA) also showed a healthy rise (Table VI.45). Reflecting the increased efficiency of PDs, cost to income ratio for PDs declined from 44.1 in 2011-12 to 27.2 in 2012-13.
6.51 There was a significant rise in the holding of risk-weighted assets by PDs, which more than outweighed the modest rise in their net capital funds. This resulted in a decline in their CRAR from 53.8 per cent (as at end-March 2012) to 39.4 per cent (as at end-March 2013) (Table VI.46). The ratio, however, was comfortably above the regulatory stipulation of 15 per cent for all standalone PDs.
5. Overall Assessment 6.52 The non-banking financial sector as a whole witnessed a significant expansion in its balance sheet; though there was consolidation as some companies exited and migrated to other business models. The net profits of FIs and NBFCs also increased during 2012-13. The overall asset quality of a large part of the NBFI sector deteriorated during the year, partly reflecting a slowdown in the overall economy. With regard to capital adequacy, the entire NBFI sector was comfortably placed. The net profit of standalone PDs showed a significant increase. Regulatory interventions for the sector were guided by concerns relating to financial stability as also for promoting healthy growth of the sector. Besides issuing public notices, the Reserve Bank has been carrying out outreach and sensitisation programmes, cautioning the general public not to fall prey to fictitious offers by individuals, unincorporated bodies and companies promising unsustainable returns. 1 L3= NM3 + Postal Deposits + Term Money Borrowings + Certificates of Deposit + Term Deposits + Public Deposits with NBFCs. 2 Turnover ratio is computed as the ratio of total purchases and sales during the year in the secondary market to average month-end stocks. |
|||||||||||||||||||||||||||||||||||||||||||||||||||||||||||||||||||||||||||||||||||||||||||||||||||||||||||||||||||||||||||||||||||||||||||||||||||||||||||||||||||||||||||||||||||||||||||||||||||||||||||||||||||||||||||||||||||||||||||||||||||||||||||||||||||||||||||||||||||||||||||||||||||||||||||||||||||||||||||||||||||||||||||||||||||||||||||||||||||||||||||||||||||||||||||||||||||||||||||||||||||||||||||||||||||||||||||||||||||||||||||||||||||||||||||||||||||||||||||||||||||||||||||||||||||||||||||||||||||||||||||||||||||||||||||||||||||||||||||||||||||||||||||||||||||||||||||||||||||||||||||||||||||||||||||||||||||||||||||||||||||||||||||||||||||||||||||||||||||||||||||||||||||||||||||||||||||||||||||||||||||||||||||||||||||||||||||||||||||||||||||||||||||||||||||||||||||||||||||||||||||||||||||||||||||||||||||||||||||||||||||||||||||||||||||||||||||||||||||||||||||||||||||||||||||||||||||||||||||||||||||||||||||||||||||||||||||||||||||||||||||||||||||||||||||||||||||||||||||||||


এই পৃষ্ঠাটো শ্বেয়াৰ কৰক:


ভাৰতীয় ৰিজাৰ্ভ বেংক মোবাইল এপ্পলিকেষ্যন ইনষ্টল কৰক আৰু নৱীনতম বাতৰিৰ প্ৰৱেশাধিকাৰ পাওক!
আমাৰ এপটো ইনষ্টল কৰিবলৈ QR ক’ড স্কেন কৰক


পৃষ্ঠাটো শেহতীয়া আপডেট কৰা তাৰিখ:


