
28. Group - Wise Index Numbers of Industrial Production (Base : 2004-05=100) - আৰবিআই - Reserve Bank of India


28. Group - Wise Index Numbers of Industrial Production (Base : 2004-05=100)
(Base: 2004-05=100) |
|||||||||
Sr. No. |
Industry |
Weight |
Annual |
Cumulative |
Monthly |
||||
2009-10 |
2010-11 |
2011-12 P |
April-August |
August |
|||||
2011-12 |
2012-13 P |
2011 |
2012 P |
||||||
1 |
2 |
3 |
4 |
5 |
6 |
7 |
8 |
||
General Index |
100.00 |
152.9 |
165.5 |
170.3 |
166.5 |
167.1 |
161.4 |
165.7 |
|
I. |
Sectoral Classification |
||||||||
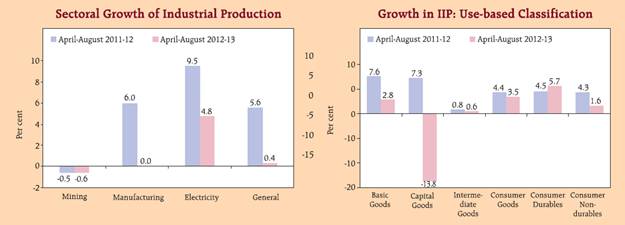
1. |
Mining and Quarrying |
14.16 |
124.5 |
131.0 |
128.5 |
124.4 |
123.6 |
115.0 |
117.3 |
2. |
Manufacturing |
75.53 |
161.3 |
175.7 |
181.0 |
176.7 |
176.7 |
171.7 |
176.6 |
3. |
Electricity |
10.32 |
130.8 |
138.0 |
149.3 |
149.0 |
156.1 |
149.4 |
152.2 |
II. |
Use-Based Classification |
||||||||
1. |
Basic Goods |
45.68 |
134.1 |
142.2 |
150.0 |
146.9 |
151.0 |
144.7 |
148.7 |
2. |
Capital Goods |
8.83 |
243.0 |
278.9 |
267.8 |
269.7 |
232.6 |
261.6 |
257.1 |
3. |
Intermediate Goods |
15.69 |
135.3 |
145.3 |
144.4 |
144.2 |
145.0 |
142.6 |
145.3 |
4. |
Consumer Goods |
29.81 |
164.3 |
178.3 |
186.1 |
177.7 |
183.9 |
167.2 |
175.5 |
4(a). |
Consumer Durables |
8.46 |
252.0 |
287.7 |
295.1 |
287.5 |
303.9 |
278.0 |
289.0 |
4(b). |
Consumer Non-Durables |
21.35 |
129.5 |
135.0 |
142.9 |
134.2 |
136.3 |
123.3 |
130.5 |
P: Provisional. |
|||||||||

এই পৃষ্ঠাটো শ্বেয়াৰ কৰক:


ভাৰতীয় ৰিজাৰ্ভ বেংক মোবাইল এপ্পলিকেষ্যন ইনষ্টল কৰক আৰু নৱীনতম বাতৰিৰ প্ৰৱেশাধিকাৰ পাওক!


