 IST,
IST,


Capital Flows at Risk: India’s Experience
With the spate of emerging market crises since the 1990s and the experience with the global financial crisis and its aftermath, attention has turned from the benefits associated with capital flows to their consequences such as accentuating financial vulnerabilities, aggravating macroeconomic instability and spreading contagion. For India, portfolio flows are the most sensitive to shifts in risk sentiment globally and spillovers. Applying a capital flows at risk approach, it is observed that in an adverse scenario, potential portfolio outflows can average up to 3.2 per cent of GDP. In a black swan event comprising a combination of shocks, potential portfolio outflows can rise to 7.7 per cent of GDP, highlighting the need for maintaining liquid reserves to quell such potential bouts of instability. Since the 1980s when emerging and developing economies opened their borders either as suo moto efforts to integrate into the global economy or as integral elements of structural adjustment programs of the Bretton Woods institutions, the various benefits associated with capital flows for host economies have been documented1. With the spate of emerging market crises since the 1990s, and the experience with the global financial crisis (GFC) and its aftermath, however, the narrative has shifted on the back of surges of capital flows, sudden stops and reversals. Attention has turned to their macroeconomic consequences such as amplifying economic cycles, accentuating financial system vulnerabilities, aggravating overall macroeconomic instability and spreading contagion (Forbes and Warnock, 2012). Within this now proliferating literature, the focus is on gross capital flows which have undergone dramatic changes in size and volatility; analyses based on net flows can miss these features as also the sources of volatility, i.e., whether driven by push (foreign) or pull (domestic) factors and interactions, drawing on seminal work on the subject (Calvo et al., 1993; Fernandez-Arias, 1996). The broad consensus emerging from these analyses is that waves of capital flows are primarily associated with global factors – global risk; economic uncertainty; global growth; interest rates; trade and financial linkages. More recently, oil prices appear to be playing a larger role, especially with tighter macro-prudential regulations, a reduced share of bank flows in total capital flows and slower growth in advanced economies (Forbes and Warnock, 2012). Push factors are found to matter most for portfolio debt and equity flows. Global risk aversion and interest rates in advanced economies have a strong adverse effect on banking flows (Koepke, 2019). Global risk aversion came into play again with the onset of the COVID-19 pandemic, causing a reallocation of investment portfolios away from emerging market economies (EMEs) and a financial shock to these countries. The negative response of debt flows, in particular, is found to be large and statistically significant while idiosyncratic factors play a relatively less important role (Alba et al., 2021). In contrast, domestic factors – which dominate the theoretical literature - are generally not found to be as prominent, although domestic growth, country vulnerability and domestic asset returns do matter (Bruno and Shin, 2015). This suggests that financial openness can be a double-edged sword – a fifth of all surges in capital flows to EMEs have ended in financial crises, and EMEs are at least three times more likely to experience a financial crisis after these cascades than in normal times (Carney, 2019). With this evidence of capital surges and retrenchments being driven by global factors over which they have no control, policy authorities in host countries have sought to strengthen their ability to withstand capital flow volatility rather than reduce it. This has motivated EMEs to accumulate reserves and/or limit the access to their financial accounts, including by resorting to capital controls which have left their external balance sheets only a third the size of those of advanced economies, despite much faster growth in trade (Carney, 2019). This paper draws on recent developments in the ‘capital flows at risk’ framework. It estimates the entire distribution of capital flows conditional upon various pull and push factors. By doing so, it takes into account volatility and higher moments of the distribution so as to assess the effect of a range of risk factors across different parts of the distributions at different horizons2 (Eguren Martin et al., 2021; Gelos et al., 2021). The objective is to understand the following issues: what drives capital flow volatility in the Indian context so that appropriate policy responses can be fashioned? Can we quantify the tail risks to these capital flows and hence fashion appropriate measures to shield the economy from such shocks? Our findings suggest that growth differentials and domestic term premia are the predominant pull factors attracting capital flows to India while global risk aversion is the main push factor driving capital outflows. Portfolio flows are most sensitive to shifts in risk sentiment globally and consequent spillovers – there is a 5 per cent chance of portfolio investments amounting to 3.2 per cent of GDP flowing out from India in response to a historical shock to any individual determinant. When shocks to all determinants are combined to simulate an extreme risk scenario, the size of portfolio outflows rises to 7.7 per cent of GDP. The rest of the paper is organised into four sections. The next section presents stylised facts on gross capital flows to EMEs and India, their composition and key drivers. Section III sets out the methodological framework for evaluating capital flows at risk. Section IV presents the main results and Section V concludes the paper with some perspectives on the policy questions we pose here. In this section, the strategy is to present the historical profile of capital flows to EMEs and then turn to the Indian experience. The objective is to provide analytical foundations to the view that is broadly endorsed in this part of the world, capital flows can have a destabilising influence on macroeconomic and financial fundamentals in the short run although they may deliver the benefits that have been associated with them in the literature over the medium-term. Capital flows to EMEs experienced a remarkable upshift after 2002 to reach a peak of 11 per cent of GDP in 2007, driven by improvements in their macroeconomic fundamentals and institutional frameworks, deepening and growing sophistication of host financial markets and the rising tide of integration into the global economy to harness new engines of growth (Chart 1). The GFC imposed a sharp retrenchment but in its aftermath, surges of capital flows to EMEs resumed in a broad-based rebound with a peak in 2009, rekindling the debate about the boom-bust nature of these flows and associated macroeconomic challenges and financial stability concerns (Ghosh et al., 2012). By the second half of 2011, amidst a worsening global economic outlook and following the U.S. sovereign debt rating downgrade in early August 2011, capital flows receded rapidly, eliminating much of the cumulated currency gains of the pre-GFC period and leaving EMEs grappling with sharply depreciating currencies. Although they resumed and peaked again in 2012, inflows to EMEs were the most affected by the “taper tantrum” of May 2013, with a marked slowdown in gross inflows and an increase in gross outflows until 2015. 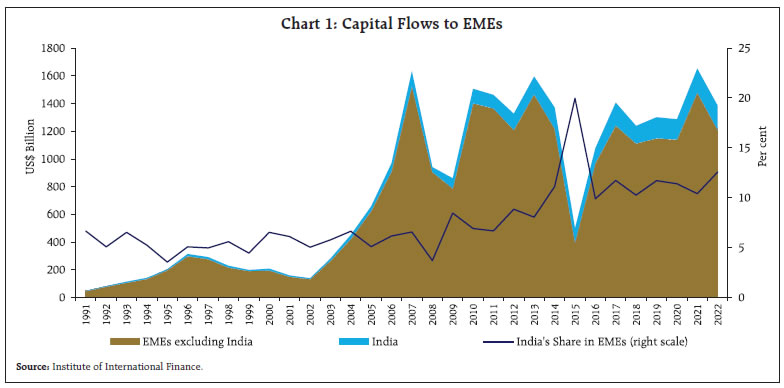 Since early 2016, capital flows returned to EMEs and rose to another peak in 2016 - albeit modest in comparison with 2007 and 2009 – followed by some moderation during 2017-19. This period coincided with a slowdown in major EMEs, a steep fall in oil and other commodity prices and a strong appreciation of the US dollar that impacted dollar-denominated debt in several EMEs. Commodity exporters, in particular, experienced strong capital outflows and currency depreciations. Capital flows in these years were characterised by lower portfolio investment and a reduction in other investments – mainly bank loans - while foreign direct investment (FDI) was relatively unaffected. The outbreak of the Covid-19 pandemic triggered a sharp reversal of capital flows to EMEs and some advanced economies (AEs) in March 2020. Yet, inflows to EMEs recovered starting from April 2020, boosted by monetary policy easing in major AEs. The initial rebound in portfolio flows was heterogeneous along several dimensions. First, investors were more selective, differentiating on the basis of economic vulnerabilities, policy frameworks and the extent to which the pandemic had been brought under control. Second, the pace of recovery in debt inflows was initially faster than in equity inflows. Third, flows into local currency bond funds were initially subdued, owing to concerns about weak EME currencies, availability of future fiscal space and central banks’ policy stance (Arslanalp et al., 2020). Heterogeneity decreased in late 2020, when flows into equities and local currency funds picked up substantially across many EMEs. In 2021, a rise in US long-term yields preceded capital outflows from many EMEs in March of that year, although shifts were more moderate than during the “taper tantrum”. This was followed by a recovery from April until the war in Ukraine forced a disruption, followed by continuing outflows, currency depreciations and reserve drains. Turning to the composition of capital flows to EMEs, FDI has made up about half, while the other half is roughly evenly split between portfolio inflows and other investments (Chart 2). Portfolio inflows have increased in the post-GFC period when compared with the period before the GFC, led by investments in EME bond markets. In the years following the taper tantrum, portfolio equity flows ebbed to levels much lower than in the years preceding it. This is true in relation to debt portfolio flows as well. The decrease in gross inflows in 2015-19 was also mainly driven by lower portfolio investment. Other investment is the volatile component across all past major downturns. One of the most salient changes during the post-GFC period has been a retrenchment of cross-border bank lending, driven in large part by the deleveraging of AE banks, particularly those headquartered in the euro area. Nevertheless, banks remain the dominant source of funding. Cross-border bank loans declined as a share of external debt between 2008 and 2012 and have fluctuated around 45 per cent since then (López and Stracca, 2021). Notably, even while reducing their cross-border lending, banks continue to invest in portfolio debt, but they are being replaced as intermediaries by market-based flows driven by asset managers, investment funds and other non-bank financial intermediaries (Lane and Milesi-Ferretti, 2017; López and Stracca, 2021). Since the GFC, public sector borrowers have accounted for a growing share of total debt securities issuance in many EMEs and at the global level (Lane and Milesi- Ferretti, 2017). On average, over the 2009-19 period, 38 per cent of total capital inflows to EMEs and more than half of portfolio inflows could be attributed to the public sector (López and Stracca, 2021). Capital flows to India have behaved in ways similar to the rest of EMEs (Chart 3). The first surges, however, predated the 2002 EME watershed and can be traced back to the early 1990s when trade and financial liberalization was undertaken as an integral element of macroeconomic adjustment and structural reforms. Also similar to the EME experience, India has undergone five major episodes of sudden stops and reversals – the GFC; the taper tantrum; 2018; the onset of the pandemic; and the current phase that prevails in the train of the war in Ukraine. 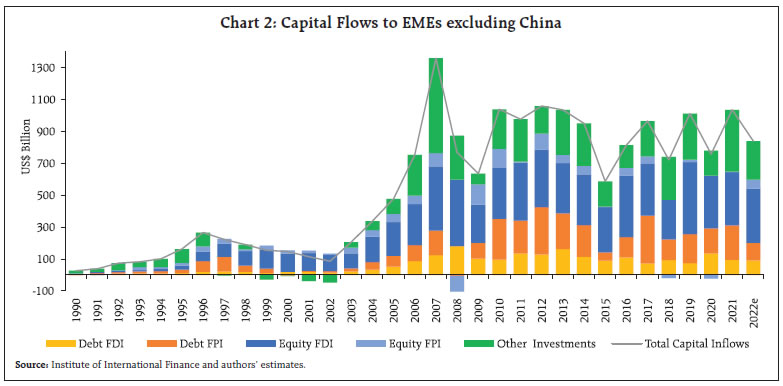 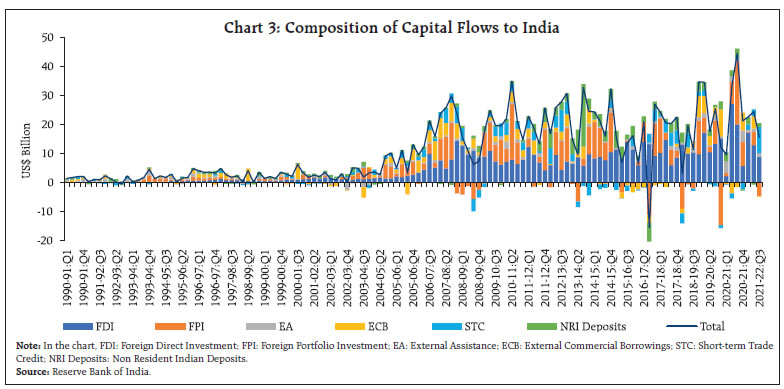 Tracking the performance of other EMEs, capital flows began to rise from the first quarter of 2003 as the Indian economy emerged from a slowdown. With accommodative monetary policies in advanced economies operating as a push factor, an acceleration started building up from the third quarter of 2004, taking capital flows to India to a peak in the last quarter of 2007 before being overwhelmed by the GFC. In the post-GFC period, capital flows resumed, analogous to the broader EME experience. The turnaround in capital flows can be dated to the second quarter of 2009. An acceleration similar to the pre-GFC phenomenon was experienced, but this surge was short-lived and it crested in the third quarter of 2010 as monetary policy was tightened to counter elevated inflation pressures, and the ongoing debt crisis in Europe triggered a flight to safety. As real GDP growth started decelerating during 2011-2012, capital flows turned volatile and a generalised risk aversion set in amidst the US downgrade and slowing global growth. Ahead of the taper tantrum in the second quarter of 2013, India faced a large external financing requirement brought on by a burgeoning current account deficit and deteriorating macro-fundamentals. Consequently, when risk-off sentiments became pervasive with taper talk, capital flows receded swiftly from India and plunged it into the infamous group of the fragile five. In response to monetary policy and liquidity tightening, restrictions on gold imports and raising of exceptional financing from abroad, capital flows returned cautiously to India by the second half of 2013 but remained subdued and volatile up to the first quarter of 2018, with intermittent outflows. Real GDP growth in India slid down to a five-year low in 2018-19. Investment slowed as did sales growth among non-financial corporations, with private consumption also losing pace. Export growth decelerated and non-oil and non-gold imports went into contraction. Global spillovers and the tightening of financial conditions herded investors to safe havens, shunning EMEs as an asset class, with India experiencing portfolio outflows. Global risks ebbed in the first quarter of 2019 and improved market sentiment rejuvenated the appetite for risk, bringing back portfolio flows to India. Capital flows remained strong through the rest of 2019. Even after the onset of the pandemic in early 2020 when EMEs generally faced outflows, India remained a host for capital inflows, including portfolio investment, throughout the year and into the next. Since the start of 2022, however, the combination of synchronised monetary policy tightening and the war in Ukraine has caused outflows and even FDI has ebbed. The pattern and composition of capital inflows to India have remained broadly stable. FDI accounted for more than half, followed by portfolio flows with a share of 30 per cent in which equity and debt account for 60 per cent and 40 per cent, respectively. Portfolio flows have turned out to be the most volatile component, moving in tandem with portfolio flows to the EMEs, ranging from surges that took their share in total flows to a high of 55 per cent to outflows of US $ 14.7 billion or 2 per cent of GDP during capital flow reversals (Chart 4). Equity flows have tended to be more volatile than debt flows and associated with large outflows during the GFC, the taper tantrum, the US presidential election of 2016 and COVID-19. Debt flows turned negative with the onset of the pandemic. The tapering announcement by the US Fed in May 2013 led to heavy outflows by foreign portfolio investors from both equity and debt markets, and especially from the debt segment. Similarly, global risk aversion driven by the outcome of the US presidential elections and expectations of an increase in the Federal funds rate culminated in intense selling pressure in equity and debt segments from November 2016 through January 2017. While inflows under non-resident Indian (NRI) deposits provide a cushion by offsetting the impact of large outflows in other accounts, a lumpy redemption of FCNR (B) deposits raised by banks under the Reserve Bank’s special swap window from September to November 2013 imparted some volatility. Loans under external commercial borrowing (ECB) account for another source of capital inflows into India. These flows have remained broadly stable as approvals are regulated under an overall ceiling and individual loans are subject to end-use and all-in-cost stipulations. Like portfolio flows, short-term trade credit is another volatile component in capital inflows into India and co-moves with India’s imports. 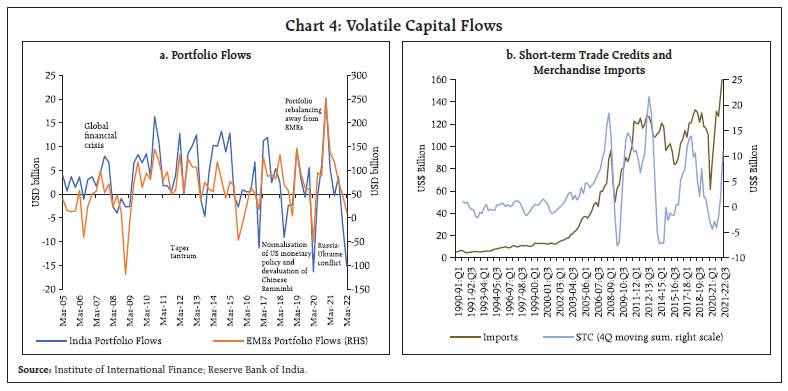 As the preceding section showed, EMEs in general and India in our specific case, are vulnerable to both surges of capital inflows and episodes of outflows, with associated policy challenges in terms of managing the macroeconomic and financial consequences. While EMEs have fashioned responses to inflow booms by employing a combination of monetary and fiscal policies, macroprudential tools and capital flow management measures, capital outflows are more daunting to deal with as they can lead to tightening of financial conditions and instability, with contractionary effects on growth. In this context, policy authorities have found it useful to ascertain the magnitude of expected capital outflows at various probabilities in response to specific shocks. This has been termed as the capital flows at risk (CaR) approach (Gelos et al., 2021). Drawing on the financial risk management literature, CaR takes a forward-looking perspective on risks to capital flows by asking what global and domestic conditions today can tell us about the probability and the size of future capital flows. In this framework, first, a link between different quantiles3 of capital flows and their drivers is established by using a quantile regression4 to predict capital flows for various quantiles. In the second step, the predicted capital flows are used to obtain the empirical distribution of future capital flows. The risks to capital flows are then quantified by estimating the size of outflows for a given probability (i.e., usually at 5 per cent) from the empirical distribution. Alternatively, one can also compute the probability for the magnitude of capital outflows, based on the empirical distribution. Formally, quantile regression can be represented as: 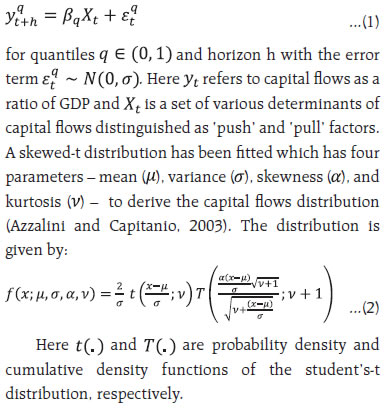 Drawing on the extensive literature on capital flows and “pull” and “push” factors (Koepke, 2019), changes in global uncertainty, as captured in the VIX of the Chicago Board Options Exchange (CBOE), affect the risk appetite of international investors which, in turn, results in sudden movements in capital flows as observed vividly during the GFC, the European debt crisis and COVID-19. Movements in the VIX are closely associated with the volatility of foreign portfolio investment (FPI) flows to and from India (Chart 5). We also observe an inverse association between capital flows and VIX, indicating high risk aversion of international investors during periods of uncertainty. Other forms of capital inflows like FDI and ECBs are driven mainly by attractive returns in India relative to the rest of the world, which we attempt to capture through India’s growth relative to the US (Chart 6). This is a hybrid push-pull variable which economises on degrees of freedom lost that is acute in quantile regressions. 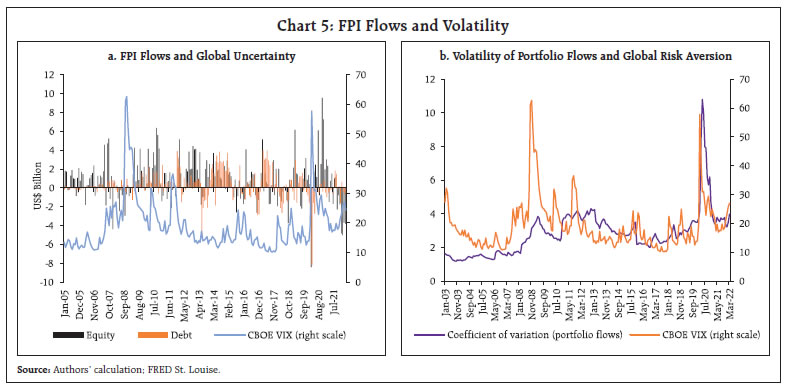 Ultra-accommodative monetary policies and ultra-low interest rates in AEs have been extensively studied in the literature as a powerful push factor driving capital flows to EMEs, especially in the post-GFC years. Again, we employ a hybrid variable – interest rate differential between India and the US – and find a strong positive association with capital flows (Chart 7). 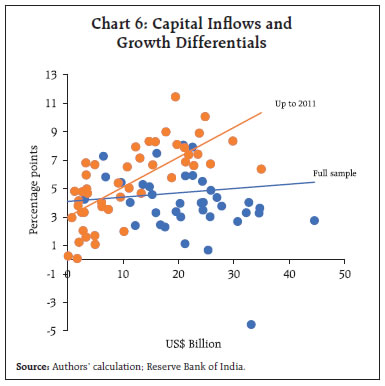 The shifts in macroeconomic risks as reflected in term premia (i.e., the difference between yields on government securities of 10-year and 3-month maturities) are found to be correlated negatively with capital inflows to India (Chart 8). We use quarterly data from 2004:Q2 to 2021:Q1 so as to cover the episodes of capital outflows discussed in Section II. Two measures of gross capital inflows (net of redemptions) have been considered - FPI flows to India and gross capital inflows comprising FDI, FPI, external assistance, external commercial borrowings, short-term trade credit, net international liabilities of commercial banks, and other capital flows to India. Like FPI flows, short-term trade credit to India is also found to be volatile and therefore, we have also estimated a CaR exclusively focused on the latter. 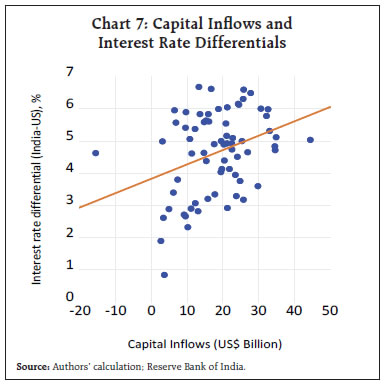 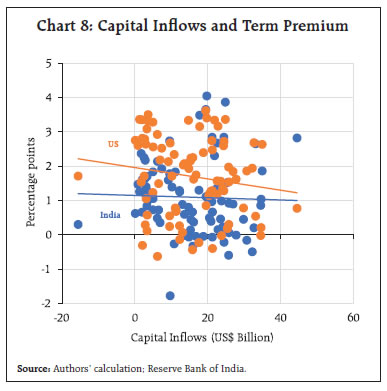 The unconditional distribution of capital inflows to India is positively skewed, reflecting that in the net there are more frequent episodes of inflows rather than outflows, with left tail risks5 associated with FPI being greater relative to overall capital inflows (Table 1). The results of the quantile regression at (1) in Section 3 are statistically satisfactory. Growth differentials and the term premium in India turn out to be the most influential variables in determining capital flows to India, indicating the predominance of pull factors (Chart 9). The coefficients on these variables are lower in size or statistically insignificant for the left quantiles, indicating a weakening of pull factors in attracting capital inflows in the face of uncertainty. These results hold across aggregate flows and portfolio investment. Interest rate differentials are found to be statistically insignificant, although a rise in US yields by itself is generally associated with portfolio outflows. The US term spread is statistically insignificant, but the sensitivity towards the left tail is high, implying that a rise in macro risks in the US pushes capital flows to India. VIX is found to be negative and statistically significant only in the case of portfolio flows, reinforcing the role of risk aversion. Overall, the quantile regression results suggest that the responsiveness of capital flows in the tails is high relative to the centre of distribution, making a case for estimating the size of expected capital outflows in the case of an adverse event.6 The predicted capital flows of lower and higher quantiles show the dynamics of CaR over time (Chart 10). The estimated tail risks (CaR at 5 per cent) to capital flows are found to be high and they match with the actual capital outflows during the GFC and the taper tantrum. On the other hand, the 5th quantile estimate fails to capture the pandemic experience in respect of portfolio flows but the CaR for the 95th quantile drops to 0.7 per cent of GDP from 3.7 per cent, indicating a lower probability of getting capital inflows during the pandemic. The CaR of overall capital flows drops from -0.5 per cent of GDP to -2.4 per cent of GDP during the Covid-19 phase, a historically high value. In fact, the data point to a fall in the otherwise stable FDI during this period. 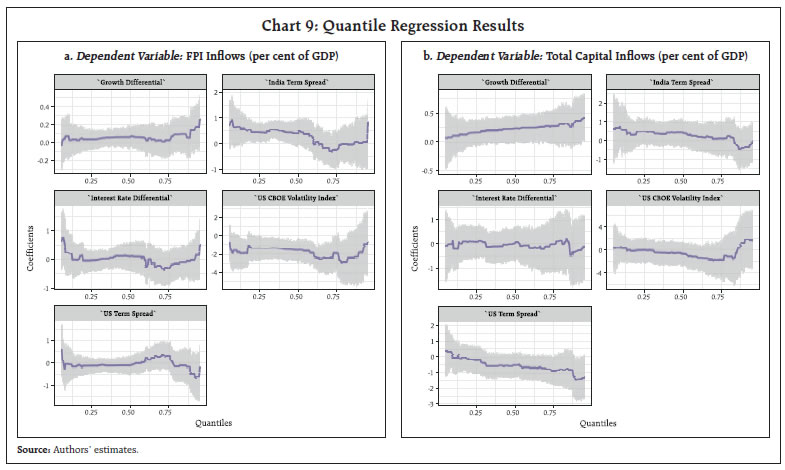 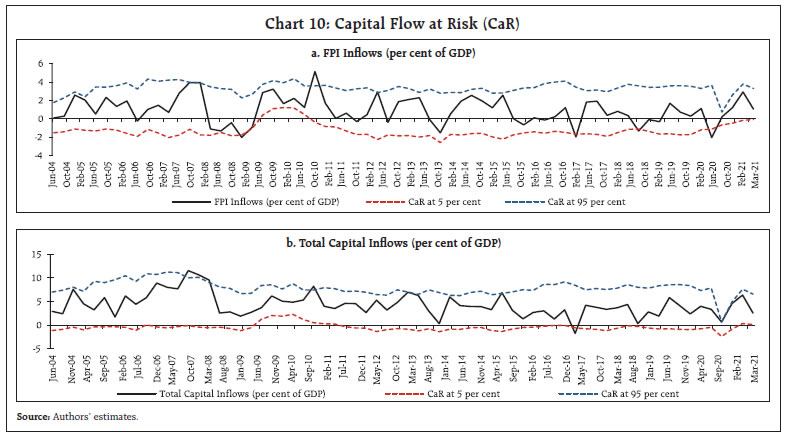 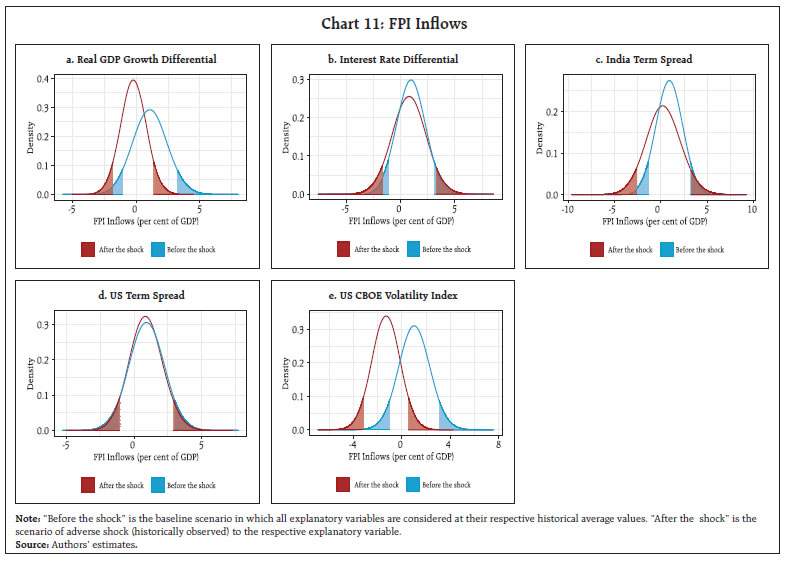 A comparison of the distributions of predicted capital flows (baseline or before shock) and predicted capital flows with shocks (equivalent to extreme historical values) to the push and pull factors - one at a time - reveals that VIX is the primary factor for tail risks to FPI flows while growth differentials and the US’s term spread are major upside risks to overall capital inflows (Charts 11 and 12). A higher positive growth differential increases the likelihood of capital flows to India, while an inverted yield curve as observed during the taper tantrum period could enhance the risk of extreme capital outflows, particularly in the case of portfolio flows, which have a greater sensitivity to volatility represented by the VIX than other flows. With these inputs, it is possible to estimate the expected value of capital outflows below the 5th quantile in the face of black swan events7. This estimate becomes relevant from a policy perspective in order to plan buffers and countervailing actions. The expected capital outflows are estimated as:  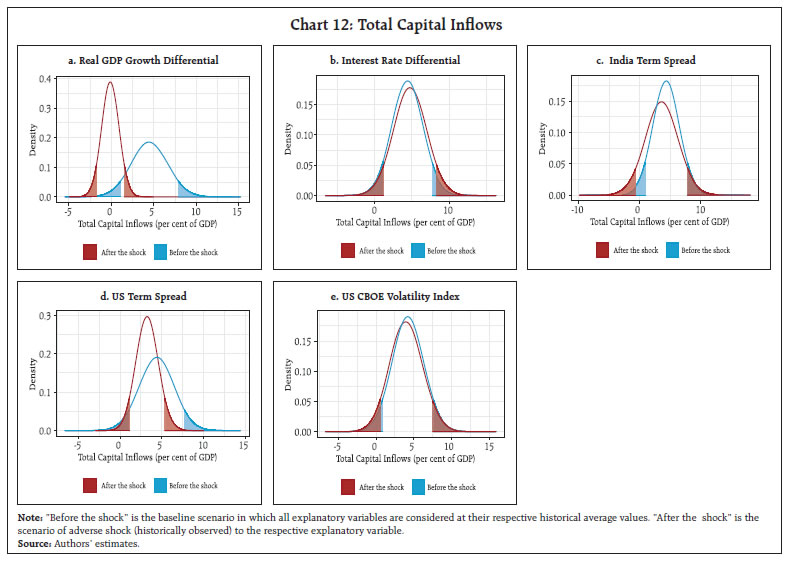 In response to shocks to each of the determinants of a size that is at least equal to what has been observed in the historical experience, potential portfolio outflows can be in the range of 2.6 to 3.6 per cent of GDP, averaging to 3.2 per cent of GDP (or US$ 100.6 billion in a year) (Table 2). A black swan event could be characterised by a combination of all adverse shocks experienced in Indian history coming together, leading to a perfect storm. Expected portfolio outflows at 5 per cent probability could be of the order of 7.7 per cent of GDP and expected outflows under short-term trade credits could amount 3.9 per cent of GDP (Table 3). The magnitude of outflows could be even higher when CaR is measured at 0.1 per cent probability (highly unlikely). These results show that the entire stock of portfolio investments could exit India in this extreme adverse scenario. In the face of an extreme event, other forms of capital flow considered as stable flows may also exit. As mentioned earlier, another approach for measuring tail risks to capital flows is to calculate the probability of capital flows falling below a certain threshold, say below zero. We have estimated the probability of capital outflows during an extreme event vis-a-vis the baseline scenario. The probability of outflows is found to be high during extreme adverse events (Table 4). Even as EMEs have opened up their borders to international capital movements to exploit the well-documented benefits associated with these flows, they have become vulnerable to large swings, with attendant volatility, shocks and crises. With no multilateral safety net in place, EMEs are literally on their own in defending their economies from these vicissitudes. In this context, the estimates from a capital flows at risk (CaR) approach applied to Indian conditions provide proximate answers to the questions we posed to ourselves in the introductory section. Our findings suggest the predominant role of pull factors in attracting capital flows to India, key among them being growth differentials and domestic term premia. On the other hand, it is global risk aversion, reflected in the VIX, that drives capital outflows. Portfolio flows are the most sensitive to shifts in global risk sentiment. The country experience, including India’s, does not offer any quantifiable guideposts for the pace and extent of liberalisation of the financial account of the balance of payments. It is largely a function of crossing the river by feeling the pebbles. Even so, the observed volatility of international capital flows can be overwhelming for individual EMEs, especially with the growing importance of passive flows driven by funds, asset managers and index pursuit. This brings us to the challenge that EMEs – the so-called bystanders that stand alone – face in mitigating the instability that globally mobile capital flows bring. Clearly, Bretton Woods type prescriptions such as tightening of monetary and fiscal policies, exchange rate adjustments and structural reforms in some kind of pecking order as a hierarchy will not work. All instruments, including prudential and other capital flow measures, are an integral part of the playbook, and often the measures of the first resort. In the ultimate analysis, spillovers can be global but the responsibility for macroeconomic and financial stability is national. This focuses attention on the role of international reserve accumulation as the only reliable safety net. Obviously, adequacy becomes the key consideration and this is an empirical, country-specific issue. Our results indicate that there is a 5 per cent chance of portfolio outflows from India of the order of 3.2 per cent of GDP or US $ 100.6 billion in a year in response to (i) a COVID-type contraction in real GDP growth, or (ii) a GFC type decline in interest rate differentials vis-à-vis the US, or (iii) a GFC type surge in the VIX. In an extreme risk scenario or a black swan event in which there is a combination of all these shocks, there is a 5 per cent chance of outflows under portfolio investments of 7.7 per cent of GDP and short-term trade credit retrenchment of 3.9 per cent of GDP. These estimates assume significance when assessed against the total stock of portfolio investment in India of US$ 288 billion and short-term trade credit of US$ 110.5 billion at the end of December 2021. This is indicative of the level of liquid reserves that need to be maintained at all times – in addition to standard metrics of import and debt servicing cover – to quell bouts of instability that volatile capital flows can impose in a dynamic and highly uncertain global setting in which pandemics, supply chain disruptions, and elevated commodity prices and geopolitical tensions keep interacting and intertwining. References Adrian, T., Boyarchenko, N., and Giannone, D. (2019). Vulnerable growth. American Economic Review, 109(4), 1263–1289. Alba, C., Cuadr, G., Hernández, J. R., and Ibarra-Ramirez, R. (2021). Capital flows to emerging economies and global risk aversion during the COVID-19 pandemic. Banco de México Working Papers No. 2021-17. Arslanalp, S., Drakopoulos, D., Goel, R., and Koepke, R. (2020). Benchmark-Driven Investments in Emerging Market Bond Markets: Taking Stock. IMF Working Paper WP/20/192. Azzalini, A., and Capitanio, A. (2003). Distributions generated by perturbation of symmetry with emphasis on a multivariate skew t-distribution. Journal of the Royal Statistical Society: Series B (Statistical Methodology), 65(2), 367–389. Bruno, V., and Shin, H. S. (2015). Capital flows and the risk-taking channel of monetary policy. Journal of Monetary Economics, 71, 119–132. Calvo, G. A., Leiderman, L., and Reinhart, C. M. (1993). Capital inflows and real exchange rate appreciation in Latin America: the role of external factors. Staff Papers, 40(1), 108–151. Carney, M. (2019). Pull, push, pipes: sustainable capital flows for a new world order. Group of Thirty. Eguren Martin, F., O’Neill, C., Sokol, A., and von dem Berge, L. (2021). Capital flows-at-risk: Push, pull and the role of policy. Bank of England Staff Working Paper No. 881. Fernandez-Arias, E. (1996). The new wave of private capital inflows: Push or pull? Journal of Development Economics, 48(2), 389–418. Forbes, K. J., and Warnock, F. E. (2012). Capital flow waves: Surges, stops, flight, and retrenchment. Journal of International Economics, 88(2), 235–251. Gelos, G., Gornicka, L., Koepke, R., Sahay, R., and Sgherri, S. (2021). Capital flows at risk: Taming the ebbs and flows. Journal of International Economics, 103555. Ghosh, M. A. R., Kim, M. J. I., Qureshi, M., & Zalduendo, M. J. (2012). Surges. International Monetary Fund. Koepke, R. (2019). What drives capital flows to emerging markets? A survey of the empirical literature. Journal of Economic Surveys, 33(2), 516–540. Lane, M. P. R., and Milesi-Ferretti, M. G. M. (2017). International financial integration in the aftermath of the global financial crisis. International Monetary Fund. López, G. G., and Stracca, L. (2021). Changing patterns of capital flows. Committee on the Global Financial System Papers No. 66. Annex: Capital Flow at Risk using Financial Conditions An empirical exercise has been put through here using the financial conditions of India and the US as determinants of capital flows to India to assure the robustness of our results. Since capital flows are driven by the risk-adjusted returns, pull and push factors can be proxied by the information content in asset prices. Accordingly, pull factors are proxied by a domestic financial condition index constructed by Citibank while push factors are proxied by a financial condition index for the US. A higher value of FCI indicates a tighter financial condition and vice-versa. Results indicate a tighter financial condition in India could lead to higher capital outflows while a tighter FCI in the US leads to higher capital inflows (Chart A1). Next, we perform a scenario analysis for the extreme adverse shocks of both the FCIs which were more often observed during the Global Financial Crisis (2007-09). Results show that during extreme domestic tight financial conditions there is a higher likelihood of FPI outflows of around 4.9 per cent of GDP. For a similar scenario of the tight financial conditions in the US, it could go to the extent up to 4.2 per cent of the GDP. In the case of overall capital flows to India, a tighter domestic and global financial conditions led to a capital outflow of 3.4 per cent and 1.6 per cent of GDP, respectively (Chart A2). Considering an extreme tight financial conditions both domestically and globally, the expected portfolio outflows could rise up to 6.0 per cent of GDP (Table A1). 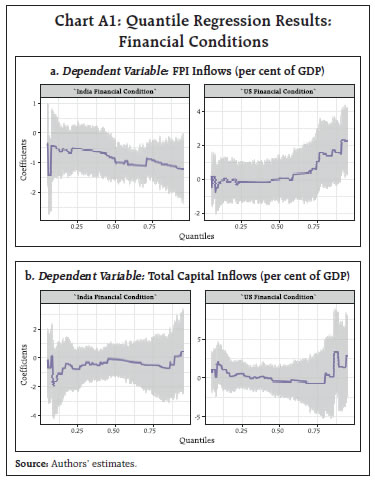 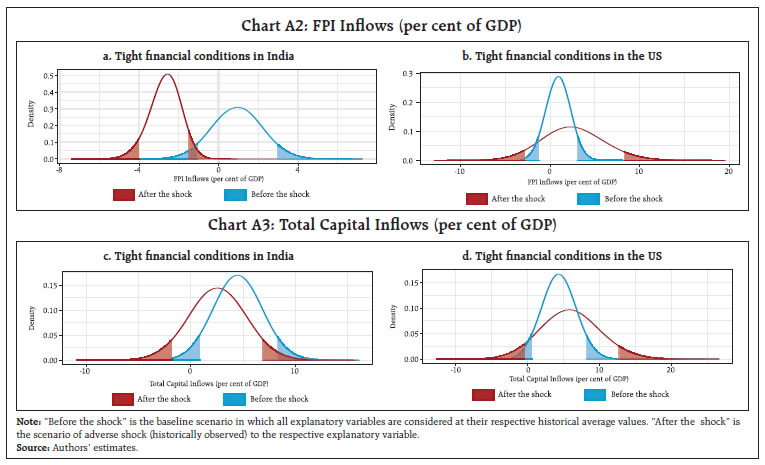 * This article has been prepared by Michael Debabrata Patra, Harendra Behera and Silu Muduli, Reserve Bank of India. The authors are grateful to Kunal Priyadarshi and Sarthak Gulati for their support. The views expressed in the article are those of the authors and do not represent the views of the Reserve Bank of India. 1 Capital inflows bring many benefits to countries because they supplement domestic investment, enhance efficiency of production, promote financial sector competitiveness, and facilitate consumption smoothing (Gelos et al., 2021). Capital inflows should support growth through greater allocative efficiency, better risk sharing and increased technological transfers (Carney, 2019). 2 This follows the methodology adopted to characterize the distribution of forecast GDP growth in order to evaluate the effects of financial condition (Adrian et al., 2019). 3 A quantile divides a frequency distribution into equal groups, each containing the same fraction of the total population. 4 In contrast to ordinary least squares, which provides an estimate of the conditional mean of a variable of interest, given a set of explanatory variables, quantile regression allows modelling the entire conditional distribution of a dependent variable for a given set of covariates. Hence, quantile regression allows the effects of independent variables to differ over quantiles. 5 Risks of capital outflows (reversals of inflows/ capital flight) are generally indicated through left tails while the risks of capital inflows (surges) are captured in right tails. 6 The robustness of the results is examined separately using financial conditions of India and the US, which is presented in the Annex. The results are found to be qualitatively similar. 7 The estimation of expected capital outflows at 5 per cent probability is similar to the expected loss measure, i.e., conditional value at risk (CVaR). |

এই পৃষ্ঠাটো শ্বেয়াৰ কৰক:


ভাৰতীয় ৰিজাৰ্ভ বেংক মোবাইল এপ্পলিকেষ্যন ইনষ্টল কৰক আৰু নৱীনতম বাতৰিৰ প্ৰৱেশাধিকাৰ পাওক!
আমাৰ এপটো ইনষ্টল কৰিবলৈ QR ক’ড স্কেন কৰক


পৃষ্ঠাটো শেহতীয়া আপডেট কৰা তাৰিখ:


