This article reviews the finances of the Central Government during first half of 2008-09. While tax collections was buoyant, key deficit indicators, viz., revenue deficit (RD), gross fiscal deficit (GFD) and primary deficit (PD) were higher reflecting higher non-plan revenue expenditure on subsidies, interest payments and plan revenue expenditure on social services, other economic services, and grants to States. Finances1 of the Central Government during the first half of the current fiscal year (April-September 2008) indicate deterioration in all the key deficit indicators, both in absolute terms as well as per cent of GDP, over the corresponding period of the preceding year. As per cent of budget estimates, both RD and GFD were higher mainly due to rise in revenue expenditure, both non-plan and plan. Growth in revenue receipts was higher than that of the corresponding period last year as a result of higher growth of net tax revenue. The rate of growth of non-tax revenue was, however, lower partly because of decline in interest receipts. Capital expenditure maintained the growth momentum. Major Trends A. Deficit Indicators
The Union Budget for 2008-09 continued the process of fiscal consolidation as per the Fiscal Responsibility and Budget Management (FRBM) Rules, 2004 and RD was budgeted to decline by 0.2 per cent of GDP to Rs.55,184 crore (1.0 per cent of GDP) in 2008-09 over the provisional accounts of 2007-08. During the first half of 2008-09, RD at Rs.78,313 crore formed 141.9 per cent of the budget estimates (BE) as against 85.5 per cent during April-September 2007 primarily due to expenditure pressure emanating from interest payments, subsidies, other economic services, social services and grants to States/UTs (Statement 1). The trend in revenue deficit as a per cent of BE during the first- half of 2008-09, however, indicate that it was much higher than the corresponding period of previous two years (Chart 1). As per cent of GDP, during April-September 2008, revenue deficit at 1.5 per cent of GDP was higher than that in the corresponding period of the preceding year (Table 1).
Table 1: Major Deficit Indicators during |
April-September |
|
As ratio to GDP |
As ratio to Budget
Estimates |
|
2008-09 |
2007-08 |
2008-09 |
2007-08 |
1 |
2 |
3 |
4 |
5 |
Revenue Deficit |
1.5 |
1.3 |
141.9 |
85.5 |
Gross Fiscal Deficit |
1.9 |
1.7 |
77.0 |
53.8 |
Primary Deficit |
0.3 |
0.2 |
-28.8 |
-104.1 |

During 2008-09, GFD was budgeted to decline by 0.3 per cent of GDP (equivalent to the minimum reduction of 0.3 per cent of GDP stipulated under the FRBM Rules, 2004) to Rs.1,33,287 crore (2.5 per cent of GDP) over the provisional accounts of 2007-08. During the first half of 2008-09, GFD at Rs.1,02,654 crore was 77.0 per cent of the budget estimates, higher than 53.0 per cent a year ago reflecting the rise in RD (Chart 2). GFD as per cent of GDP at 1.9 per cent during April-September 2008 was higher than that of 1.7 per cent during the corresponding period of the previous year. 
Gross primary deficit during the first half of 2008-09 stood at Rs.16,593 crore as against the envisaged surplus of Rs. 57,520 crore in 2008-09 (BE) (Chart 3). 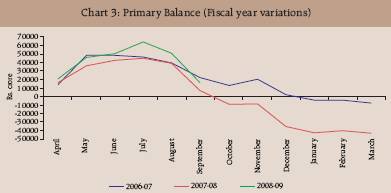
B. Revenue Position
During April-September 2008-09, revenue receipts at Rs.2,44,898 crore, registered an increase of 23.7 per cent, higher than 22.6 per cent recorded during April-September 2007 on account of increase in growth rate of tax revenue, notwithstanding the decline in growth rate of non-tax revenue (Statement 1 and Chart 4). As per cent of budget estimates, revenue receipts constituted 40.6 per cent marginally lower than 40.7 per cent in the first half of the previous year. 
Tax Revenue
Gross tax collection of the Centre during April-September 2008 at Rs.2,80,141 crore accelerated to 25.3 per cent from 24.5 per cent during the corresponding period of the previous year. As per cent of BE, at 40.7 per cent it was marginally lower than 40.8 per cent during April-September 2007. Assignment of taxes to States/UTs increased by 24.1 per cent as against the increase of 27.0 per cent during corresponding period of previous year. Net tax revenue to the Centre (at Rs.2,02,247 crore) after adjusting for the assignment to States/ UTs and surcharge for financing National Calamity Contingency Fund (NCCF) showed a growth rate of 26.0 per cent as against 23.5 per cent in the corresponding period of the previous year (Chart 5). It formed 39.9 per cent of BE marginally higher than in April-September 2007 (Table 2 and Statement 2). 
Table 2 : Growth Rates in Mobilisation of Major Taxes |
(Per cent) |
|
2007-08 |
2008-09 |
2007-08 |
2007-08 |
2008-09 |
|
(April-
September) |
(April-
September) |
(Revised
Estimates) |
(Provisional
Accounts) |
(Budget
Estimates) |
1 |
2 |
3 |
4 |
|
5 |
Corporate Tax |
38.6 |
38.2 |
29.0 |
31.3 |
21.6 |
Income Tax |
38.2 |
30.7 |
37.8 |
40.8 |
16.6 |
Customs Duty |
15.9 |
16.9 |
16.7 |
19.2 |
18.0 |
Excise Duty |
3.4 |
6.6 |
8.8 |
4.8 |
7.8 |
Gross Tax Revenue |
24.5 |
25.3 |
23.6 |
24.8 |
17.5 |
Net Tax Revenue |
23.5 |
26.0 |
22.9 |
24.6 |
17.5 |
Among the major taxes, rate of growth of income tax at 30.7 per cent was lower than that of last year (38.2 per cent). Rates of growth of all components of income tax decelerated. There was a sharp decline in the rate of growth of securities transaction tax (from 45.4 per cent last year to 2.7 per cent this year) and fringe benefit tax (from 94.0 per cent last year to 70.4 per cent this year). Rate of growth of corporation tax at 38.2 per cent was also marginally lower than that of last year (38.6 per cent). Growth rate of custom duties, however, increased from 15.9 per cent last year to 16.9 per cent this year. Rate of growth of union excise duties also increased from 3.4 per cent last year to 6.6 per cent this year. Non-Tax Revenue
Non-tax revenue at Rs.42,651 crore decelerated to 13.9 per cent in April-September 2008 mainly on account of decline in interest receipts. Dividends and profits at Rs.20,669 crore showed an increase of Rs.2,607 crore, interest receipts ( Rs.7,788 crore) a decline of Rs.530 crore and ‘net other non-tax revenue’ (net of Commercial Department) (Rs.13,861 crore) an increase of Rs.3,141 crore. C . Non-Debt Capital Receipts
Non-debt capital receipts comprising recovery of loans and other receipts at Rs 1,529 crore were lower than a year ago. As per cent of budget estimates, non-debt capital receipts were 10.4 per cent in April-September 2008 marginally lower than 10.3 per cent during corresponding period of the previous year. D. Expenditure Pattern
Aggregate expenditure during April-September 2008 at Rs.3,49,081 crore, registered a sharp rise of 23.6 per cent compared to 12.1 per cent increase a year ago (Chart 6). As per cent of BE, aggregate expenditure during April-September 2008 at 46.5 per cent was higher than the same during the corresponding period of the previous year. 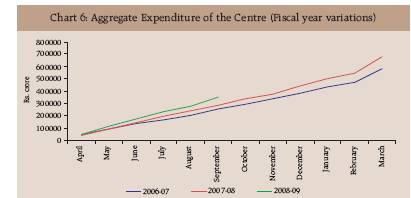
Plan Expenditure
Plan expenditure at Rs.1,08,452 crore increased by 25.0 per cent, lower than 26.0 per cent a year ago (Chart 7). As per cent of the BE, however, at 44.6 per cent, it was higher than 42.3 per cent in the preceding year. The increase in Plan expenditure was due to expenditure towards rural development, agriculture, drinking water supply, school education and literacy and power (Table 3). 
Table 3 : Major Items of Plan Expenditure by Ministry / Department |
(Rupees crore) |
Ministry / Department (Deptt.) |
2008-09 BE |
April-September |
Increase/ Decrease |
|
|
2008 |
2007 |
|
1 |
2 |
3 |
4 |
5 |
Deptt of Rural Development |
31,500 |
24,577 |
15,834 |
8,743 |
Deptt of Agriculture and Co-operation. |
10,106 |
4,516 |
2606 |
1,910 |
Deptt. Of Drinking Water Supply |
8,500 |
4,458 |
2,899 |
1,559 |
Deptt. Of School Education and Literacy |
26,800 |
8,256 |
6,875 |
1,381 |
Ministry of Power |
6,000 |
1,675 |
595 |
1,080 |
Deptt. Of Higher Education |
7,594 |
2,218 |
1,347 |
871 |
Deptt. Of Health and Family Welfare |
15,580 |
6,156 |
5,299 |
857 |
Within total plan expenditure, the revenue component during the first half of 2008-09, at Rs.93,727 crore, recorded higher growth, constituting 44.7 per cent of BE as against 41.0 per cent in the corresponding period of the previous year. The increase in plan revenue expenditure by Rs.22,156 crore was primarily on account of other economic services, social services and plan grants to States/UTs. On the other hand, capital component at Rs. 14,725 crore declined by 3.0 per cent as against increase of 36.5 per cent last year (Table 4 and Statement 1).
Table 4: Expenditure of the Centre |
(Rupees crore) |
|
Item |
April-September |
Variation |
|
|
|
2008 |
2007 |
Amount |
Per cent |
|
1 |
2 |
3 |
4 |
5 |
A. |
Revenue Expenditure |
3,23,211 |
2,59,080 |
64,131 |
24.8 |
|
Non-Plan Revenue Expenditure |
2,29,484 |
1,87,509 |
41,975 |
22.4 |
|
Interest Payments |
86,061 |
72,820 |
13,241 |
18.2 |
|
Major Subsidies |
54,916 |
34,954 |
19,962 |
57.1 |
|
Defence Revenue |
27,397 |
25,817 |
1,580 |
6.1 |
|
Pension |
12,247 |
10,685 |
1,562 |
14.6 |
|
Grants to States/Uts |
16,074 |
16,673 |
-599 |
-3.6 |
|
Plan Revenue Expenditure |
93,727 |
71,571 |
22,156 |
31.0 |
|
Social Services |
19,077 |
13,508 |
5,569 |
41.2 |
|
Grants to States /Uts |
33,671 |
29,733 |
3,398 |
13.2 |
|
Other Economic Services |
40,916 |
28,255 |
12,661 |
44.8 |
B. |
Capital Expenditure |
25,870 |
23,281* |
2,589 |
11.1 |
|
Loans & Advances |
5,167 |
5,003 |
164 |
3.3 |
|
Non-Defence Capital Outlay |
12,316 |
12,584* |
-268 |
-2.1 |
|
Defence Capital Outlay |
8,387 |
5,694 |
2,693 |
47.3 |
C. |
Total Expenditure |
3,49,081 |
2,82,361* |
66,720 |
23.6 |
*: Net of SBI transactions. |
Non-Plan Expenditure
Non-Plan expenditure, at Rs.2,40,629 crore during April-September 2008 also registered a substantially higher growth of 23.0 per cent as compared with 6.8 per cent in the corresponding period of the previous year (Chart 8). As per cent of budget estimates, it formed 47.4 per cent during the period under review as against 41.1 per cent a year ago. The acceleration in non-plan expenditure was primarily due to increase in the revenue component under interest payments and major subsidies (Table 4). Defence (revenue) expenditure and pension rose by 6.1 per cent and 14.6 per cent, respectively over those in the corresponding period last year. However, grants to States/UTs declined by 3.6 per cent during this period. 
Interest payments and major subsidies constituted 61.4 per cent of non-plan revenue expenditure in April-September 2008-09 as compared with 57.5 per cent in corresponding period of the previous year (Chart 9). During the first half of 2008-09, increase in expenditure on major subsidies by Rs.19,962 crore was mainly on account of increase in fertiliser subsidies, viz., on decontrolled fertiliser (Rs.9,407.2 crore) and fertiliser (imported) (Rs.941.93 crore) and food subsidy (Rs.8,949.4 crore). 
Capital Outlay
Capital outlay during the period under review, at Rs.20,703 crore, increased by 13.3 per cent as compared with an increase of 1.7 per cent in the preceding year. While the defence capital outlay was higher by 47.3 per cent, non-defence capital outlay declined by 2.1 per cent from its level in April-September 2007 (Table 4). E. Financing of Gross Fiscal Deficit
Market borrowing and drawdown of cash balances financed 62.3 per cent and 38.5 per cent of GFD, respectively. Short term borrowings financed 28.3 per cent of GFD. Treasury Bills (14-day) and other capital receipts made negative contributions of (-) 26.8 per cent and (-) 8.6 per cent, respectively (Table 5).
Table 5: Sources of Financing GFD: April-September, 2008-09 and 2007-08 |
|
2008-09 |
2007-08 |
Amount |
Share (%) |
Amount |
Share (%) |
1 |
2 |
3 |
4 |
5 |
1. |
Gross Fiscal Deficit* |
1,02,654 |
100.0 |
81,200 |
100.0 |
2. |
Market Borrowings (dated securities and 364-day T-Bills) |
63,987 |
62.3 |
86,960 |
107.1 |
3. |
Short-Term Borrowings (91 and 182-day T-Bills) |
29,078 |
28.3 |
11,583 |
14.3 |
4. |
14-day Intermediate T-Bills |
-27,550 |
-26.8 |
-4,422 |
-5.4 |
5. |
Sate Provident Funds |
120 |
0.1 |
191 |
0.2 |
6. |
National Small Saving Fund (Net) |
7,013 |
6.8 |
-13,891 |
-17.1 |
7. |
Special Deposits |
-481 |
-0.5 |
865 |
1.1 |
8. |
Securities against Small Savings |
-621 |
-0.6 |
-545 |
-0.7 |
9. |
Deposit Scheme for Retiring Employees |
-4 |
0.0 |
-254 |
-0.3 |
10. |
External Assistance |
2,315 |
2.3 |
2,478 |
3.1 |
11. |
Others |
-10,702 |
-10.4 |
-22,025 |
-27.1 |
|
Of which: |
|
|
|
|
|
i. Suspense and Remittances |
-1,879 |
-1.8 |
-5,551 |
-6.8 |
|
ii. Other Capital Receipts |
-8,823 |
-8.6 |
-16,475 |
-20.3 |
|
Of which: |
|
|
|
|
|
(a) Compensation and other Bonds |
-7,581 |
-7.4 |
-4,662 |
-5.7 |
|
(b) Advances |
-1,992 |
-1.9 |
-1,756 |
-2.2 |
|
(c) Marketable Securities issued in Conversion of Special Securities |
0 |
0.0 |
-5,000 |
-6.2 |
|
(d) Special Securities issued to Nationalised Banks |
0 |
0.0 |
-12,101 |
-14.9 |
12. |
Disinvestment of Surplus Cash |
0 |
0.0 |
0.0 |
0.0 |
13. |
Drawdown of Cash Balances |
39,499 |
38.5 |
20,260 |
25.0 |
14. |
Ways and Means Advances and Over draft |
0 |
0.0 |
0.0 |
0.0 |
* : Gross Fiscal Deficit in this table includes Rs.35,531 crore, acquisition cost of RBI’s stake in
State Bank of India (SBI) and neutralised
to the extent of transfer from RBI with regard to the transaction.
1 : GFD includes the net impact of transactions involved in acquisition of RBI’s stake in SBI by the
Central Government of Rs.1,223 crore. |
Gross market borrowing this year as on December 1, 2008 was Rs.1,72,904 crore (98.4 per cent of BE) as against Rs.1,52,060 crore (80.3 per cent of BE) in the corresponding period last year. Net market borrowing this year as on December 1, 2008 was Rs.1,06,816 crore (107.9 per cent of BE) as against Rs.97,766 crore (88.3 per cent of BE) in the corresponding period last year. Cash Management
During 2008-09 (up to December 1, 2008), the Central Government took recourse to ways and means advances for 20 days as compared with 91 days during the corresponding period of 2007-08. Commencing the year with a surplus cash balance of Rs.76,686 crore (end-March 2008), the Central Government used up these balances to meet its expenditure needs and resorted to WMA between August 4, 2008 and August 6, 2008. With inflow of indirect taxes and surplus transferred from the Reserve Bank, the cash balances turned into surplus between August 7, 2008 and September 1, 2008. The Central Government again resorted to WMA during September 2-14, 2008 to meet the mismatches in receipts and expenditure. As on September 30, 2008 the Central Government maintained a surplus cash balance of Rs.41,470 crore with the Reserve Bank. The Government resorted to WMA during November 4-7, 2008 and as on November 30, 2008 it maintained a surplus cash balance of Rs. 4,812 crore with the Reserve Bank. The average daily utilisation of WMA by the Central Government (up to November 30, 2008) was Rs.446 crore as compared with Rs.5,407 crore in the corresponding period of the preceding year. The Centre had also availed of overdraft during the corresponding period of the preceding year, the daily average being placed at Rs.968 crore. Concluding Observations and Broad Assessment
Finances of the Central Government during the first half of the current fiscal year (April-September 2008) indicate deterioration in all the key deficit indicators, both in absolute terms as well as per cent of GDP, over the corresponding period of the preceding year. As per cent of budget estimates, both RD and GFD were higher mainly due to rise in revenue expenditure, both non-plan and plan. The acceleration in non-plan expenditure emanated from interest payments and major subsidies. The increase in Plan expenditure was due to expenditure towards social services, other economic services and grants to States. Growth in revenue receipts was higher than that of the corresponding period last year as a result of higher growth of net tax revenue. However, the rate of growth of non-tax revenue was lower than that of last year on account of decline in interest receipts. Capital expenditure maintained the growth momentum. While expenditure is slated to increase in the coming months, growth of tax revenue is likely to decelerate with the expected moderation in real economic activities following the global financial meltdown. Consequently, pressure on deficit indicators is likely during remaining part of 2008-09.
Statement 1 : Budgetary Position of the Central Government |
(Rupees crore) |
Item |
Actuals |
Budget Estimates |
April-September |
( April - September ) |
( Financial Year) |
Percentages to Budget
Estimates |
Growth Rate
(Per cent) |
2008-09 |
2007-08 |
2008-09 |
2007-08 |
2008-09 |
2007-08 |
2008-09 |
2007-08 |
1 |
2 |
3 |
4 |
5 |
6 |
7 |
8 |
9 |
1. |
Revenue Receipts |
244,898 |
197,956 |
602,935 |
486,422 |
40.6 |
40.7 |
23.7 |
22.6 |
2. |
Tax Revenue (Net) |
202,247 |
160,500 |
507,150 |
403,872 |
39.9 |
39.7 |
26.0 |
23.5 |
3. |
Non-Tax Revenue |
42,651 |
37,456 |
95,785 |
82,550 |
44.5 |
45.4 |
13.9 |
19.2 |
|
of which : |
|
|
|
|
|
|
|
|
|
(i) Interest Receipts |
7,788 |
8,318 |
19,135 |
19,308 |
40.7 |
43.1 |
-6.4 |
32.1 |
4. |
Capital Receipts |
104,183 |
119,936 |
147,949 |
194,099 |
70.4 |
61.8 |
-13.1 |
32.5 |
|
|
|
(85,627) * |
|
|
|
(44.1) |
(21.7) |
-(5.4) |
5. |
Recovery of Loans |
1,486 |
2,030 |
4,497 |
1,500 |
33.0 |
135.3 |
-26.8 |
-50.2 |
6. |
Other Receipts |
43 |
36,706 |
10,165 |
41,651 |
0.4 |
88.1 |
-99.9 |
- |
|
|
|
(2,397) * |
|
|
|
(5.8) |
-(98.2) |
- |
7. |
Borrowings |
102,654 |
81,200 |
133,287 |
150,948 |
77.0 |
53.8 |
26.4 |
-6.1 |
8. |
Total Receipts (1+4) |
349,081 |
317,892 |
750,884 |
680,521 |
46.5 |
46.7 |
9.8 |
26.2 |
|
|
|
(283,583) * |
|
|
|
(41.7) |
(23.1) |
(12.6) |
9. |
Non-Plan Expenditure |
240,629 |
231,134 |
507,498 |
475,421 |
47.4 |
48.6 |
4.1 |
26.3 |
|
|
|
(195,603) # |
|
|
|
(41.1) |
(23.0) |
(6.8) |
10. On Revenue Account |
229,484 |
187,509 |
448,352 |
383,546 |
51.2 |
48.9 |
22.4 |
8.4 |
|
of which : |
|
|
|
|
|
|
|
|
|
(i) Interest Payments |
86,061 |
72,820 |
190,807 |
158,995 |
45.1 |
45.8 |
18.2 |
13.8 |
11. On Capital Account |
11,145 |
43,625 |
59,146 |
91,875 |
18.8 |
47.5 |
-74.5 |
330.3 |
|
|
|
(8,094) # |
|
|
|
(8.8) |
(37.7) |
-(20.2) |
12. Plan Expenditure |
108,452 |
86,758 |
243,386 |
205,100 |
44.6 |
42.3 |
25.0 |
26.0 |
13. On Revenue Account |
93,727 |
71,571 |
209,767 |
174,354 |
44.7 |
41.0 |
31.0 |
23.9 |
14. On Capital Account |
14,725 |
15,187 |
33,619 |
30,746 |
43.8 |
49.4 |
-3.0 |
36.5 |
15. Total Expenditure (9+12) |
349,081 |
317,892 |
750,884 |
680,521 |
46.5 |
46.7 |
9.8 |
26.2 |
|
|
|
(282,361) # |
|
|
|
(41.5) |
(23.6) |
(12.1) |
16. Revenue Expenditure (10+13) |
323,211 |
259,080 |
658,119 |
557,900 |
49.1 |
46.4 |
24.8 |
12.3 |
17. Capital Expenditure (11+14) |
25,870 |
58,812 |
92,765 |
122,621 |
27.9 |
48.0 |
-56.0 |
176.6 |
|
of which : |
|
(23,281) # |
|
|
|
(19.0) |
(11.1) |
(9.5) |
|
(i) Loans and Advances |
5,167 |
5,003 |
8,243 |
7,498 |
62.7 |
66.7 |
3.3 |
52.1 |
18. Revenue Deficit (16-1) |
78,313 |
61,124 |
55,184 |
71,478 |
141.9 |
85.5 |
28.1 |
-11.8 |
19. Fiscal Deficit {15-(1+5+6)} |
102,654 |
81,200 |
133,287 |
150,948 |
77.0 |
53.8 |
26.4 |
-6.1 |
|
|
|
(79,978) *# |
|
|
|
(53.0) |
(28.4) |
-(7.5) |
20. Gross Primary Deficit {19-10(i)} |
16,593 |
8,380 |
-57,520 |
-8,047 |
-28.8 |
-104.1 |
98.0 |
-62.7 |
|
|
|
(7,158) *# |
|
|
|
-(89.0) |
(131.8) |
-(68.1) |
* : Figures in parentheses are net of transfer of RBI's profit to the Government of India valued at Rs.34,309 crore on
account of SBI transactions.
#
: Figures in parentheses are net of acquisition cost of RBI's stake in State Bank of India (SBI) at Rs. 35,531 crore.
Source : Controller General of Accounts, Ministry of Finance, Government of India. |
Statement 2 : Tax Collection of the Central Government during April-September 2008 |
(Rupees crore) |
Item |
Actuals |
Budget
Estimates |
April-September |
( April - September ) |
( Financial
Year) |
Percentages to Budget
Estimates |
Growth Rate
(Per cent) |
2008-09 |
2007-08 |
2008-09 |
2007-08 |
2008-09 |
2007-08 |
2008-09 |
2007-08 |
1 |
2 |
3 |
4 |
5 |
6 |
7 |
8 |
9 |
A. |
Gross Tax Revenue (1 to 6 ) |
280,141 |
223,491 |
687,715 |
548,122 |
40.7 |
40.8 |
25.3 |
24.5 |
|
1. |
Corporation Tax |
96,991 |
70,176 |
226,361 |
168,401 |
42.8 |
41.7 |
38.2 |
38.6 |
|
2. |
Income Tax |
53,666 |
41,057 |
138,314 |
98,774 |
38.8 |
41.6 |
30.7 |
38.2 |
|
|
(a) Taxes on Income other |
46,349 |
35,445 |
120,604 |
86,829 |
38.4 |
40.8 |
30.8 |
35.3 |
|
|
than Corporation Tax |
|
|
|
|
|
|
|
|
|
|
(b) Securities Transaction Tax |
3,182 |
3,099 |
9,000 |
4,500 |
35.4 |
68.9 |
2.7 |
45.4 |
|
|
(c) Banking Cash |
|
|
|
|
|
|
|
|
|
|
Transaction Tax |
323 |
276 |
550 |
645 |
58.7 |
42.8 |
17.0 |
17.9 |
|
|
(d) Fringe Benefit Tax |
3,812 |
2,237 |
8,160 |
6,800 |
46.7 |
32.9 |
70.4 |
94.0 |
|
3. |
Customs Duties |
56,242 |
48,098 |
118,930 |
98,770 |
47.3 |
48.7 |
16.9 |
15.9 |
|
4. |
Union Excise Duties |
47,870 |
44,889 |
137,874 |
130,220 |
34.7 |
34.5 |
6.6 |
3.4 |
|
5. |
Service Tax |
24,139 |
18,343 |
64,460 |
50,200 |
37.4 |
36.5 |
31.6 |
37.2 |
|
6. |
Other Taxes |
1,233 |
928 |
1,776 |
1,757 |
69.4 |
52.8 |
32.9 |
8.4 |
B. |
Surcharge for Financing NCCF |
1,133 |
1,140 |
1,800 |
1,800 |
62.9 |
63.3 |
-0.6 |
40.9 |
C. |
Balance Gross Tax Revenue |
279,008 |
222,351 |
685,915 |
546,322 |
40.7 |
40.7 |
25.5 |
24.4 |
D. |
Assignment to States/UTs |
76,761 |
61,851 |
178,765 |
142,450 |
42.9 |
43.4 |
24.1 |
27.0 |
E. |
Net Tax Revenue |
202,247 |
160,500 |
507,150 |
403,872 |
39.9 |
39.7 |
26.0 |
23.5 |
NCCF : National Calamity Contigency Fund.
Uts : Union Territories.
Source
: Controller General of Accounts, Ministry of Finance, Government of India. |
* Prepared in the Division of Central Finances, Department of Economic Analysis and Policy, Reserve Bank of India.
1 The review in this article is based on the provisional data on Union Government Accounts for April-September 2008, received from the Controller General of Accounts, Ministry of Finance, Government of India. Comparisons with the corresponding data for 2007 is based on net of transactions involved in the acquisition of RBI's stake in SBI by the Union Government i.e., capital expenditure of Rs. 35,531 made by Government of India in June 2007 for acquisition of RBI stake in SBI and the one time transfer of surplus from the RBI of Rs.34,309 crore to the Union Government in August 2007. |


