 IST,
IST,


Estimate of Spare Capacity for India’s Services Sector
|
by Abhilash Arun Satape, Nivedita Banerjee, Arti Sinha, M. Sreeramulu^ and Supriya Majumdar# Estimation of spare capacity in personnel-oriented services sector is more challenging as compared with the manufacturing sector, where total capacity remains relatively more anchored. Given the predominant share of the services sector in national output, an estimate of spare capacity in the services sector - would be useful. This article provides the conceptual background and methodological aspects for estimating spare capacity for the Indian services sector. It also presents quarterly estimates of spare capacity since January-March 2021 based on the data received through Services and Infrastructure Outlook Survey (SIOS). Introduction Information on the spare capacity (SC) is useful for assessing slack in an economy for business cycle analysis, as it provides a basis to assess the current operating efficiency of an economy and the extent to which the available productive resources are used by the economy. SC is the ratio of potential increase in the output to the current output that can be achieved under existing conditions in case demand expands. For an individual firm, high levels of SC enable it to engage its existing labour and capital more intensively to increase its output to respond to sudden increase in demand. In case the demand is likely to persist, the enterprises operating almost at minimal spare capacity may deploy more capital and/or employ more employees to increase their output, which may also necessitate them to increase their output prices. There is a wider divergence in operating mechanism in various sectors, which necessitates differentiating the concept of capacity and its utilisation across sectors. While a manufacturing unit comprehends the capacity utilisation (CU) in terms of installed production capacity of the machines and the production demand, majority of services sector units recognises its spare capacity in terms of labour or working hours. So, measuring capacity utilisation poses challenges as the measuring tools may vary across sectors. As the CU for manufacturing is easy to quantify, the CU estimates for the manufacturing sector are available for many countries, whereas for only a few countries, the CU estimates for the services sector are available due to challenges in proper quantification. In India, CU for the manufacturing sector is estimated based on quantitative information captured in the quarterly ‘Order Books, Inventories and Capacity Utilisation Survey (OBICUS)’ conducted by the Reserve Bank of India. The CU for the manufacturing sector tracks the movement of the de-trended Index of Industrial Production (IIP) and is able to capture the investment cycles. Although manufacturing CU is available for India since 2008, similar estimate is not available for the services sector. Given that the services sector is a major contributor to the country’s GDP, a strong need for estimating the CU or alternately the SC for the sector was felt, notwithstanding the conceptual challenges, particularly the difficulty in defining installed/potential capacity for the services sector units. Though SC and the CU seems to be closely related (one may imply the other) both have been referred to in this article as per the context. As business tendency surveys provide timely information on key business parameters, it was envisaged to capture the information on spare capacity for the services sector through forward looking qualitative surveys conducted by the Reserve Bank. Accordingly, a set of questions were included in the Services and Infrastructure Outlook Survey (SIOS)1 questionnaire. This article besides presenting cross-country experiences on SC, briefly discusses methodological aspects followed in collecting information on SC in the Indian context, and also presents quarterly estimates of SC for the Indian services sector since January-March 2021. The rest of the article is organised in four sections. Section II describes cross country experiences in estimating the SC for the services sector. Section III explains the approach adopted in the Indian context along with methodological aspects and empirical results. Concluding observations are presented in section IV. The interpretation of capacity utilisation is not straight forward and varies considerably across different industries of the economy. For firms engaged in the more capital-intensive goods-related industries, a high level of capacity utilisation may reveal an impetus to hire more labour and to invest in the capital stock, while for services firms it is more likely to reflect an incentive to hire more labour only (Lane and Rosewall, 2015). Generally, services are rendered and created as and when demanded, and it is not conventional to define the concept of installed capacity and therefore directly asking about the capacity utilisation or installed capacity may not be feasible for services sector. Based on the review of several methods adopted by various central banks / international institutes for such estimation using a similar kind of surveys, two major approaches for different sectors were found useful for our estimation: one is the European model and other one is the Brazilian model. II.1 The European Model European Commission, Directorate-General for Economic & Financial Affairs (DG ECFIN) adopted an indirect approach for estimating CU for services sector units. They had added questions to the standard questionnaire of the Harmonised European Union (EU) wide survey in the services sector since 2011 (Gayer, 2013). These supplementary questions inquire the additional output that firms can generate with the currently available resources. The rate of capacity utilisation is inferred based on this information. The supplementary questions are: a. If the demand addressed to your firm expanded, could you increase your volume of activity with your present resources? YES / NO b. If so, by how much? _____% The capacity utilisation rate is inferred as 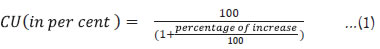 The CU can be calculated using equation (1). The ‘No’ response in question ‘a’ would imply that the answer to ‘b’ is zero and in that case the CU equals to 100 per cent. As stated by European Commission DG ECFIN, the series on capacity utilisation, collected through the above questions on the ‘marginal increase of activity’, in the services sector appears to be of sufficiently high quality in terms of both cyclical tracking performance and smoothness. All member countries of EU have implemented this question set. II.2 The Brazilian Model The Brazilian Institute of Economics (IBRE) [Bittencourt, 2013] introduced the above two questions in its monthly Tendency Survey for the Services and Trade sectors in 2013 following the European model. One additional qualitative question on the level of capacity utilisation (increase, no change, decrease) was also included. Specific to the construction sector, IBRE also added two separate measures: For Labour: “Regarding the labour available at this moment, what is the rate of the current productive capacity utilisation of the company?” For Machines and equipment: “With respect to machines and equipment available at this moment, what is the company’s rate of productive capacity utilisation?” The results based on the survey outcome were compared with the manufacturing CU. Capacity utilisation in services was assumed to be higher than in manufacturing sector in a long-term perspective. This is due to the higher need for physical capital endowments, which are difficult to adjust in the short-term, requires some capital buffer in manufacturing sector compared to services. Drawing upon the cross-country experience, to measure the SC for the Indian services sector, an illustrative method was designed with appropriate questions for inclusion in the existing questionnaire of SIOS on an experimental basis starting from the January-March 2021 round. Instead of capacity utilisation, it was found more appropriate to name the data captured as ‘spare capacity’ which could be easily understood by the respondents and would differentiate the concept from the manufacturing CU, where large component of fixed assets is involved. The questions related to SC were modified based on feedback and interactions with the respondents, which helped in increasing the response rate over the study period. The question on spare capacity which was included in the SIOS questionnaire is described below: III.1 Question on Spare Capacity
The above question on capacity basically aims to indirectly capture the ‘marginal increase of activity’, which can be treated as ‘spare capacity’, based on individual company’s status of running business at the current level. As the base for answer on question ‘b’ would vary across companies, for making a common base for comparison and ease of aggregation, the answers need to be converted into the CU for the completed quarter which can be computed as: 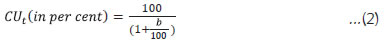 The ‘No’ response in ‘a’ would imply that the answer to ‘b’ is zero and in that case the service providing company does not have any spare capacity and thus the CU equals to 100 per cent. To make the respondents understand the difficult concept in a simpler way, the following explanatory note was also added in the ‘Guidelines for Questions’ of the SIOS questionnaire. “Spare Capacity may be answered with respect to the realised values i.e., for the previous quarter. While answering, companies may relate to expansion in their business assuming an increase in demand for their services and reply how much percentage increase in their serving capacity/ volume of activity/ business could be achieved with existing resources to meet the additional demand where resources include employees and other infrastructure and logistics (except raw material) required for providing those services. If the answer is ‘No’, then it implies no spare capacity in your company, in which case, answer to question ‘b’ will be zero (0) meaning there is no unutilised resources” The information on spare capacity thus collected through the indirect question is converted into CU using equation (2) and the aggregate CU is calculated using a weighing method which is described in the next section. The absolute spare capacity is then arrived at using the following identity:  The spare capacity can be derived from the following equation:  The spare capacity based on the above method provides an estimate of unutilised available resources which would have helped achieving additional output under existing conditions in case demand expands. SC has been defined in terms of expected percentage increase in the output to the current output. This approach thus obviates a direct reference to the capacity utilisation or the installed capacity, which are difficult to estimate for the services sector, at the time of seeking inputs in the survey as well as while providing the estimates of the spare capacity. The spare capacity estimates thus reveals a fair idea about the performance of the services sector and its potential response to additional demand in the sector. III.2 Estimation of Spare Capacity, Methodological Aspects and Empirical Findings Till date, fourteen rounds of SIOS have been completed including questions on spare capacity in the services sector. The response rates for these fourteen rounds of surveys were satisfactory, but they were also impacted by the specific events that occurred during the survey period such as Covid pandemic (Table 1). For computing the SC for the services sector at an aggregate level, two-stage weighted average method is adopted, the first stage weights being the company level sales/turnover and second stage weights being the sub-sector wise GVA weights. The first stage weights are obtained from actual annual sales of the companies available in public domain, wherever possible; and for remaining companies’ mid-points of the company turnover size-group, as captured in the survey schedule, has been used as a proxy.2 For the second stage weights, the contribution of the sub-sectors to the total services GVA has been mapped with the available official prints for the year 2011-12. SC for the services sector estimated using above method is presented in Table 2. The SC estimates3 reveal that, as the services activities in India were relatively lower in Q1:2021-22 due to the adverse impact of the COVID second wave, this resulted in a higher level of spare capacity; the services sector activities picked up notably in Q2:2021-22 witnessing lower SC. The situation reversed again with higher SC observed in Q4:2021-22 as the contact intensive services activities again slowed down due to the Omicron variant of COVID-19. However, the situation improved subsequently. A cross-country comparison of spare capacity indicates that the estimated SC for services sector for India was in the range of 11 to 14 per cent4, broadly in-line with that in European Union (EU) and some of its member countries who compile the CU for services sector on regular basis (Chart 1)5. During the second as well as the omicron variant wave of COVID-19 pandemic, the SC in Indian services sector increased significantly, and they are figured as outliers (Chart 1). The range of SC for Brazil and Australia exceeds India. A comparison of the SC for manufacturing in India (converted from CU using method explained above) with the survey outcome on the services SC reveals that, the SC for manufacturing sector in India exceeds that in the services sector across all quarters (Chart 2a). Cross-country comparison also suggests similar trends except Australia where in a few quarters, the services SC surpassed the manufacturing sector SC (Chart 2). The spare capacity in services could be lower than that in manufacturing sector in a long-term perspective due to the higher need for physical capital endowments in the manufacturing sector, which are difficult to adjust in the short-term, requiring some capital buffer (Bittencourt, 2013). 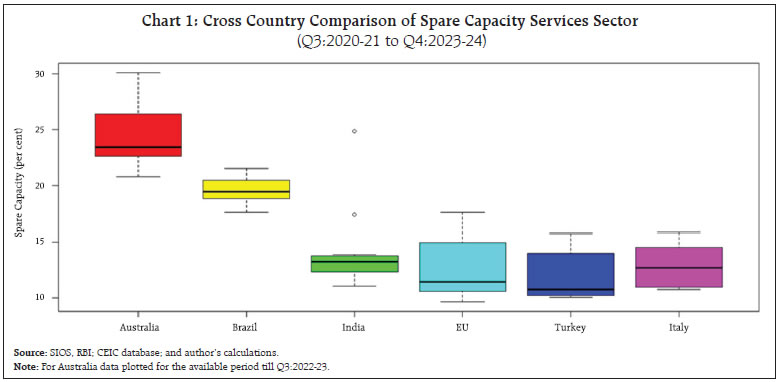 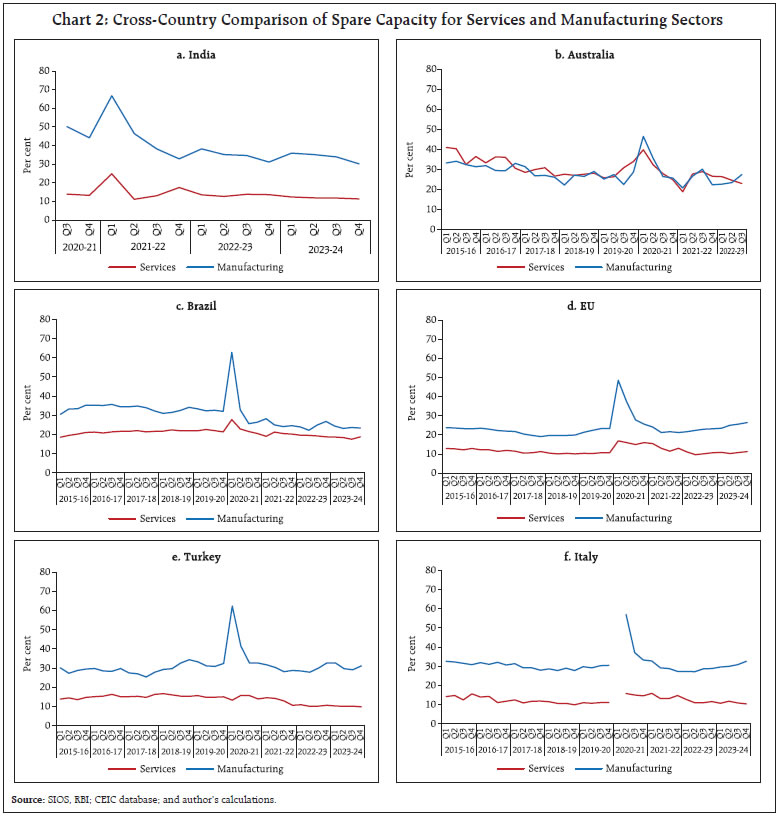 With service being the major contributor to India’s GDP, this article attempted to estimate Spare Capacity (SC) in the services sector by using the information collected through RBI’s Services and Infrastructure Outlook Survey. To compute the SC, two experimental questions were included in the SIOS questionnaire since January-March 2021. The results suggest that the SC of Indian services sector was in the range of 11 to 14 per cent during 3-year period 2021-24, although it may be noted that the sample period largely coincides the post-pandemic period. The inclusion of experimental question was useful in estimating SC for Indian services sector firms and the information obtained coupled with the CU for manufacturing sector can strengthen inputs for understanding of inflation and output dynamics and for policy formulation. References Australian Industry Group. (2024). Australian Performance of Services Index (Quarterly issue). Retrieved from https://www.aigroup.com.au/resourcecentre/research-economics/PSI/ Bittencourt, V. S. (2013). Measuring the Level of Capacity Utilisation in Non-manufacturing sectors. Paper presented at the ECFIN 2013 BCS Workshop, Brussels. European Commission. (2024). Business and consumer surveys (Monthly issue). Retrieved from https://economy-finance.ec.europa.eu/economic-forecast-and-surveys/business-and-consumer-surveys_en Gayer, C. (2013). New question on capacity utilization in the services sector - State of play and analysis of results from July 2011 to October 2013. Paper presented at the Joint EU/OECD Workshop on recent development in Business and Consumer Surveys, Brussels. Lane, K., and Rosewall, T. (2015). Firm-level capacity utilisation and the implications for investment, labour and prices. Reserve Bank of Australia Bulletin, December. Reserve Bank of India. (2024). Order Books, Inventories and Capacity Utilisation survey (Quarterly issue). Retrieved from https://rbi.org.in/web/rbi/publications/publications-by-frequency?category=21281740 ^ The authors are from the Department of Statistics and Information Management and Financial Markets Regulation Department. # The author is retired Director from the Department of Statistics and Information Management. The views expressed in this article are those of the authors and do not represent the views of the Reserve Bank of India. 1 The survey questionnaire can be accessed at: https://rbi.org.in/web/rbi/forms 2 The approximation of annual sales was required to be done only for about 20 per cent of companies. The exact company weights and the mid-points of the company turnover size classes were examined and not much difference was found from the actual ones, which allowed us the flexibility to use the mid-points of the company turnover size-intervals as the first stage weights, in case of non-availability of actual sales figures, typically for the smaller companies. 3 As the question asked relates to the responding company’s experience with the actual realisation of capacity, the given response pertains to the previous quarter. 4 The second wave of COVID-19 (Q1:2021-22) and the period of the COVID-19 Omicron variant wave (Q4:2021-22) are shown as outliers when SC for services were estimated at 24.8 per cent and 17.4 per cent respectively. 5 It may be noted that a number of countries calculate the CU instead of SC for the services sector and therefore, using the equation (3) and (4), those have been converted into SC for making similar comparison with India. |
|||||||||

এই পৃষ্ঠাটো শ্বেয়াৰ কৰক:


ভাৰতীয় ৰিজাৰ্ভ বেংক মোবাইল এপ্পলিকেষ্যন ইনষ্টল কৰক আৰু নৱীনতম বাতৰিৰ প্ৰৱেশাধিকাৰ পাওক!
আমাৰ এপটো ইনষ্টল কৰিবলৈ QR ক’ড স্কেন কৰক


পৃষ্ঠাটো শেহতীয়া আপডেট কৰা তাৰিখ:


