
I. Output - আৰবিআই - Reserve Bank of India


I. Output
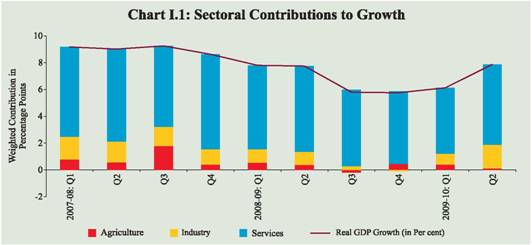
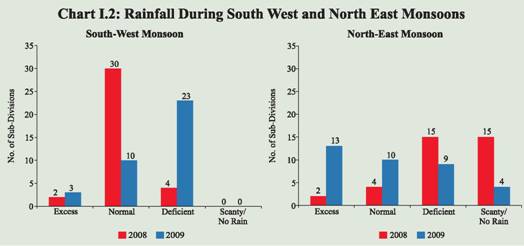
The turnaround in GDP growth witnessed during the first quarter of 2009-10 was sustained during the second quarter, spurred by robust revival in industrial performance and fiscal expenditure driven services activities. The performance of the agricultural sector remained subdued due to the impact of the deficient South-West monsoon, notwithstanding the fact that a major part of the impact would be reflected in the third quarter GDP of the year. The industrial recovery, besides exhibiting acceleration in the last few months, has also become more broad based. Most of the lead indicators of services sector activities also suggest revival in growth momentum. I.1 The Indian economy exhibited robust turnaround in economic growth in the second quarter (Q2) of 2009-10 in relation to the slowdown witnessed during the second half of 2008-09. The recovery in GDP growth that had started in the first quarter (Q1) gained momentum in Q2 of 2009-10, driven by a strong revival in industrial output and better performance of the services sector. According to the estimates of the Central Statistical Organisation (CSO), real GDP growth, which was 6.1 per cent during Q1 of 2009-10, accelerated to 7.9 per cent in Q2 of 2009-10, which was also higher than 7.7 per cent registered during the corresponding period of 2008-09. The better than expected acceleration in the second quarter placed the real GDP growth during the first half of 2009-10 at 7.0 per cent as compared with 7.8 per cent in the corresponding period of 2008-09 (Table 1.1). I.2 The real GDP growth was driven mainly by rebound in industrial and services sector growth, after a period of noticeable fall in the wake of the global recession (Chart I.1). Agriculture sector witnessed a deceleration in growth during the second quarter of 2009-10, partly reflecting the impact of deficient South-West monsoon. Agricultural Situation I.3 The South-West monsoon (June-September), which significantly influences the rain dependent production of kharif crops, was the weakest in 2009 since 1972. The cumulative rainfall during the season turned out to be 23 per cent below normal, as against 2 per cent below normal during the corresponding period of the previous year. Drought was declared in 316 districts across 13 States, either partially or wholly. The North-East monsoon (October to December 2009) has, however, been satisfactory, with the cumulative rainfall being 8 per cent above normal as compared to 31 per cent below normal during the corresponding period of the previous year. Of the 36 meteorological sub-divisions, cumulative rainfall during North-East monsoon was deficient/scanty/no rain in 13 subdivisions (30 sub-divisions during the previous year) (Chart I.2). Reservoir levels, an important indicator for making an assessment about agricultural production linked to irrigation, have improved from their lows of around 9 per cent of Full Reservoir Level (FRL) recorded in early July 2009. As on January 14, 2010, the total live water storage was 48 per cent of the FRL as against 49 percent during the corresponding period of the preceding year and an average of 46 per cent during the past 10 years.
I.4 The deficient South-West monsoon, along with drought conditions in several parts of the country, adversely impacted thekharif sowing, which was about 5.3 per cent lower than the preceding year’s sowing. Apart from shortfall in the area sown, erratic rainfall and flash floods in certain states could also have affected the kharif yield. The delayed withdrawal of SouthWest monsoon and the resultant highermoisture retention in the soil, facilitated early rabi sowing. Also on account of the good North-East monsoon, the area sown under rabi crops (up to January 15, 2010) has been close to last year’s levels. Sowing has been particularly high in respect of rice, wheat and pulses (Table 1.2).
I.5 Based on the record level of 233.9 million tonnes of foodgrains production achieved during 2008-09, a target of 239.1 million tonnes was set for 2009-10. According to the revised First Advance Estimates for 2009-10 released by the Ministry of Agriculture, however, total kharif foodgrains and oilseeds production is estimated to decline by 15.9 per cent over the previous year, reflecting the impact of deficient monsoon (Table 1.3). Crop wise, a decline is expected for all crops, except urad, tur and cotton. However, the overall rabi production prospects are promising this year in view of the delayed withdrawal of SouthWest monsoon, good progress of North-East monsoon and improved sowing, particularly for foodgrains, supported by planned Government efforts towards enhancing rabi production. It could be expected that rabi production may partially compensate for lower kharif production this year, as in 2008-09. The Government has also indicated that rabi season might see an additional 10 million tonnes of production comprising 8.5 million tonnes of foodgrains and 1.5 million tonnes of oilseeds. The Government’s recent hike (in the month of October) in the minimum support price (MSP) for the rabi crops is likely to incentivise rabi crop production. The estimated decline in kharif output in 2009-10 and MSP increases in recent years have, however, contributed to firming up the pressure on food inflation. In terms of agricultural growth, the sector could also be expected to derive support from the ‘allied sector’ comprising horticulture, livestock and fisheries, which has been growing at above 5 per cent in recent years.
Food Management I.6 The procurement of foodgrains (rice and wheat) during 2009-10 (up to January 18, 2010) was higher than that during the corresponding period of the previous year (Table 1.4). The total stock of foodgrains with the Food Corporation of India (FCI) and other Government agencies reached a peak of 54.8 million tonnes as on June 1, 2009. Since then, the stocks have declined on account of off-take exceeding the procurement. As on January 1, 2010, stocks were placed at 47.7 million tonnes, with both rice and wheat stocks significantly higher than their norms. While off-take during April-September 2009 was mainly through targeted public distribution system (TPDS) and other welfare schemes, for the period October to December 2009, the Government had allocated about 1.5 million tonnes of wheat and 0.5 million tonnes of rice for open market sale, keeping in view the sustained pressure on inflation in food articles. Similar quantities have also been approved for release to the open market in the January-March 2010 quarter. The Government has also recently announced additional ad hoc allocations of 1.1 million tonnes of rice and 2.5 million tonnes of wheat under TPDS for the period January-February 2010.
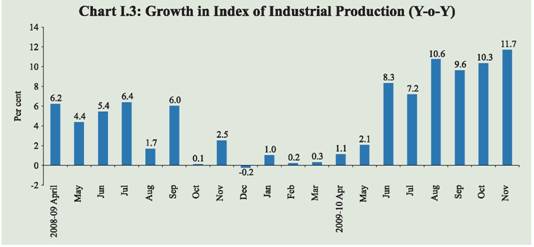
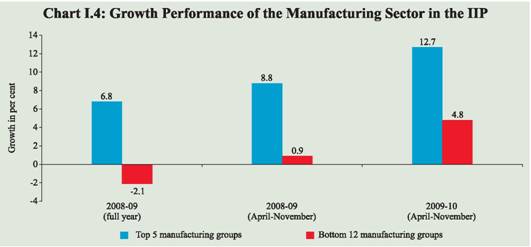
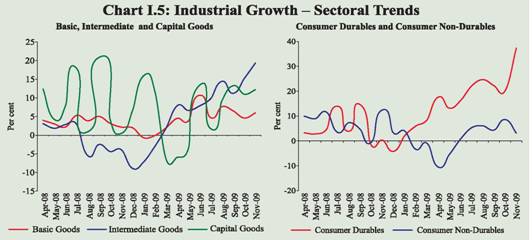
Industrial Performance I.7 Industrial growth, which had slowed down significantly during the second half of 2008-09, exhibited strong recovery during 2009-10, especially sinceJune 2009. The index of industrial production (IIP) posted double digit growth during August, October and November 2009, suggesting acceleration in the recovery process. During 2009-10 (April-November 2009), industrial growth was at 7.6 per cent, significantly higher than 4.1 per cent during the corresponding period of last year (Chart I.3 and Table 1.5). The recovery was led by manufacturing sector, with a relative contribution of around 86 per cent to the overall industrial growth, commensurately supported by the mining and electricity segments. Although 12 out of 17 manufacturing industries under the two-digit classification (accounting for 57.2 per cent of the weight in the IIP) contributed to the growth in IIP, the acceleration in growth has been skewed (Table 1.6). The top five of the 17 manufacturing industries, with a combined weight of 24.1 per cent in IIP, grew by 12.7 per cent and contributed 60.3 per cent of the IIP growth during April-November 2009 (Chart I.4). This suggests that there is scope for further acceleration as the recovery becomes more broad based.
I.8 In terms of use-based classification, there was sharp acceleration in the growth of basic goods, intermediate goods and consumer durables during April-November 2009. The recovery began with a steady acceleration in growth of the intermediate goods sector during the current financial year. This was followed by the recovery in capital goods sector, to a growth of 11.4 percent during August-November 2009, from the decline in output during March-May 2009, indicating an improvement in investment sentiments. Consumer non-durables output witnessed growth since July 2009, despite being weighed down by the decline in food products, beverages and tobacco products and jute and other vegetable fibre textiles (except cotton). The overall growth in the consumer goods during April-November 2009-10 has been driven by a sharp double digit growth in the durable segment, with significant contribution coming from automobiles production.
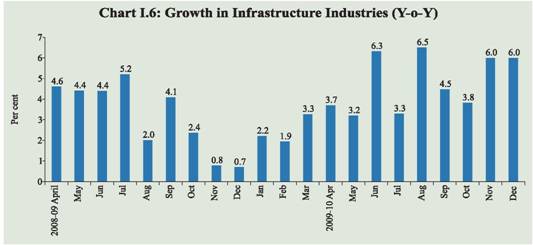
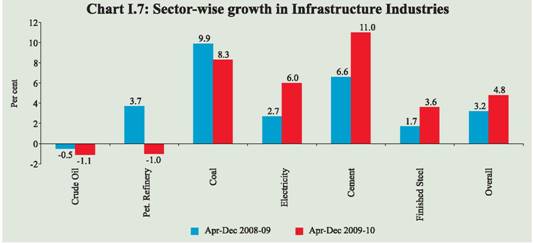
Infrastructure I.9 The core infrastructure growth was higher at 4.8 per cent during April-December 2009 as compared with 3.2 per cent during the corresponding period of the previous year. This was led by improved growth in the output of cement, coal, electricity generation and finished steel. Finished steel production gained strength during October-December 2009, partly reflecting improved automobiles production and pick up in construction activities in recent months as well as the base effect of decline in steel production a year ago. The output of crude oil and petroleum refinery products declined during April-December 2009 over the corresponding period of the previous year. While the petroleum products segment, which witnessed some recovery since August 2009, decelerated in December 2009, the crude oil sector posted a modest recovery, reversing the declining trend in recent months (Charts I.6 and I.7).
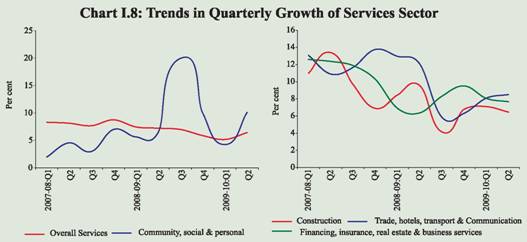
Services Sector I.10 The growth in services sector activities moderated to 8.3 per cent in the first half of 2009-10, from 9.9 per cent in the first half of 2008-09 and 8.9 per cent during the second half of 2008-09. The deceleration in the growth of ‘construction’ and ‘trade, hotels, transports & communications’ have mainly contributed to the overall moderation of the services sector growth. I.11 Within the first half of 2009-10, the second quarter growth at 9.0 per cent shows significant acceleration over the 7.7 per cent growth in the first quarter besides showing a reversal in the trend of continuous deceleration over past few quarters. The upturn in Q2 of 2009-10 was largely contributed by ‘community, personal & social services’ sub-group, reflecting payouts of arrears by the Government under the Sixth Pay Commission award. Excluding the arrears, the growth in services sector would be about 7.0 per cent during the second quarter of 2009-10 (Chart I.8). The overall GDP growth of 7.9 per cent would also work out to be lower at 6.5 per cent, adjusted for the impact of arrears.
I.12 The lead indicators of service sector activity show that, services such as tourist arrivals, cargo handled by seaports and airports, and passengers handled by international terminals which are dependent on external demand, either registered a decline or exhibited subdued growth during 2009-10 so far, reflecting the global economic conditions. However, there has been a significant improvement in these services during the third quarter of 2009. Services dependent on domestic demand have exhibited a robust and steady growth during 2009-10, so far (Table 1.7).
I.13 In sum, the aggregate supply conditions as reflected in the GDP growth during the first two quarters of 2009-10 show acceleration in recovery, led by the industrial performance and fiscal expenditure driven services. The agricultural sector witnessed lower than expected order of deceleration in growth during the second quarter of 2009-10, as only part of the impact of the deficient South-West monsoon on kharif production has been captured in the Q2 GDP estimates, and the remaining part would be reflected in the GDP for Q3 of 2009-10. Favourable prospects for rabi output may partially offset the dampening impact of lower kharif output. The recovery in industrial growth has been uniform with accelerated growth seen in recent months in all the three sectors, viz., mining, electricity and manufacturing. Core infrastructure sector also registered higher growth in April-December 2009 than during the corresponding period of the previous year. Major lead indicators of service sector activities indicate acceleration in the growth momentum, particularly since Q2 of 2009-10. |
||||||||||||||||||||||||||||||||||||||||||||||||||||||||||||||||||||||||||||||||||||||||||||||||||||||||||||||||||||||||||||||||||||||||||||||||||||||||||||||||||||||||||||||||||||||||||||||||||||||||||||||||||||||||||||||||||||||||||||||||||||||||||||||||||||||||||||||||||||||||||||||||||||||||||||||||||||||||||||||||||||||||||||||||||||||||||||||||||||||||||||||||||||||||||||||||||||||||||||||||||||||||||||||||||||||||||||||||||||||||||||||||||||||||||||||||||||||||||||||||||||||||||||||||||||||||||||||||||||||||||||||||||||||||||||||||||||||||||||||||||||||||||||||||||||||||||||||||||||||||||||||||||||||||||||||||||||||||||||||||||||||||||||||||||||||||||||||||||||||||||||||||||||||||||||||||||||||||||||||||||||||||||||||||||||||||||||||||||||||||||||||||||||||||||||||||||||||||||||||||||||||||||||||||||||||||||||||||||||||||||||||||||||||||||||||||||||||||||||||||||||||||||||||||||||||||||||||||||||||||||||||||||||||||||||||||||||||||||||||||||||||||||

এই পৃষ্ঠাটো শ্বেয়াৰ কৰক:


ভাৰতীয় ৰিজাৰ্ভ বেংক মোবাইল এপ্পলিকেষ্যন ইনষ্টল কৰক আৰু নৱীনতম বাতৰিৰ প্ৰৱেশাধিকাৰ পাওক!


