The data on India’s balance of payments (BoP) are compiled and published by the Reserve Bank on a quarterly basis with a lag of one quarter. Accordingly the preliminary data on India’s BoP for the third quarter (Q3) of the financial year 2008-09, i.e., October-December 2008 was compiled and released by the Reserve Bank on March 31, 2009. The developments in India’s BoP for October-December 2008 quarter and April-December 2008 are presented here.
Major Highlights of BoP for October-December (Q3) of 2008-09
(i) Export growth turned negative during Q3 of 2008-09 for the first time after 2001-02 due to global economic slowdown.
(ii) Import growth on BoP basis decelerated to a single digit during Q3 of 2008-09 after a gap of almost 6 years mainly led by lower crude oil prices and non-oil imports.
(iii) Private transfer receipts declined only marginally during the quarter despite slowdown in economic activities in Gulf countries and in the advanced economies like the US and European countries.
(iv) Even with the deepening of the global economic crisis, software exports recorded a growth of around 12 per cent during Q3 of 2008-09.
(v) The current account deficit at US$ 14.6 billion during Q3 of 2008-09 was the highest quarterly deficit since 1990.
(vi) For the first time since Q1 of 1998-99, the capital account balance turned negative during Q3 of 2008-09 mainly due to net outflows under portfolio investment, banking capital and short-term trade credit. (vii) There was, however, a turnaround in the net inflows under the non-resident Indian (NRI) deposits in Q3 of 2008-09 responding to the hike in ceiling interest rates on NRI deposits.
(viii) The foreign exchange reserves on BoP basis (i.e., excluding valuation) declined due to widening of current account deficit combined with net outflows under the capital account. The largest decline in reserves during any one quarter in earlier years at US$ 4.7 billion was last observed in Q3 of 2005-06. * Prepared in the Division of International Finance, Department of Economic Analysis and Policy, Reserve Bank of India, 1. Balance of Payments for October-December (Q3) of 2008
The major items of the BoP for the third quarter (Q3) of 2008-09 are set out below in Table 1 .
Merchandise Trade
(i) On a BoP basis, India’s merchandise exports recorded a decline of 10.4 per cent in Q3 of 2008-09 as against an increase of 33.0 per cent in Q3 of 2007-08.
(ii) As per the commodity-wise data released by the Directorate General of Commercial Intelligence and Statistics (DGCI&S) for the period October-November 2008, merchandise exports declined by 16.3 per cent, reflecting a fall in exports of all commodity groups except engineering goods. Amongst the commodities, exports of rice, raw cotton, sugar and molasses, iron ore, iron and steel, gems and jewellery showed maximum fall in export growth during this period.
(iii) Import payments, on a BoP basis, registered a lower growth of 8.9 per cent in Q3 of 2008-09 as compared to a high growth of 41.9 per cent in Q3 of 2007-08. According to the data released by the DGCI&S, the slowdown in import growth is mainly attributed to decline in oil import payments due to sharp fall in oil prices during October-December 2008.
Table 1 : Major Items of India’s Balance of Payments |
(US$ million) |
Item |
April-June |
July-September |
October-December |
2007-08 (PR) |
2008-09 (PR) |
2007-08 (PR) |
2008-09 (PR) |
2007-08 (PR) |
2008-09 (P) |
1 |
2 |
3 |
4 |
5 |
6 |
7 |
1. |
Exports |
34,356 |
49,120 |
38,273 |
47,700 |
40,985 |
36,707 |
2. |
Imports |
56,346 |
79,637 |
59,510 |
86,213 |
67,038 |
73,014 |
3. |
Trade Balance (1-2) |
-21,990 |
-30,517 |
-21,237 |
-38,513 |
-26,053 |
-36,307 |
4. |
Invisibles, net |
15,310 |
21,521 |
16,940 |
25,684 |
21,522 |
21,663 |
5. |
Current Account Balance (3+4) |
-6,680 |
-8,996 |
-4,297 |
-12,829 |
-4,531 |
-14,644 |
6. |
Capital Account Balance* |
17,880 |
11,231 |
33,533 |
8,095 |
31,269 |
-3,237 |
7. |
Change in Reserves#
(-Indicates increase; + indicates decrease) |
-11,200 |
-2,235 |
-29,236 |
4,734 |
-26,738 |
17,881 |
*: Including errors and omissions. #: On BoP basis (i.e., excluding valuation).
P: Preliminary. PR: Partially Revised. |
(iv) The commodity-wise break up of imports data released by the DGCI&S revealed negative growth in imports of certain commodities like capital goods, non-ferrous metals, artificial resins and plastic materials, textile yarn and medicinal and pharmaceutical products along with a decline in oil imports leading to a lower import growth of 2.3 per cent during October-November 2008 as compared with 29.3 per cent during the corresponding period of previous year.
Trade Deficit
(i) Consequent upon a negative export growth, the trade deficit on a BoP basis was higher at US$ 36.3 billion during Q3 of 2008-09 (US$ 26.1 billion in Q3 of 2007-08).
Invisibles
(i) Both invisibles receipts and payments recorded negative growth, though marginal, during Q3 of 2008-09 reflecting the impact of global economic slowdown.
(ii) Invisibles receipts registered a marginal decline of 0.6 per cent in Q3 of 2008-09 (as against an increase of 33.2 per cent in Q3 of 2007-08) on account of a decline in travel, transportation and insurance receipts in the services category and private transfers and investment income receipts. Overall services exports, however, witnessed a marginal increase of 0.5 per cent during the quarter (compared with a higher growth of 33.4 per cent in Q3 of 2007-08) due to increase in software exports.
(iii) Private transfer receipts declined marginally during Q3 of 2008-09. Software services receipts, on the other hand, increased by 11.8 per cent during the quarter.
(iv) Invisibles payments also recorded a marginal negative growth of 2.1 per cent during Q3 of 2008-09 mainly led by sharp decline in payments under travel, software and business services account. There was also a marginal decline in payments under investment income in the form of interest payments and dividends.
(v) With the decline in invisibles payments higher than the receipts, the net invisibles (invisibles receipts minus invisibles payments) rose moderately to US$ 21.7 billion in Q3 of 2008-09 (Table 2). At this level, net invisibles surplus financed 59.7 per cent of trade deficit in Q3 of 2008-09 (82.6 per cent in Q3 of 2007-08).
Current Account Deficit
(i) On account of large trade deficit and with moderate increase in net invisibles, the current account deficit rose sharply to US$ 14.6 billion in Q3 of 2008-09 (US$ 4.5 billion in Q3 of 2007-08). This level of CAD was the highest quarterly deficit since 1990.
Table 2 : Net Invisibles |
(US$ million) |
Item |
April-June |
July-September |
October-December |
2007-08 (PR) |
2008-09 (PR) |
2007-08 (PR) |
2008-09 (PR) |
2007-08 (PR) |
2008-09 (P) |
1 |
|
2 |
3 |
4 |
5 |
6 |
7 |
A. |
Services (1 to 5) |
8,974 |
10,746 |
8,998 |
13,590 |
12,026 |
12,797 |
| |
1.Travel |
182 |
340 |
201 |
82 |
876 |
935 |
| |
2.Transportation |
-573 |
-798 |
-468 |
-844 |
-244 |
-679 |
| |
3.Insurance |
188 |
122 |
57 |
58 |
177 |
75 |
| |
4.Govt. not included elsewhere |
-16 |
20 |
-60 |
-14 |
15 |
-136 |
| |
5.Miscellaneous |
9,193 |
11,062 |
9,268 |
14,308 |
11,202 |
12,602 |
| |
Of which: |
|
|
|
|
|
|
| |
Software |
8,157 |
10,799 |
8,249 |
11,296 |
8,756 |
10,164 |
| |
Non-Software |
1,036 |
263 |
1,019 |
3,012 |
2,446 |
2,438 |
B. |
Transfers |
8,196 |
11,649 |
9,300 |
12,887 |
10,935 |
10,540 |
| |
Private |
8,208 |
11,612 |
9,254 |
12,936 |
10,861 |
10,356 |
| |
Official |
-12 |
37 |
46 |
-49 |
74 |
184 |
C. |
Income |
-1,860 |
-874 |
-1,358 |
-793 |
-1,439 |
-1,674 |
| |
Investment Income |
-1,745 |
-699 |
-1,170 |
-751 |
-1,278 |
-1,535 |
| |
Compensation of employees |
-115 |
-175 |
-188 |
-42 |
-161 |
-139 |
Invisibles (A+B+C) |
15,310 |
21,521 |
16,940 |
25,684 |
21,522 |
21,663 |
P: Preliminary. PR: Partially Revised. |
Capital Account and Reserves
(i) Capital account balance turned negative showing outflows of US$ 3.7 billion during the Q3 of 2008-09 (net inflows at US$ 31.0 billion during Q3 of 2007-08) for the first time since Q1 of 1998-99 mainly due to net outflows under portfolio investment, banking capital and short-term trade credit ( Table 3 ).
(ii) The gross capital inflows to India during Q3 of 2008-09 amounted to US$ 70.0 billion (US$ 127.3 billion in Q3 of 2007-08) as against gross outflows from India at US$ 73.6 billion (US$ 96.3 billion in Q3 of 2007-08). Other components of the capital account which recorded a fall during the quarter were inflows and outflows under foreign direct investment and external commercial borrowings, while inflows under short-term trade credit also declined during the quarter.
(iii) Net FDI flows (net inward FDI minus net outward FDI) amounted to US$ 0.8 billion in Q3 of 2008-09 (US$ 2.0 billion in Q3 of 2007-08). Net inward FDI stood at US$ 6.7 billion during Q3 of 2008-09 (US$ 7.9 billion in Q3 of 2007-08). Net outward FDI remained buoyant at US$ 5.9 billion in Q3 of 2008-09 (US$ 5.8 billion in Q3 of 2007-08).
(iv) Portfolio investment primarily comprising foreign institutional investors’ (FIIs) investments and American Depository Receipts (ADRs)/ Global Depository Receipts (GDRs) continued to witness net outflows at US$ 5.8 billion in Q3 of 2008-09 (as against net inflows of US$ 14.9 billion in Q3 of 2007-08). Outflows under portfolio investment were led by large sales of equities by FIIs in the Indian stock market and slowdown in net inflows under ADRs/GDRs due to drying-up of liquidity in the overseas market. Another feature observed in the context of portfolio flows was that not only net flows remained negative but both inflows as well as outflows reduced sharply during the quarter.
Table 3 : Net Capital Flows |
(US$ million) |
Item |
April-June |
July-September |
October-December |
2007-08 (PR) |
2008-09 (PR) |
2007-08 (PR) |
2008-09 (PR) |
2007-08 (PR) |
2008-09 (P) |
1 |
2 |
3 |
4 |
5 |
6 |
7 |
1. |
Foreign Direct Investment |
2,736 |
8,989 |
2,128 |
5,564 |
2,041 |
820 |
| |
Inward FDI |
7,457 |
11,891 |
4,709 |
8,782 |
7,873 |
6,684 |
| |
Outward FDI |
4,721 |
2,902 |
2,581 |
3,218 |
5,832 |
5,864 |
2. |
Portfolio Investment |
|
|
|
|
|
|
| |
of which |
7,542 |
-4,211 |
10,899 |
-1,310 |
14,851 |
-5,820 |
| |
FIIs |
7,089 |
-5,177 |
8,419 |
-1,438 |
8,964 |
-5,794 |
| |
ADRs/GDRs |
316 |
999 |
2,477 |
136 |
5,597 |
7 |
3. |
External Assistance |
241 |
351 |
468 |
518 |
565 |
992 |
4. |
External Commercial Borrowings |
6,953 |
1,480 |
4,210 |
1,751 |
6,247 |
3,883 |
5. |
NRI Deposits |
-447 |
814 |
369 |
259 |
-853 |
1,042 |
6. |
Banking Capital excluding NRI Deposits |
-472 |
1,882 |
6,274 |
1,872 |
1060 |
-5,998 |
7. |
Short-term Trade Credit |
1,962 |
2,397 |
4,627 |
1292 |
4,130 |
-3,142 |
8. |
Rupee Debt Service |
-43 |
-30 |
-2 |
-3 |
0 |
0 |
9. |
Other Capital |
-680 |
-549 |
4,182 |
-2,091 |
2,976 |
4,540 |
Total (1 to 9) |
17,792 |
11,123 |
33,155 |
7,852 |
31,017 |
-3,683 |
P: Preliminary. PR: Partially Revised. |
(v) Net External Commercial Borrowings (ECBs) remained lower at US$ 3.9 billion in Q3 of 2008-09 (US$ 6.2 billion in Q3 of 2007-08) due to drying up of liquidity abroad and increased cost of borrowings.
(vi) Short-term trade credit to India witnessed a net outflow of US$ 3.1 billion (as against inflows of US$ 4.1 billion in Q3 of 2007-08) mainly due to lower disbursements reflecting tightness in the overseas market and increased repayments as roll over was difficult.
(vii) There was a turnaround in the inflows under the non-resident Indian (NRI) deposits to US$ 1.0 billion during Q3 of 2008-09 (outflow of US$ 0.9 billion during Q3 of 2007-08) responding to the hike in ceiling interest rates on NRI deposits.
(viii) The foreign exchange reserves on BoP basis (i.e., excluding valuation) declined sharply by US$ 17.9 billion in Q3 of 2008-09 as against an accretion of reserves of US$ 26.7 billion in Q3 of 2007-08. The decline in the reserves was due to widening of current account deficit combined with outflows under the capital account. The largest decline in reserves on a BoP basis during any one quarter in earlier years at US$ 4.7 billion was observed in the Q3 of 2005-06. Even during the balance of payments crisis of the early 1990s, a decline of US$ 1.5 billion was seen in the third quarter (October-December 1990), while a decline of US$ 1.1 billion was observed during April-June 1991.
2. Balance of Payments (BoP) for April-December 2008
(i) As mentioned earlier, taking into account the partially revised data for Q1 and Q2 of 2008-09 and the preliminary data for Q3 of 2008-09, the BoP data for April-December 2008 have been compiled. While the detailed data are set out in Statements I and II in the standard format of BoP presentation, the major items are presented in Table 4.
Merchandise Trade
(i) On a BoP basis, India’s merchandise exports posted a growth of 17.5 per cent during April-December 2008 (21.9 per cent in the corresponding period of the previous year).
(ii) According to the commodity-wise data available for April-November 2008 from the DGCI&S, the exports of engineering goods and petroleum products showed high growth, while growth in textile products, ores and minerals, and gems and jewellery registered sharp slowdown. The exports of marine products, raw cotton, iron ore and handicrafts declined during the period.
(iii) Import payments, on a BoP basis, remained higher and recorded a growth of 30.6 per cent during April-December 2008 as compared with 28.3 per cent in the corresponding period of the previous year.
Table 4 : Major Items of India’s Balance of Payments |
(US$ million) |
Item |
April-March |
April-December |
2006-07 |
2007-08 (PR) |
2007-08 (PR) |
2008-09 (P) |
1 |
2 |
3 |
4 |
5 |
1. |
Exports |
128,888 |
166,163 |
113,614 |
133,527 |
2. |
Imports |
190,670 |
257,789 |
182,894 |
238,864 |
3. |
Trade Balance (1-2) |
-61,782 |
-91,626 |
-69,280 |
-105,337 |
4. |
Invisibles, net |
52,217 |
74,592 |
53,772 |
68,868 |
5. |
Current Account Balance (3+4) |
-9,565 |
-17,034 |
-15,508 |
-36,469 |
6. |
Capital Account Balance* |
46,171 |
109,198 |
82,682 |
16,089 |
7. |
Change in Reserves#
(-Indicates increase; + indicates decrease) |
-36,606 |
-92,164 |
-67,174 |
20,380 |
* : Including errors and omissions. # : On BoP basis (i.e., excluding valuation)
P: Preliminary. PR: Partially Revised. |
(iv) According to the DGCI&S data, while oil imports recorded a significant growth of 43.3 per cent in April-December 2008 (24.0 per cent in the corresponding period of the previous year), growth in non-oil imports slowed down to 25.0 per cent from 29.3 per cent in the corresponding period of the previous year. In absolute terms, oil imports accounted for about 34.7 per cent of total imports during April-December 2008 (31.7 per cent in the corresponding period of the previous year).
(v) According to the DGCI&S data, out of the total increase in imports of US$ 52.8 billion in April-December 2008 over the corresponding period of the previous year, oil imports contributed an increase of US$ 23.6 billion (44.6 per cent as against 28.4 per cent in April-December 2007), while non-oil imports contributed an increase of US$ 29.2 billion (55.4 per cent as against 71.6 per cent in April-December 2007).
(vi) According to the commodity-wise DGCI&S data available for April-November 2008, the items under non-oil imports which showed a high growth were fertilizers, paper and paper products, manufactures of metals, project goods, export related items like pearls, precious and semiprecious stones, chemicals, and coal, coke and briquettes, while imports of items like pulses, electronic goods, and gold and silver declined.
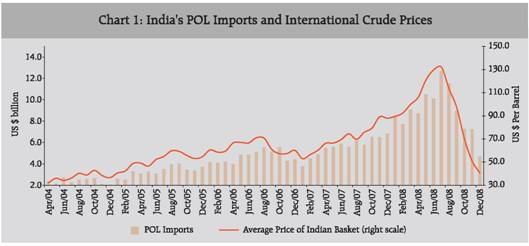
(vii) The sharp increase in oil imports reflected the impact of the increase in oil price of the Indian basket of international crude (a mix of Oman, Dubai and Brent varieties), which had increased to an average of US$ 132.5 per barrel in July 2008, but came down subsequently to an average of US$ 40.6 per barrel in December 2008. The average oil prices were higher at US$ 95.5 per barrel in April-December 2008 as compared with an average of US$ 74.7 per barrel in the corresponding period of the previous year (Chart 1).
Trade Deficit
(i) On a BoP basis, the merchandise trade deficit widened sharply to US$ 105.3 billion during April-December 2008 from US$ 69.3 billion in April-December 2007 on account of higher growth in imports coupled with the slowdown in exports (Chart 2).
Invisibles
Invisibles Receipts
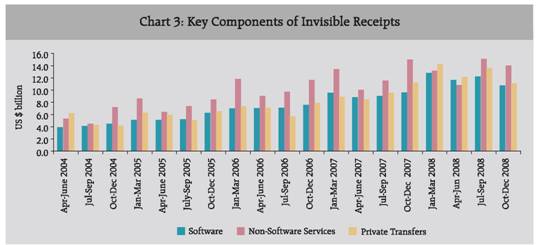
(i) Invisibles receipts witnessed a lower growth of 18.8 per cent during April-December 2008 (30.1 per cent in the corresponding period of the previous year) mainly due to slow pace of growth in travel, business services and investment income receipts (Table 5 and Chart 3 ).
(ii) Travel receipts at US$ 8.2 billion during April-December 2008 rose moderately by 6.2 per cent (26.2 per cent in April-December 2007) reflecting slowdown in tourist arrivals in the country.
(iii) Private transfers are mainly in the form of (i) Inward remittances from Indian workers abroad for family maintenance, (ii) Local withdrawal from NRI Rupee deposits, (iii) Gold and silver brought through passenger baggage, and (iv) Personal gifts/ donations to charitable/religious institutions.
(iv) Private transfer receipts, comprising mainly remittances from Indians working overseas, increased to US$ 36.9 billion in April-December 2008 from US$ 29.3 billion in the corresponding period of the previous year. Private transfer receipts constituted 14.4 per cent of current receipts in April-December 2008 (13.5 per cent in the corresponding period of the previous year).
(v) NRI deposits when withdrawn domestically, form part of private transfers because once withdrawn for local use these become unilateral transfers and do not have any quid pro quo. Such local withdrawals/ redemptions from NRI deposits cease to exist as liability in the capital account of the balance of payments and assume the form of private transfers, which is included in the current account of balance of payments.
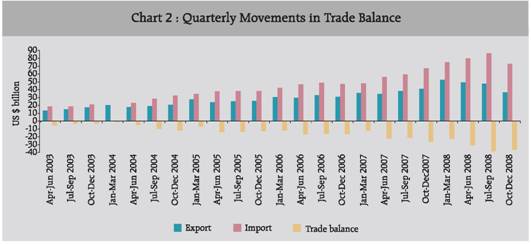
Table 5 : Invisibles Gross Receipts and Payments |
(US $ million) |
Item |
Invisibles Receipts |
Invisibles Payments |
April-March |
April-December |
April-March |
April-December |
2006-07 |
2007-08 (PR) |
2007-08 (PR) |
2008-09 (P) |
2006-07 |
2007-08 (PR) |
2007-08 (PR) |
2008-09 (P) |
1 |
2 |
3 |
4 |
5 |
6 |
7 |
8 |
9 |
A. |
Services (1 to 5) |
73,780 |
90,077 |
64,095 |
74,532 |
44,311 |
52,512 |
34,097 |
37,399 |
| |
1.Travel |
9,123 |
11,349 |
7,731 |
8,214 |
6,684 |
9,254 |
6,472 |
6,857 |
| |
2.Transportation |
7,974 |
10,014 |
6,843 |
7,961 |
8,068 |
11,514 |
8,128 |
10,282 |
| |
3.Insurance |
1,195 |
1,639 |
1,152 |
1,058 |
642 |
1,044 |
730 |
803 |
| |
4.Govt. not included elsewhere |
253 |
330 |
252 |
308 |
403 |
376 |
313 |
438 |
| |
5.Miscellaneous |
55,235 |
66,745 |
48,117 |
56,991 |
28,514 |
30,324 |
18,454 |
19,019 |
| |
Of which: |
|
|
|
|
|
|
|
|
| |
Software |
31,300 |
40,300 |
27,494 |
34,620 |
2,267 |
3,058 |
2,332 |
2,361 |
| |
Non-Software |
23,935 |
26,445 |
20,623 |
22,371 |
26,247 |
27,266 |
16,122 |
16,658 |
B. |
Transfers |
31,470 |
44,259 |
29,764 |
37,413 |
1,391 |
2,315 |
1,333 |
2,337 |
| |
Private |
30,835 |
43,506 |
29,258 |
36,929 |
1,010 |
1,801 |
935 |
2,025 |
| |
Official |
635 |
753 |
506 |
484 |
381 |
514 |
398 |
312 |
C. |
Income |
9,308 |
14,268 |
9,587 |
10,909 |
16,639 |
19,185 |
14,244 |
14,250 |
| |
Investment |
|
|
|
|
|
|
|
|
| |
income |
8,926 |
13,808 |
9,288 |
10,273 |
15,688 |
18,089 |
13,481 |
13,258 |
| |
Compensation of employees |
382 |
460 |
299 |
636 |
951 |
1,096 |
763 |
992 |
Invisibles (A+B+C) |
114,558 |
148,604 |
103,446 |
122,854 |
62,341 |
74,012 |
49,674 |
53,986 |
P: Preliminary. PR: Partially Revised.
Note: Details of Non-software services under Miscellaneous (Item 5) are given in Table 8. |
(vi) Under the NRI deposits, both inflows as well as outflows remained large in the recent past. A major part of outflows from NRI deposits is in the form of local withdrawals. These withdrawals, however, are not actually repatriated but are utilized domestically. During April-December 2008, the share of local withdrawals in total outflows from NRI deposits declined to 63.3 per cent from 64.6 per cent in April-December 2007, reflecting higher outflows under FCNR (B) accounts (Table 6).
(vii) Under Private transfers, the inward remittances for family maintenance accounted for about 50.4 per cent of the total private transfer receipts, while local withdrawals accounted for about 44.0 per cent in April-December 2008 as against 49.7 per cent and 43.3 per cent, respectively, in April-December 2007 (Table 7).
(viii) Software receipts at US$ 34.6 billion showed a steady growth of 26 per cent in April-December 2008. The NASSCOM has projected a growth rate of 16-17 per cent during 2008-09 with a target of software services export revenues at around US$ 47 billion for the financial year.
Table 6 : Inflows and Outflows from NRI Deposits and Local Withdrawals |
(US$ million) |
Year |
Inflows |
Outflows |
Local Withdrawals |
1 |
2 |
3 |
4 |
2006-07 |
19,914 |
15,593 |
13,208 |
2007-08 (PR) |
29,401 |
29,222 |
18,919 |
April-December 2007 (PR) |
18,683 |
19,614 |
12,669 |
April-December 2008 (P) |
27,760 |
25,645 |
16,236 |
P: Preliminary. PR: Partially Revised. |
(ix) Miscellaneous receipts, excluding software exports, stood at US$ 22.4 billion in April-December 2008 (US$ 20.6 billion in April-December 2007). The break-up of these data is presented in Table 8.
(x) The key components of the business services receipts and payments were mainly the trade related services, business and management consultancy services, architectural, engineering and other technical services, and services relating to maintenance of offices abroad. These reflect the underlying momentum in trade of professional and technology related services. While receipts under trade related and business and management consultancy services increased, the receipts under architectural, engineering, and other technical services declined during April-December 2008 (Table 9).
Table 7 : Details of Private Transfers to India |
(US $ million) |
Year |
Total Private Transfers |
Of Which: |
Inward remittances for family maintenance |
Local withdrawals/ redemptions from NRI Deposits |
Amount |
Percentage Share in Total |
Amount |
Percentage Share in Total |
1 |
2 |
3 |
4 |
5 |
6 |
2006-07 |
30,835 |
14,740 |
47.8 |
13,208 |
42.8 |
2007-08 (PR) |
43,506 |
21,920 |
50.4 |
18,919 |
43.5 |
April-December 2007 (PR) |
29,258 |
14,536 |
49.7 |
12,669 |
43.3 |
April-December 2008 (P) |
36,929 |
18,616 |
50.4 |
16,236 |
44.0 |
P: Preliminary. PR: Partially Revised. |
Table 8 : Break-up of Non-Software Receipts and Payments under Miscellaneous Services |
(US $ million) |
Item |
Receipts |
Payments |
April-March |
April-December |
April-March |
April-December |
2006-07 |
2007-08 (PR) |
2007-08 (PR) |
2008-09 (P) |
2006-07 |
2007-08 (PR) |
2007-08 (PR) |
2008-09 (P) |
1 |
2 |
3 |
4 |
5 |
6 |
7 |
8 |
9 |
1. |
Communication Services |
2,262 |
2,408 |
1,727 |
1,797 |
796 |
859 |
594 |
739 |
2. |
Construction |
700 |
763 |
559 |
517 |
737 |
758 |
520 |
518 |
3. |
Financial |
3,106 |
3,217 |
2,326 |
3,390 |
2,991 |
3,138 |
1,914 |
2,328 |
4. |
News Agency |
334 |
503 |
368 |
617 |
226 |
326 |
269 |
275 |
5. |
Royalties, Copyrights & License Fees |
97 |
157 |
111 |
101 |
1,030 |
1,088 |
771 |
1,261 |
6. |
Business Services |
14,544 |
16,771 |
12,240 |
12,723 |
15,866 |
16,715 |
10,945 |
9,926 |
7. |
Personal, Cultural, and Recreational |
243 |
562 |
436 |
581 |
117 |
199 |
137 |
235 |
8. |
Others |
2,649 |
2,064 |
2,856 |
2,645 |
4,484 |
4,183 |
972 |
1,376 |
Total (1 to 8) |
23,935 |
26,445 |
20,623 |
22,371 |
26,247 |
27,266 |
16,122 |
16,658 |
P: Preliminary; PR: Partially Revised;
Note: Details of Business Services (item 6) are given in Table 9. |
Table 9 : Details of Business Services |
(US $ million) |
Item |
Receipts |
Payments |
April-March |
April-December |
April-March |
April-December |
2006-07 |
2007-08 (PR) |
2007-08 (PR) |
2008-09 (P) |
2006-07 |
2007-08 (PR) |
2007-08 (PR) |
2008-09 (P) |
1 |
2 |
3 |
4 |
5 |
6 |
7 |
8 |
9 |
1. |
Trade Related |
1,325 |
2,233 |
1,548 |
1,706 |
1,801 |
2,285 |
1,645 |
1,206 |
2. |
Business & Management Consultancy |
4,476 |
4,433 |
3,286 |
3,881 |
3,486 |
3,653 |
2,411 |
1,666 |
3. |
Architectural, Engineering, and other Technical Services |
3,457 |
3,144 |
2,453 |
1,433 |
3,025 |
3,173 |
2,024 |
2,112 |
4. |
Maintenance of offices abroad |
2,638 |
2,861 |
2,086 |
1,981 |
4,032 |
3,496 |
2,125 |
2,169 |
5. |
Others |
2,648 |
4,100 |
2,867 |
3,722 |
3,522 |
4,108 |
2,740 |
2,773 |
Total (1 to 5) |
14,544 |
16,771 |
12,240 |
12,723 |
15,866 |
16,715 |
10,945 |
9,926 |
P: Preliminary. PR: Partially Revised. |
(xi) Investment income receipts amounted to US$ 10.3 billion in April-December 2008 as compared with US$ 9.3 billion in April-December 2007.
Invisibles Payments
(i) Like invisibles receipts, invisibles payments also showed a lower growth of 8.7 per cent in April-December 2008 (13.2 per cent in April-December 2007) mainly on account of slowdown in payments relating to travel, software services and a number of business and professional services.
(ii) Travel payments growth remained lower at 5.9 per cent during April-December 2008 (31.1 per cent in April-December 2007) reflecting a sharp reduction in outbound travels. According to the International Transport Association, international passenger volumes increased marginally by 1.6 per cent in 2008 led by a 1.5 per cent decline for Asia-Pacific region.
(iii) Investment income payments, reflecting mainly the interest payments on commercial borrowings, external assistance and non-resident deposits, and reinvested earnings of the foreign direct investment (FDI) enterprises operating in India declined marginally to US$ 13.3 billion in April-December 2008 (US$ 13.5 billion in the corresponding period of the previous year) mainly due to decline in interest payments on NRI deposits and reinvested earnings of FDI companies in India (Table 10).
Invisibles Balance
(i) Net invisibles (invisibles receipts minus invisibles payments) stood higher at US$ 68.9 billion during April-
Table 10 : Details of Receipts and Payments of Investment Income |
(US $ million) |
Item |
April-March |
April-December |
2006-07 |
2007-08 PR |
2007-08 PR |
2008-09P |
1 |
2 |
3 |
4 |
5 |
A. |
Receipts |
8,926 |
13,808 |
9,288 |
10,273 |
| |
|
Of which: |
|
|
|
|
| |
1. |
Reinvested Earnings on Indian Investment Abroad |
1,076 |
1,084 |
813 |
813 |
| |
2. |
Interest/discount Earnings on Foreign exchange reserves |
6,641 |
10,124 |
6,889 |
8,156 |
B. |
Payments |
15,688 |
18,089 |
13,481 |
13,258 |
| |
Of which: |
|
|
|
|
| |
1. |
Interest Payment on NRI deposits |
1,969 |
1,813 |
1,452 |
1,161 |
| |
2. |
Interest Payment on ECBs |
1,709 |
2,655 |
1,907 |
2,092 |
| |
3. |
Interest Payment on External Assistance |
982 |
1,143 |
842 |
811 |
| |
4. |
Dividends and Profits |
3,486 |
3,576 |
2,660 |
2,728 |
| |
5. |
Reinvested Earnings of FDI companies in India |
5,828 |
7,168 |
5,376 |
4,725 |
C. |
Net Investment Income (A-B) |
-6,762 |
-4,281 |
-4,193 |
-2,985 |
P: Preliminary. PR: Partially Revised. |
December 2008 (US$ 53.8 billion during April-December 2007) mainly led by receipts under private transfers and software services. At this level, the invisibles surplus financed about 65.4 per cent of trade deficit during April-December 2008 as against 77.6 per cent during April-December 2007.
Current Account Deficit
(i) Despite higher net invisibles surplus, the large trade deficit mainly on account of higher growth in imports coupled with slowdown in export growth in the third quarter led to higher current account deficit at US$ 36.5 billion in April-December 2008 (US$ 15.5 billion during April-December 2007) ( Chart 4 ).
Capital Account
(i) The gross capital inflows to India during April-December 2008 decreased to US$ 246.4 billion (US$ 291.8 billion in April-December 2007) as against an increase in outflows to US$ 231.1 billion (US$ 209.8 billion in April-December 2007) (Table 11).
(ii) Net capital flows, however, at US$ 15.3 billion in April-December 2008 remained much lower as compared with US$ 82.0 billion in April-December 2007. Under net capital flows, all the major components except FDI and NRI deposits, showed decline during April-December 2008 from their level in the corresponding period of the previous year (Table 12). The decline was sharp in the case of portfolio flows and short-term trade credits to India.
(iii) Net inward FDI into India remained buoyant at US$ 27.4 billion during April-December 2008 (US$ 20.0 billion in April-December 2007) reflecting relatively better investment climate in India and the continuing liberalization measures to attract FDI. During April-December 2008, FDI was channeled mainly into manufacturing (21.4 per cent) followed by financial services (14.1 per cent) and communication services (12.0 per cent).
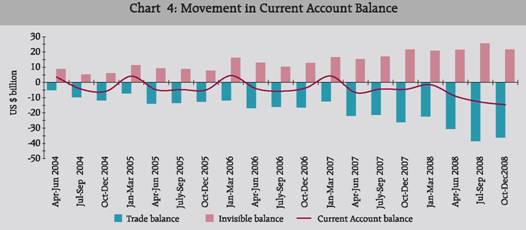
Table 11 : Gross Capital Inflows and Outflows |
(US$ million) |
Item |
Gross Inflows |
Gross Outflows |
April-March |
April-December |
April-March |
April-December |
2006-07 |
2007-08 (PR) |
2007-08 (PR) |
2008-09 (P) |
2006-07 |
2007-08 (PR) |
2007-08 (PR) |
2008-09 (P) |
1 |
2 |
3 |
4 |
5 |
6 |
7 |
8 |
9 |
1. |
Foreign Direct Investment |
23,590 |
36,838 |
22,088 |
28,329 |
15,897 |
21,437 |
15,183 |
12,956 |
2. |
Portfolio Investment |
|
|
|
|
|
|
|
|
| |
Of which: |
109,620 |
235,924 |
161,682 |
109,993 |
102,560 |
206,368 |
128,390 |
121,334 |
| |
FIIs |
105,756 |
226,621 |
152,813 |
108,789 |
102,530 |
206,294 |
128,342 |
121,197 |
| |
ADRs/GDRs |
3,776 |
8,769 |
8,390 |
1,142 |
— |
— |
— |
— |
3. |
External Assistance |
3,767 |
4,241 |
2,824 |
3,659 |
1,992 |
2,127 |
1,550 |
1,798 |
4. |
External Commercial Borrowings |
20,883 |
30,376 |
23,030 |
12,033 |
4,780 |
7,743 |
5,620 |
4,919 |
5. |
NRI Deposits |
19,914 |
29,401 |
18,683 |
27,760 |
15,593 |
29,222 |
19,614 |
25,645 |
6. |
Banking Capital excluding Non Resident Deposits |
17,295 |
26,412 |
16,179 |
25,218 |
19,703 |
14,834 |
9,317 |
27,462 |
7. |
Short-term Trade Credit |
29,992 |
48,911 |
32,180 |
31,350 |
23,380 |
31,728 |
21,461 |
30,803 |
8. |
Rupee Debt Service |
0 |
0 |
0 |
0 |
162 |
121 |
45 |
33 |
9. |
Other Capital |
8,230 |
20,904 |
15,141 |
8,033 |
4,021 |
11,434 |
8,663 |
6,133 |
Total (1 to 9) |
233,291 |
433,007 |
291,807 |
246,375 |
188,088 |
325,014 |
209,843 |
231,083 |
P : Preliminary PR : Partially Revised. |
(iv) Net outward FDI from India continued to remain high at US$ 12.0 billion during April-December 2008 even in the current economic situation. However, it was marginally lower than that of US$ 13.1 billion invested during April-December 2007. Due to large inward FDI, the net FDI (inward FDI minus outward FDI) was higher at US$ 15.4 billion in April-December 2008 as compared with US$ 6.9 billion in April-December 2007.
(v) Portfolio investment comprising mainly foreign institutional investors (FIIs) investments and American Depository Receipts (ADRs)/Global Depository Receipts (GDRs) witnessed large net outflows of US$ 11.3 billion during April-December 2008 (net inflows of US$ 33.3 billion in April-December 2007) due to large sales of equities by FIIs in the Indian stock market reflecting bearish market conditions and slowdown in the global economy. The inflows under ADRs/ GDRs slowed down to US$ 1.1 billion in April-December 2008 (US$ 8.4 billion in April-December 2007).
(vi) Net external commercial borrowings (ECBs) inflow slowed down to US$ 7.1 billion in April-December 2008 (US$ 17.4 billion in April-December 2007) mainly due to tight liquidity conditions in the overseas markets.
(vii) Banking capital (net), including NRI deposits, turned marginally negative to US$ 0.1 billion during April-December
Table 12 : Net Capital Flows |
(US$ million) |
Item |
April-March |
April-December |
2006-07 |
2007-08 (PR) |
2007-08 (PR) |
2008-09 (P) |
1 |
2 |
3 |
4 |
5 |
1. |
Foreign Direct Investment (FDI) |
7,693 |
15,401 |
6,905 |
15,373 |
| |
Inward FDI |
22,739 |
34,236 |
20,039 |
27,357 |
| |
Outward FDI |
15,046 |
18,835 |
13,134 |
11,984 |
2. |
Portfolio Investment |
7,060 |
29,556 |
33,292 |
-11,341 |
| |
of which: |
|
|
|
|
| |
FIIs |
3,225 |
20,327 |
24,471 |
-12,408 |
| |
ADR/GDRs |
3,776 |
8,769 |
8,390 |
1,142 |
3. |
External Assistance |
1,775 |
2,114 |
1,274 |
1,861 |
4. |
External Commercial Borrowings |
16,103 |
22,633 |
17,410 |
7,114 |
5. |
NRI Deposits |
4,321 |
179 |
-931 |
2,115 |
6. |
Banking Capital excluding NRI Deposits |
-2,408 |
11,578 |
6,862 |
-2,244 |
7. |
Short-term Trade Credit |
6,612 |
17,183 |
10,719 |
547 |
8. |
Rupee Debt Service |
-162 |
-121 |
-45 |
-33 |
9. |
Other Capital |
4,209 |
9,470 |
6,478 |
1,900 |
Total (1 to 9) |
45,203 |
107,993 |
81,964 |
15,292 |
Note: Details of Other Capital (Item 9) are given in Table 13.
P : Preliminary. PR : Partially Revised. |
2008 as against net inflows of US$ 5.9 billion during April-December 2007. Among the components of banking capital, NRI deposits witnessed a net inflow of US$ 2.1 billion in April-December 2008, a turnaround from net outflow of US$ 0.9 billion in April-December 2007.
(viii)Gross disbursement of short-term trade credit stood at US$ 31.4 billion during April-December 2008 (US$ 32.2 billion in April-December 2007). Repayments of short-term trade credit were high at US$ 30.8 billion during April-December 2008 (as compared with US$ 21.5 billion during April-December 2007) due to some problems in rollover observed during the third quarter. Net short-term trade credit stood at US$ 0.5 billion (inclusive of suppliers’ credit up to 180 days) during April-December 2008 as compared with US$ 10.7 billion during the same period of the previous year.
(ix) Other capital includes leads and lags in exports, funds held abroad, advances received pending for issue of shares under FDI and other capital not included elsewhere (n.i.e.). Other capital recorded net inflows of US$ 1.9 billion in April-December 2008. The details of other capital are set out in Table 13 .
Variation in Reserves
(i) The decline in foreign exchange reserves on BoP basis (i.e., excluding valuation) was US$ 20.4 billion in April-December 2008 (as against accretion to reserves of US$ 67.2 billion in April-December 2007) (Table 14 & Chart 5 ).
Table 13 : Details of ‘Other Capital’ (Net) |
(US$ million) |
Item |
April-March |
April-December |
2006-07 |
2007-08 (PR) |
2007-08 (PR) |
2008-09 (P) |
1 |
2 |
3 |
4 |
5 |
1. |
Lead and Lags in Exports |
217 |
983 |
3,287 |
3,707 |
2. |
Net Funds Held Abroad |
619 |
-5,487 |
-2,716 |
-1,206 |
3. |
Advances Received Pending Issue of Shares under FDI |
— |
8,700 |
5,561 |
850 |
4. |
Other capital not included elsewhere (n.i.e) |
3,373 |
5,274 |
346 |
-1,451 |
Total (1 to 4) |
4,209 |
9,470 |
6,478 |
1,900 |
P : Preliminary. PR : Partially Revised. |
Taking into account the valuation loss, foreign exchange reserves recorded a decline of US$ 53.8 billion during April-December 2008 (as against an accretion to reserves of US$ 76.1 billion in April-December 2007). [Details on sources of variation in foreign exchange reserves is at Annex A].
(ii) At the end of December 2008, outstanding foreign exchange reserves stood at US$ 256.0 billion.
(iii) To sum up, the key features of India’s BoP that emerged in April-December 2008 were: (i) widening of trade deficit led by high growth in imports and slowdown in exports, (ii) increase in invisibles surplus, led by remittances from overseas Indians and software services exports, which financed about 65 per cent of trade deficit, (iii) higher current account deficit due to large trade deficit, (iv) lower net capital flows mainly led by large net outflows under portfolio investment and large repayments under short-term trade credit, and (v) sharp decline in reserves. The details of key indicators are set out in Table 15.
Table 14 : Sources of Variation in Reserves (BoP Basis) in April-December 2008 |
(US$ million) |
Item |
April-March |
April-December |
2006-07 |
2007-08 (PR) |
2007-08 (PR) |
2008-09 (P) |
1 |
2 |
3 |
4 |
5 |
A. |
Current Account Balance |
-9,565 |
-17,034 |
-15,508 |
-36,469 |
B. |
Capital Account* |
46,171 |
109,198 |
82,682 |
16,089 |
| |
of which |
|
|
|
|
| |
(i) |
Foreign Direct Investment |
7,693 |
15,401 |
6,905 |
15,373 |
| |
(ii) |
Portfolio Investment |
7,060 |
29,556 |
33,292 |
-11,341 |
| |
(iii) |
External Commercial Borrowings |
16,103 |
22,633 |
17,410 |
7,114 |
| |
(iv) |
Banking Capital |
1,913 |
11,757 |
5,931 |
-129 |
| |
(v) |
Short-term Trade Credit |
6,612 |
17,183 |
10,719 |
547 |
C. |
Change in Reserves: (-) indicates increase; |
|
|
|
|
| |
(+) indicates decrease)# |
-36,606 |
-92,164 |
-67,174 |
20,380 |
* : Including errors and omissions # : On BoP basis (i.e., excluding valuation).
P : Preliminary. PR : Partially Revised. |
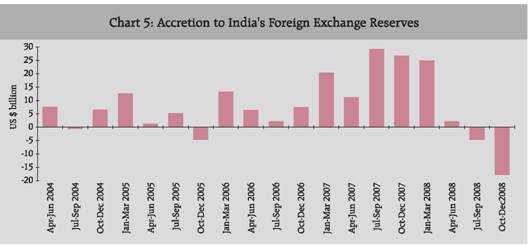
Table 15 : Key Indicators of India’s Balance of Payments |
Item |
April-March |
April-December |
2006-07 |
2007-08 |
2007-08 |
2008-09 |
1 |
2 |
3 |
4 |
5 |
Merchandise Trade |
|
|
|
|
1. |
Exports (US$ on BoP basis) Growth Rate (%) |
22.6 |
28.9 |
21.9 |
17.5 |
2. |
Imports (US$ on BoP basis) Growth Rate (%) |
21.4 |
35.2 |
28.3 |
30.6 |
3. |
Crude Oil Prices, US$ Per Barrel (Indian Basket) |
62.4 |
79.2 |
74.7 |
95.5 |
4. |
Trade Balance (US$ billion) |
-61.8 |
-91.6 |
-69.3 |
-105.3 |
Invisibles |
|
|
|
|
5. |
Net Invisibles (US$ billion) |
52.2 |
74.6 |
53.8 |
68.9 |
6. |
Net Invisibles Surplus / Trade Deficit (%) |
84.5 |
81.4 |
77.6 |
65.4 |
7. |
Invisibles Receipts /Current Receipts (%) |
47.1 |
47.2 |
47.7 |
47.9 |
8. |
Services Receipts / Current Receipts (%) |
30.3 |
28.6 |
29.5 |
29.1 |
9. |
Private Transfers /Current Receipts (%) |
12.7 |
13.8 |
13.5 |
14.4 |
Current Account |
|
|
|
|
10. |
Current Receipts (US$ billion) |
243.4 |
314.8 |
217.1 |
256.4 |
11. |
Current Payments (US$ billion) |
253.0 |
331.8 |
232.6 |
292.9 |
12. |
Current Account Balance (US$ billion) |
-9.6 |
-17.0 |
-15.5 |
-36.5 |
Capital Account |
|
|
|
|
13. |
Gross Capital Inflows (US$ billion) |
233.3 |
433.0 |
291.8 |
246.4 |
14. |
Gross Capital Outflows (US$ billion) |
188.1 |
325.0 |
209.8 |
231.1 |
15. |
Net Capital Flows (US$ billion) |
45.2 |
108.0 |
82.0 |
15.3 |
16. |
Net FDI / Net Capital Flows (%) |
17.0 |
14.3 |
8.4 |
100.5 |
17. |
Net Portfolio Investment / Net Capital Flows (%) |
15.6 |
27.4 |
40.6 |
-74.2 |
18. |
Net ECBs / Net Capital Flows (%) |
35.6 |
21.0 |
21.2 |
46.5 |
Reserves |
|
|
|
|
19. |
Import Cover of Reserves (in months) |
12.5 |
14.4 |
14.3 |
9.8 |
20. |
Outstanding Reserves as at end period (US$ billion) |
199.2 |
309.7 |
275.3 |
256.0 |
1. Reconciliation of Import Data
(i) During April-December 2008, based on the records of the DGCI&S imports data and the BoP merchandise imports, the difference between the two data sets works out to about US$ 14.4 billion (Table 16).
2. External Debt for the Quarter ending December 2008
(i) As per the existing practice, the external debt for the quarters ending March and June are compiled and released by the Reserve Bank of India, while the external debt for quarters ending September and December are compiled and released by the Ministry of Finance, Government of India. Accordingly, the data on external debt for the quarter ending December 2008 are being released by the Ministry of Finance, Government of India. The same could be accessed http:// finmin.nic.in.
Table 16 : DGCI&S and the BoP Import Data |
(US$ million) |
Item |
April-March |
April-December |
2006-07 |
2007-08 |
2007-08 |
2008-09 |
1 |
2 |
3 |
4 |
5 |
1. |
BoP Imports |
1,90,670 |
2,57,789 |
1,82,894 |
2,38,864 |
2. |
DGCI&S Imports |
1,85,749 |
2,51,439 |
1,71,614 |
2,24,432 |
3. |
Difference (1-2) |
4,921 |
6,350 |
11,280 |
14,432 |
Sources of Variation in Foreign Exchange Reserves in India: April-December 2008
During April-December 2008, there was a decline in foreign exchange reserves. The variation in the main components of foreign exchange reserves during April-December 2008 are set out in Table A1. an increase of US$ 67,174 million during April-December 2007. Valuation loss, reflecting the depreciation of major currencies against the US dollar accounted for US$ 33,375 million or 62.1 per cent of the total decline in foreign exchange
Table A1 : Sources of Variation in Foreign Exchange Reserves |
(US $ million) |
Items |
April-December 2007 |
April-December 2008 |
I. |
Current Account Balance |
-15,508 |
-36,469 |
II. |
Capital Account (net) (a to f) |
82,682 |
16,089 |
| |
a. |
Foreign Investment (i+ii) |
40,197 |
4,032 |
| |
|
(i) Foreign Direct Investment |
6,905 |
15,373 |
| |
|
(ii) Portfolio Investment |
33,292 |
-11,341 |
| |
b. |
External Commercial Borrowings |
17,410 |
7,114 |
| |
c. |
Banking Capital |
5,931 |
-129 |
| |
|
of which: NRI Deposits |
-931 |
2,115 |
| |
d. |
Short-Term Credit |
10,719 |
547 |
| |
e. |
External Assistance |
1,274 |
1,861 |
| |
f. |
Other items in capital account* |
7,151 |
2,664 |
III. |
Valuation Change |
8,963 |
-33,375 |
| |
Total (I+II+III) |
76,137 |
-53,755 |
Note: (i) *: ‘Other items in capital account’ apart from ‘Errors and Omissions’ also include leads and lags in exports, funds held abroad, advances received pending issue of shares under FDI and transactions of capital receipts not included elsewhere.
(ii) Increase in reserves(+)/Decrease in reserves (-). |
The foreign exchange reserves (including the valuation effects) declined by US$ 53,755 million during April-December 2008 as against an increase of US$ 76,137 million during April-December 2007 (Table A2). On a BoP basis (i.e., excluding valuation effects), the foreign exchange reserves declined by US$ 20,380 million during April-December 2008 as against reserves of US$ 53,755 million during April-December 2008 as against a valuation gain of US$ 8,963 million during the corresponding period of previous year. Apart from current account deficits, outflows under FIIs were the other major sources contributing to decline in foreign exchange reserves during April-December 2008. |
| |
Table A2 : Comparative Position |
(US$ million) |
| |
April-December 2007 |
April-December 2008 |
1. |
Change in Foreign Exchange Reserves (Including Valuation Effects) |
76,137 |
(-) 53,755 |
2. |
Valuation Effects [Gain (+)/Loss (-)] |
8,963 |
(-) 33,375 |
3. |
Change in Foreign Exchange Reserves on BoP basis (Excluding Valuation Effects) |
67,174 |
(-) 20,380 |
4. |
Percentage of increase/decline in Reserves Explained by Valuation Gain/Loss |
11.8 |
62.1 |
Note: Increase in reserves (+)/Decrease in reserves (-) |
|
| |
|
|
|
(US $ million)
|
| |
2004-05 |
2005-06 |
| |
Credit |
Debit |
Net |
Credit |
Debit |
Net |
1 |
2 |
3 |
4 |
5 |
6 |
7 |
A. |
Current Account |
|
|
|
|
|
|
| |
I. |
Merchandise |
85,206 |
118,908 |
-33,702 |
105,152 |
157,056 |
-51,904 |
| |
II. |
Invisibles (a+b+c) |
69,533 |
38,301 |
31,232 |
89,687 |
47,685 |
42,002 |
| |
|
a) |
Services |
43,249 |
27,823 |
15,426 |
57,659 |
34,489 |
23,170 |
| |
|
|
i) |
Travel |
6,666 |
5,249 |
1,417 |
7,853 |
6,638 |
1,215 |
| |
|
|
ii) |
Transportation |
4,683 |
4,539 |
144 |
6,325 |
8,337 |
-2,012 |
| |
|
|
iii) |
Insurance |
870 |
722 |
148 |
1,062 |
1,116 |
-54 |
| |
|
|
iv) |
G.n.i.e. |
401 |
411 |
-10 |
314 |
529 |
-215 |
| |
|
|
v) |
Miscellaneous |
30,629 |
16,902 |
13,727 |
42,105 |
17,869 |
24,236 |
| |
|
|
|
of which |
|
|
|
|
|
|
| |
|
|
|
Software Services |
17,700 |
800 |
16,900 |
23,600 |
1,338 |
22,262 |
| |
|
|
|
Business Services |
5,167 |
7,318 |
-2,151 |
9,307 |
7,748 |
1,559 |
| |
|
|
|
Financial Services |
512 |
832 |
-320 |
1,209 |
965 |
244 |
| |
|
|
|
Communication Services |
1,384 |
738 |
646 |
1,575 |
289 |
1,286 |
| |
|
b) |
Transfers |
21,691 |
906 |
20,785 |
25,620 |
933 |
24,687 |
| |
|
|
i) |
Official |
616 |
356 |
260 |
669 |
475 |
194 |
| |
|
|
ii) |
Private |
21,075 |
550 |
20,525 |
24,951 |
458 |
24,493 |
| |
|
c) |
Income |
4,593 |
9,572 |
-4,979 |
6,408 |
12,263 |
-5,855 |
| |
|
|
i) |
Investment Income |
4,124 |
8,219 |
-4,095 |
6,229 |
11,491 |
-5,262 |
| |
|
|
ii) |
Compensation of Employees |
469 |
1,353 |
-884 |
179 |
772 |
-593 |
| |
Total Current Account (I+II) |
154,739 |
157,209 |
-2,470 |
194,839 |
204,741 |
-9,902 |
B. |
Capital Account |
|
|
|
|
|
|
| |
1. |
Foreign Investment (a+b) |
46,934 |
33,934 |
13,000 |
77,298 |
61,770 |
15,528 |
| |
|
a) |
Foreign Direct Investment (i+ii) |
6,087 |
2,374 |
3,713 |
9,178 |
6,144 |
3,034 |
| |
|
|
i) |
In India |
6,052 |
65 |
5,987 |
8,962 |
61 |
8,901 |
| |
|
|
|
Equity |
3,779 |
65 |
3,714 |
5,976 |
61 |
5,915 |
| |
|
|
|
Reinvested Earnings |
1,904 |
— |
1,904 |
2,760 |
— |
2,760 |
| |
|
|
|
Other Capital |
369 |
— |
369 |
226 |
— |
226 |
| |
|
|
ii) |
Abroad |
35 |
2,309 |
-2,274 |
216 |
6,083 |
-5,867 |
| |
|
|
|
Equity |
35 |
1,672 |
-1,637 |
216 |
3,982 |
-3,766 |
| |
|
|
|
Reinvested Earnings |
— |
248 |
-248 |
— |
1,092 |
-1,092 |
| |
|
|
|
Other Capital |
— |
389 |
-389 |
— |
1,009 |
-1,009 |
| |
|
b) |
Portfolio Investment |
40,847 |
31,560 |
9,287 |
68,120 |
55,626 |
12,494 |
| |
|
|
i) |
In India |
40,847 |
31,536 |
9,311 |
68,120 |
55,626 |
12,494 |
| |
|
|
|
of which |
|
|
|
|
|
|
| |
|
|
|
FIIs |
40,415 |
31,729 |
8,686 |
— |
— |
9,926 |
| |
|
|
|
GDRs/ADRs |
613 |
— |
613 |
2,552 |
— |
2,552 |
| |
|
|
ii) |
Abroad |
— |
24 |
-24 |
— |
— |
— |
| |
2. |
Loans (a+b+c) |
30,287 |
19,378 |
10,909 |
39,479 |
31,570 |
7,909 |
| |
|
a) |
External Assistance |
3,809 |
1,886 |
1,923 |
3,631 |
1,929 |
1,702 |
| |
|
|
i) |
By India |
24 |
128 |
-104 |
24 |
88 |
-64 |
| |
|
|
ii) |
To India |
3,785 |
1,758 |
2,027 |
3,607 |
1,841 |
1,766 |
| |
|
b) |
Commercial Borrowings |
9,084 |
3,890 |
5,194 |
14,343 |
11,835 |
2,508 |
| |
|
|
i) |
By India |
— |
232 |
-232 |
— |
251 |
-251 |
| |
|
|
ii) |
To India |
9,084 |
3,658 |
5,426 |
14,343 |
11,584 |
2,759 |
| |
|
c) |
Short Term To India |
17,394 |
13,602 |
3,792 |
21,505 |
17,806 |
3,699 |
| |
|
|
i) |
Suppliers’ Credit >180 days & Buyers’ Credit |
17,394 |
13,602 |
3,792 |
19,372 |
17,647 |
1,725 |
| |
|
|
ii) |
Suppliers’ Credit up to 180 days |
— |
— |
— |
2,133 |
159 |
1,974 |
| |
3. |
Banking Capital (a+b) |
14,581 |
10,707 |
3,874 |
21,658 |
20,285 |
1,373 |
| |
|
a) |
Commercial Banks |
14,304 |
10,325 |
3,979 |
20,586 |
20,144 |
442 |
| |
|
|
i) |
Assets |
505 |
552 |
-47 |
772 |
3,947 |
-3,175 |
| |
|
|
ii) |
Liabilities |
13,799 |
9,773 |
4,026 |
19,814 |
16,197 |
3,617 |
| |
|
|
|
of which: Non-Resident Deposits |
8,071 |
9,035 |
-964 |
17,835 |
15,046 |
2,789 |
| |
|
b) |
Others |
277 |
382 |
-105 |
1,072 |
141 |
931 |
| |
4. |
Rupee Debt Service |
— |
417 |
-417 |
— |
572 |
-572 |
| |
5. |
Other Capital |
6,737 |
6,081 |
656 |
5,941 |
4,709 |
1,232 |
| |
Total Capital Account (1 to 5) |
98,539 |
70,517 |
28,022 |
144,376 |
118,906 |
25,470 |
C. |
Errors & Omissions |
607 |
— |
607 |
— |
516 |
-516 |
D. |
Overall Balance (Total Current Account, Capital Account and Errors & Omissions (A+B+C)) |
253,885 |
227,726 |
26,159 |
339,215 |
324,163 |
15,052 |
E. |
Monetary Movements (i+ii) |
— |
26,159 |
-26,159 |
— |
15,052 |
-15,052 |
| |
i) |
I.M.F. |
— |
— |
— |
— |
— |
— |
| |
ii) |
Foreign Exchange Reserves (Increase – / Decrease +) |
— |
26,159 |
-26,159 |
— |
15,052 |
-15,052 |
P: Preliminary. PR: Partially Revised. |
|
| |
Statement I : India's Overall Balance of Payments (Contd.) |
|
(US $ million)
|
Item |
2006-07 |
2007-08 PR |
Credit |
Debit |
Net |
Credit |
Debit |
Net |
1 |
8 |
9 |
10 |
11 |
12 |
13 |
A. |
Current Account |
|
|
|
|
|
|
| |
I. |
Merchandise |
128,888 |
190,670 |
-61,782 |
166,163 |
257,789 |
-91,626 |
| |
II. |
Invisibles (a+b+c) |
114,558 |
62,341 |
52,217 |
148,604 |
74,012 |
74,592 |
| |
|
a) |
Services |
73,780 |
44,311 |
29,469 |
90,077 |
52,512 |
37,565 |
| |
|
|
i) |
Travel |
9,123 |
6,684 |
2,439 |
11,349 |
9,254 |
2,095 |
| |
|
|
ii) |
Transportation |
7,974 |
8,068 |
-94 |
10,014 |
11,514 |
-1,500 |
| |
|
|
iii) |
Insurance |
1,195 |
642 |
553 |
1,639 |
1,044 |
595 |
| |
|
|
iv) |
G.n.i.e. |
253 |
403 |
-150 |
330 |
376 |
-46 |
| |
|
|
v) |
Miscellaneous |
55,235 |
28,514 |
26,721 |
66,745 |
30,324 |
36,421 |
| |
|
|
|
of which |
|
|
|
|
|
|
| |
|
|
|
Software Services |
31,300 |
2,267 |
29,033 |
40,300 |
3,058 |
37,242 |
| |
|
|
|
Business Services |
14,544 |
15,866 |
-1,322 |
16,771 |
16,715 |
56 |
| |
|
|
|
Financial Services |
3,106 |
2,991 |
115 |
3,217 |
3,138 |
79 |
| |
|
|
|
Communication Services |
2,262 |
796 |
1,466 |
2,408 |
859 |
1,549 |
| |
|
b) |
Transfers |
31,470 |
1,391 |
30,079 |
44,259 |
2,315 |
41,944 |
| |
|
|
i) |
Official |
635 |
381 |
254 |
753 |
514 |
239 |
| |
|
|
ii) |
Private |
30,835 |
1,010 |
29,825 |
43,506 |
1,801 |
41,705 |
| |
|
c) |
Income |
9,308 |
16,639 |
-7,331 |
14,268 |
19,185 |
-4,917 |
| |
|
|
i) |
Investment Income |
8,926 |
15,688 |
-6,762 |
13,808 |
18,089 |
-4,281 |
| |
|
|
ii) |
Compensation of Employees |
382 |
951 |
-569 |
460 |
1,096 |
-636 |
| |
Total Current Account (I+II) |
243,446 |
253,011 |
-9,565 |
314,767 |
331,801 |
-17,034 |
B. |
Capital Account |
|
|
|
|
|
|
| |
1. |
Foreign Investment (a+b) |
133,210 |
118,457 |
14,753 |
272,762 |
227,805 |
44,957 |
| |
|
a) |
Foreign Direct Investment (i+ii) |
23,590 |
15,897 |
7,693 |
36,838 |
21,437 |
15,401 |
| |
|
|
i) |
In India |
22,826 |
87 |
22,739 |
34,361 |
125 |
34,236 |
| |
|
|
|
Equity |
16,481 |
87 |
16,394 |
26,866 |
108 |
26,758 |
| |
|
|
|
Reinvested Earnings |
5,828 |
— |
5,828 |
7,168 |
— |
7,168 |
| |
|
|
|
Other Capital |
517 |
— |
517 |
327 |
17 |
310 |
| |
|
|
ii) |
Abroad |
764 |
15,810 |
-15,046 |
2,477 |
21,312 |
-18,835 |
| |
|
|
|
Equity |
764 |
13,368 |
-12,604 |
2,477 |
16,898 |
-14,421 |
| |
|
|
|
Reinvested Earnings |
— |
1,076 |
-1,076 |
— |
1,084 |
-1,084 |
| |
|
|
|
Other Capital |
— |
1,366 |
-1,366 |
— |
3,330 |
-3,330 |
| |
|
b) |
Portfolio Investment |
109,620 |
102,560 |
7,060 |
235,924 |
206,368 |
29,556 |
| |
|
|
i) |
In India |
109,534 |
102,530 |
7,004 |
235,688 |
206,294 |
29,394 |
| |
|
|
|
of which |
|
|
|
|
|
|
| |
|
|
|
FIIs |
105,756 |
102,530 |
3,226 |
226,621 |
206,294 |
20,327 |
| |
|
|
|
GDRs/ADRs |
3,776 |
— |
3,776 |
8,769 |
— |
8,769 |
| |
|
|
ii) |
Abroad |
86 |
30 |
56 |
236 |
74 |
162 |
| |
2. |
Loans (a+b+c) |
54,642 |
30,152 |
24,490 |
83,528 |
41,598 |
41,930 |
| |
|
a) |
External Assistance |
3,767 |
1,992 |
1,775 |
4,241 |
2,127 |
2,114 |
| |
|
|
i) |
By India |
20 |
32 |
-12 |
24 |
28 |
-4 |
| |
|
|
ii) |
To India |
3,747 |
1,960 |
1,787 |
4,217 |
2,099 |
2,118 |
| |
|
b) |
Commercial Borrowings |
20,883 |
4,780 |
16,103 |
30,376 |
7,743 |
22,633 |
| |
|
|
i) |
By India |
626 |
966 |
-340 |
1,592 |
1,624 |
-32 |
| |
|
|
ii) |
To India |
20,257 |
3,814 |
16,443 |
28,784 |
6,119 |
22,665 |
| |
|
c) |
Short Term To India |
29,992 |
23,380 |
6,612 |
48,911 |
31,728 |
17,183 |
| |
|
|
i) |
Suppliers’ Credit >180 days & Buyers’ Credit |
25,482 |
22,175 |
3,307 |
42,641 |
31,728 |
10,913 |
| |
|
|
ii) |
Suppliers’ Credit up to 180 days |
4,510 |
1,205 |
3,305 |
6,270 |
— |
6,270 |
| |
3. |
Banking Capital (a+b) |
37,209 |
35,296 |
1,913 |
55,813 |
44,056 |
11,757 |
| |
|
a) |
Commercial Banks |
36,799 |
35,218 |
1,581 |
55,734 |
43,624 |
12,110 |
| |
|
|
i) |
Assets |
14,466 |
17,960 |
-3,494 |
19,562 |
12,668 |
6,894 |
| |
|
|
ii) |
Liabilities |
22,333 |
17,258 |
5,075 |
36,172 |
30,956 |
5,216 |
| |
|
|
|
of which: Non-Resident Deposits |
19,914 |
15,593 |
4,321 |
29,401 |
29,222 |
179 |
| |
|
b) |
Others |
410 |
78 |
332 |
79 |
432 |
-353 |
| |
4. |
Rupee Debt Service |
— |
162 |
-162 |
— |
121 |
-121 |
| |
5. |
Other Capital |
8,230 |
4,021 |
4,209 |
20,904 |
11,434 |
9,470 |
| |
Total Capital Account (1 to 5) |
233,291 |
188,088 |
45,203 |
433,007 |
325,014 |
107,993 |
C. |
Errors & Omissions |
968 |
— |
968 |
1,205 |
— |
1,205 |
D. |
Overall Balance (Total Current Account, Capital Account and Errors & Omissions (A+B+C)) |
477,705 |
441,099 |
36,606 |
748,979 |
656,815 |
92,164 |
E. |
Monetary Movements (i+ii) |
— |
36,606 |
-36,606 |
— |
92,164 |
-92,164 |
| |
i) |
I.M.F. |
— |
— |
— |
— |
— |
— |
| |
ii) |
Foreign Exchange Reserves (Increase – / Decrease +) |
— |
36,606 |
-36,606 |
— |
92,164 |
-92,164 |
|
| |
Statement I : India's Overall Balance of Payments (Contd.) |
|
(US $ million)
|
Item |
Apr-Jun 2006 |
Jul-Sep 2006 |
Credit |
Debit |
Net |
Credit |
Debit |
Net |
1 |
14 |
15 |
16 |
17 |
18 |
19 |
A. |
Current Account |
|
|
|
|
|
|
| |
I. |
Merchandise |
29,663 |
46,613 |
-16,950 |
32,701 |
48,717 |
-16,016 |
| |
II. |
Invisibles (a+b+c) |
24,934 |
12,421 |
12,513 |
24,866 |
14,597 |
10,269 |
| |
|
a) |
Services |
16,042 |
8,475 |
7,567 |
16,416 |
9,966 |
6,450 |
| |
|
|
i) |
Travel |
1,708 |
1,488 |
220 |
1,796 |
1,811 |
-15 |
| |
|
|
ii) |
Transportation |
1,715 |
1,997 |
-282 |
1,973 |
1,978 |
-5 |
| |
|
|
iii) |
Insurance |
238 |
129 |
109 |
315 |
154 |
161 |
| |
|
|
iv) |
G.n.i.e. |
40 |
79 |
-39 |
61 |
122 |
-61 |
| |
|
|
v) |
Miscellaneous |
12,341 |
4,782 |
7,559 |
12,271 |
5,901 |
6,370 |
| |
|
|
|
of which |
|
|
|
|
|
|
| |
|
|
|
Software Services |
7,039 |
415 |
6,624 |
7,121 |
405 |
6,716 |
| |
|
|
|
Business Services |
3,386 |
2,646 |
740 |
3,436 |
3,300 |
136 |
| |
|
|
|
Financial Services |
509 |
318 |
191 |
716 |
703 |
13 |
| |
|
|
|
Communication Services |
475 |
108 |
367 |
569 |
180 |
389 |
| |
|
b) |
Transfers |
7,170 |
289 |
6,881 |
6,218 |
361 |
5,857 |
| |
|
|
i) |
Official |
69 |
82 |
-13 |
119 |
100 |
19 |
| |
|
|
ii) |
Private |
7,101 |
207 |
6,894 |
6,099 |
261 |
5,838 |
| |
|
c) |
Income |
1,722 |
3,657 |
-1,935 |
2,232 |
4,270 |
-2,038 |
| |
|
|
i) |
Investment Income |
1,659 |
3,461 |
-1,802 |
2,160 |
4,042 |
-1,882 |
| |
|
|
ii) |
Compensation of Employees |
63 |
196 |
-133 |
72 |
228 |
-156 |
| |
Total Current Account (I+II) |
54,597 |
59,034 |
-4,437 |
57,567 |
63,314 |
-5,747 |
B. |
Capital Account |
|
|
|
|
|
|
| |
1. |
Foreign Investment (a+b) |
34,299 |
33,067 |
1,232 |
22,485 |
18,219 |
4,266 |
| |
|
a) |
Foreign Direct Investment (i+ii) |
3,477 |
1,739 |
1,738 |
4,545 |
2,429 |
2,116 |
| |
|
|
i) |
In India |
3,413 |
8 |
3,405 |
4,400 |
2 |
4,398 |
| |
|
|
|
Equity |
1,946 |
8 |
1,938 |
2,886 |
2 |
2,884 |
| |
|
|
|
Reinvested Earnings |
1,457 |
— |
1,457 |
1,457 |
— |
1,457 |
| |
|
|
|
Other Capital |
10 |
— |
10 |
57 |
— |
57 |
| |
|
|
ii) |
Abroad |
64 |
1,731 |
-1,667 |
145 |
2,427 |
-2,282 |
| |
|
|
|
Equity |
64 |
1,189 |
-1,125 |
145 |
1,868 |
-1,723 |
| |
|
|
|
Reinvested Earnings |
— |
269 |
-269 |
— |
269 |
-269 |
| |
|
|
|
Other Capital |
— |
273 |
-273 |
— |
290 |
-290 |
| |
|
b) |
Portfolio Investment |
30,822 |
31,328 |
-506 |
17,940 |
15,790 |
2,150 |
| |
|
|
i) |
In India |
30,801 |
31,327 |
-526 |
17,929 |
15,789 |
2,140 |
| |
|
|
|
of which |
|
|
|
|
|
|
| |
|
|
|
FIIs |
29540 |
31327 |
-1787 |
17469 |
15789 |
1680 |
| |
|
|
|
GDRs/ADRs |
1261 |
— |
1261 |
460 |
— |
460 |
| |
|
|
ii) |
Abroad |
21 |
1 |
20 |
11 |
1 |
10 |
| |
2. |
Loans (a+b+c) |
11,499 |
6,288 |
5,211 |
11,228 |
6,446 |
4,782 |
| |
|
a) |
External Assistance |
577 |
526 |
51 |
788 |
449 |
339 |
| |
|
|
i) |
By India |
5 |
8 |
-3 |
5 |
8 |
-3 |
| |
|
|
ii) |
To India |
572 |
518 |
54 |
783 |
441 |
342 |
| |
|
b) |
Commercial Borrowings |
5,051 |
1,073 |
3,978 |
2,680 |
920 |
1,760 |
| |
|
|
i) |
By India |
87 |
223 |
-136 |
114 |
170 |
-56 |
| |
|
|
ii) |
To India |
4,964 |
850 |
4,114 |
2,566 |
750 |
1,816 |
| |
|
c) |
Short Term To India |
5,871 |
4,689 |
1,182 |
7,760 |
5,077 |
2,683 |
| |
|
|
i) |
Suppliers’ Credit >180 days & Buyers’ Credit |
5,082 |
4,689 |
393 |
6,579 |
5,077 |
1,502 |
| |
|
|
ii) |
Suppliers’ Credit up to 180 days |
789 |
— |
789 |
1,181 |
— |
1,181 |
| |
3. |
Banking Capital (a+b) |
9,909 |
4,848 |
5,061 |
5,754 |
7,472 |
-1,718 |
| |
|
a) |
Commercial Banks |
9,837 |
4,848 |
4,989 |
5,754 |
7,428 |
-1,674 |
| |
|
|
i) |
Assets |
5,257 |
1,877 |
3,380 |
1,568 |
3,553 |
-1,985 |
| |
|
|
ii) |
Liabilities |
4,580 |
2,971 |
1,609 |
4,186 |
3,875 |
311 |
| |
|
|
|
of which: Non-Resident Deposits |
4,246 |
2,944 |
1,302 |
4,185 |
3,277 |
908 |
| |
|
b) |
Others |
72 |
— |
72 |
— |
44 |
–44 |
| |
4. |
Rupee Debt Service |
— |
67 |
-67 |
— |
— |
— |
| |
5. |
Other Capital |
342 |
1,054 |
-712 |
1,084 |
554 |
530 |
| |
Total Capital Account (1 to 5) |
56,049 |
45,324 |
10,725 |
40,551 |
32,691 |
7,860 |
C. |
Errors & Omissions |
91 |
— |
91 |
157 |
— |
157 |
D. |
Overall Balance (Total Current Account, Capital Account and Errors & Omissions (A+B+C)) |
110,737 |
104,358 |
6,379 |
98,275 |
96,005 |
2,270 |
E. |
Monetary Movements (i+ii) |
— |
6,379 |
-6,379 |
— |
2,270 |
-2,270 |
| |
i) |
I.M.F. |
— |
— |
— |
— |
— |
— |
| |
ii) |
Foreign Exchange Reserves (Increase – / Decrease +) |
— |
6,379 |
-6,379 |
— |
2,270 |
-2,270 |
|
| |
Statement I : India's Overall Balance of Payments (Contd.) |
(US $ million) |
Item |
Oct-Dec 2006 |
Jan-Mar 2007 |
Credit |
Debit |
Net |
Credit |
Debit |
Net |
1 |
20 |
21 |
22 |
23 |
24 |
25 |
A. |
Current Account |
|
|
|
|
|
|
| |
I. |
Merchandise |
30,824 |
47,257 |
-16,433 |
35,700 |
48,083 |
-12,383 |
| |
II. |
Invisibles (a+b+c) |
29,704 |
16,875 |
12,829 |
35,054 |
18,448 |
16,606 |
| |
|
a) |
Services |
18,451 |
12,371 |
6,080 |
22,871 |
13,499 |
9,372 |
| |
|
|
i) |
Travel |
2,621 |
1,638 |
983 |
2,998 |
1,747 |
1,251 |
| |
|
|
ii) |
Transportation |
2,092 |
2,102 |
-10 |
2,194 |
1,991 |
203 |
| |
|
|
iii) |
Insurance |
288 |
201 |
87 |
354 |
158 |
196 |
| |
|
|
iv) |
G.n.i.e. |
87 |
97 |
-10 |
65 |
105 |
-40 |
| |
|
|
v) |
Miscellaneous |
13,363 |
8,333 |
5,030 |
17,260 |
9,498 |
7,762 |
| |
|
|
|
of which |
|
|
|
|
|
|
| |
|
|
|
Software Services |
7,602 |
684 |
6,918 |
9,538 |
763 |
8,775 |
| |
|
|
|
Business Services |
3,690 |
4,267 |
-577 |
4,032 |
5,653 |
-1,621 |
| |
|
|
|
Financial Services |
828 |
647 |
181 |
1,053 |
1,323 |
-270 |
| |
|
|
|
Communication Services |
597 |
239 |
358 |
621 |
269 |
352 |
| |
|
b) |
Transfers |
8,961 |
333 |
8,628 |
9,121 |
408 |
8,713 |
| |
|
|
i) |
Official |
287 |
89 |
198 |
160 |
110 |
50 |
| |
|
|
ii) |
Private |
8,674 |
244 |
8,430 |
8,961 |
298 |
8,663 |
| |
|
c) |
Income |
2,292 |
4,171 |
-1,879 |
3,062 |
4,541 |
-1,479 |
| |
|
|
i) |
Investment Income |
2,193 |
3,936 |
-1,743 |
2,914 |
4,249 |
-1,335 |
| |
|
|
ii) |
Compensation of Employees |
99 |
235 |
-136 |
148 |
292 |
-144 |
| |
Total Current Account (I+II) |
60,528 |
64,132 |
-3,604 |
70,754 |
66,531 |
4,223 |
B. |
Capital Account |
|
|
|
|
|
|
| |
1. |
Foreign Investment (a+b) |
38,646 |
32,179 |
6,467 |
37,780 |
34,992 |
2,788 |
| |
|
a) |
Foreign Direct Investment (i+ii) |
10,008 |
7,110 |
2,898 |
5,560 |
4,619 |
941 |
| |
|
|
i) |
In India |
9,855 |
7 |
9,848 |
5,158 |
70 |
5,088 |
| |
|
|
|
Equity |
8,203 |
7 |
8,196 |
3,446 |
70 |
3,376 |
| |
|
|
|
Reinvested Earnings |
1,457 |
— |
1,457 |
1,457 |
— |
1,457 |
| |
|
|
|
Other Capital |
195 |
— |
195 |
255 |
— |
255 |
| |
|
|
ii) |
Abroad |
153 |
7,103 |
-6,950 |
402 |
4,549 |
-4,147 |
| |
|
|
|
Equity |
153 |
6,454 |
-6,301 |
402 |
3,857 |
-3,455 |
| |
|
|
|
Reinvested Earnings |
— |
269 |
-269 |
— |
269 |
-269 |
| |
|
|
|
Other Capital |
— |
380 |
-380 |
— |
423 |
-423 |
| |
|
b) |
Portfolio Investment |
28,638 |
25,069 |
3,569 |
32,220 |
30,373 |
1,847 |
| |
|
|
i) |
In India |
28,625 |
25,063 |
3,562 |
32,179 |
30,351 |
1,828 |
| |
|
|
|
of which |
|
|
|
|
|
|
| |
|
|
|
FIIs |
28418 |
25063 |
3355 |
30329 |
30351 |
-22 |
| |
|
|
|
GDRs/ADRs |
207 |
— |
207 |
1848 |
— |
1848 |
| |
|
|
ii) |
Abroad |
13 |
6 |
7 |
41 |
22 |
19 |
| |
2. |
Loans (a+b+c) |
14,731 |
8,250 |
6,481 |
17,184 |
9,168 |
8,016 |
| |
|
a) |
External Assistance |
1,113 |
494 |
619 |
1,289 |
523 |
766 |
| |
|
|
i) |
By India |
5 |
8 |
-3 |
5 |
8 |
-3 |
| |
|
|
ii) |
To India |
1,108 |
486 |
622 |
1,284 |
515 |
769 |
| |
|
b) |
Commercial Borrowings |
5,418 |
1,369 |
4,049 |
7,734 |
1,418 |
6,316 |
| |
|
|
i) |
By India |
425 |
345 |
80 |
— |
228 |
-228 |
| |
|
|
ii) |
To India |
4,993 |
1,024 |
3,969 |
7,734 |
1,190 |
6,544 |
| |
|
c) |
Short Term To India |
8,200 |
6,387 |
1,813 |
8,161 |
7,227 |
934 |
| |
|
|
i) |
Suppliers’ Credit >180 days & Buyers’ Credit |
5,660 |
6,387 |
-727 |
8,161 |
6,022 |
2,139 |
| |
|
|
ii) |
Suppliers’ Credit up to 180 days |
2,540 |
— |
2,540 |
— |
1,205 |
-1,205 |
| |
3. |
Banking Capital (a+b) |
7,160 |
10,273 |
-3,113 |
14,386 |
12,703 |
1,683 |
| |
|
a) |
Commercial Banks |
6,944 |
10,239 |
-3,295 |
14,264 |
12,703 |
1,561 |
| |
|
|
i) |
Assets |
556 |
4,530 |
-3,974 |
7,085 |
8,000 |
-915 |
| |
|
|
ii) |
Liabilities |
6,388 |
5,709 |
679 |
7,179 |
4,703 |
2,476 |
| |
|
|
|
of which: Non-Resident Deposits |
6,325 |
4,862 |
1,463 |
5,158 |
4,510 |
648 |
| |
|
b) |
Others |
216 |
34 |
182 |
122 |
— |
122 |
| |
4. |
Rupee Debt Service |
— |
2 |
-2 |
— |
93 |
-93 |
| |
5. |
Other Capital |
1,976 |
994 |
982 |
4,828 |
1,419 |
3,409 |
| |
Total Capital Account (1 to 5) |
62,513 |
51,698 |
10,815 |
74,178 |
58,375 |
15,803 |
C. |
Errors & Omissions |
294 |
— |
294 |
426 |
— |
426 |
D. |
Overall Balance (Total Current Account, Capital Account and Errors & Omissions (A+B+C)) |
123,335 |
115,830 |
7,505 |
145,358 |
124,906 |
20,452 |
E. |
Monetary Movements (i+ii) |
— |
7,505 |
-7,505 |
— |
20,452 |
-20,452 |
| |
i) |
I.M.F. |
— |
— |
— |
— |
— |
— |
| |
ii) |
Foreign Exchange Reserves (Increase – / Decrease +) |
— |
7,505 |
-7,505 |
— |
20,452 |
-20,452 |
|
| |
Statement I : India's Overall Balance of Payments (Contd.) |
(US $ million) |
Item |
Apr-Jun 2007 PR |
Jul-Sep 2007 PR |
Credit |
Debit |
Net |
Credit |
Debit |
Net |
1 |
26 |
27 |
28 |
29 |
30 |
31 |
A. |
Current Account |
|
|
|
|
|
|
| |
I. |
Merchandise |
34,356 |
56,346 |
-21,990 |
38,273 |
59,510 |
-21,237 |
| |
II. |
Invisibles (a+b+c) |
29,880 |
14,570 |
15,310 |
34,013 |
17,073 |
16,940 |
| |
|
a) |
Services |
18,890 |
9,916 |
8,974 |
20,587 |
11,589 |
8,998 |
| |
|
|
i) |
Travel |
2,088 |
1,906 |
182 |
2,248 |
2,047 |
201 |
| |
|
|
ii) |
Transportation |
1,953 |
2,526 |
-573 |
2,091 |
2,559 |
-468 |
| |
|
|
iii) |
Insurance |
373 |
185 |
188 |
341 |
284 |
57 |
| |
|
|
iv) |
G.n.i.e. |
94 |
110 |
-16 |
68 |
128 |
-60 |
| |
|
|
v) |
Miscellaneous |
14,382 |
5,189 |
9,193 |
15,839 |
6,571 |
9,268 |
| |
|
|
|
of which |
|
|
|
|
|
|
| |
|
|
|
Software Services |
8,836 |
679 |
8,157 |
9,050 |
801 |
8,249 |
| |
|
|
|
Business Services |
3,758 |
3,163 |
595 |
3,894 |
3,537 |
357 |
| |
|
|
|
Financial Services |
528 |
449 |
79 |
916 |
702 |
214 |
| |
|
|
|
Communication Services |
513 |
231 |
282 |
613 |
180 |
433 |
| |
|
b) |
Transfers |
8,628 |
432 |
8,196 |
9,708 |
408 |
9,300 |
| |
|
|
i) |
Official |
153 |
165 |
-12 |
158 |
112 |
46 |
| |
|
|
ii) |
Private |
8,475 |
267 |
8,208 |
9,550 |
296 |
9,254 |
| |
|
c) |
Income |
2,362 |
4,222 |
-1,860 |
3,718 |
5,076 |
-1,358 |
| |
|
|
i) |
Investment Income |
2,279 |
4,024 |
-1,745 |
3,608 |
4,778 |
-1,170 |
| |
|
|
ii) |
Compensation of Employees |
83 |
198 |
-115 |
110 |
298 |
-188 |
| |
Total Current Account (I+II) |
64,236 |
70,916 |
-6,680 |
72,286 |
76,583 |
-4,297 |
B. |
Capital Account |
|
|
|
|
|
|
| |
1. |
Foreign Investment (a+b) |
43,034 |
32,756 |
10,278 |
54,205 |
41,178 |
13,027 |
| |
|
a) |
Foreign Direct Investment (i+ii) |
8,270 |
5,534 |
2,736 |
5,502 |
3,374 |
2,128 |
| |
|
|
i) |
In India |
7,477 |
20 |
7,457 |
4,728 |
19 |
4,709 |
| |
|
|
|
Equity |
5,574 |
20 |
5,554 |
2,822 |
19 |
2,803 |
| |
|
|
|
Reinvested Earnings |
1,792 |
— |
1,792 |
1,792 |
— |
1,792 |
| |
|
|
|
Other Capital |
111 |
— |
111 |
114 |
— |
114 |
| |
|
|
ii) |
Abroad |
793 |
5,514 |
-4,721 |
774 |
3,355 |
-2,581 |
| |
|
|
|
Equity |
793 |
4,758 |
-3,965 |
774 |
2,515 |
-1,741 |
| |
|
|
|
Reinvested Earnings |
— |
271 |
-271 |
— |
271 |
-271 |
| |
|
|
|
Other Capital |
— |
485 |
-485 |
— |
569 |
-569 |
| |
|
b) |
Portfolio Investment |
34,764 |
27,222 |
7,542 |
48,703 |
37,804 |
10,899 |
| |
|
|
i) |
In India |
34,706 |
27,216 |
7,490 |
48,698 |
37,781 |
10,917 |
| |
|
|
|
of which |
|
|
|
|
|
|
| |
|
|
|
FIIs |
34,305 |
27,216 |
7,089 |
46,199 |
37,781 |
8,418 |
| |
|
|
|
GDRs/ADRs |
316 |
— |
316 |
2,477 |
— |
2,477 |
| |
|
|
ii) |
Abroad |
58 |
6 |
52 |
5 |
23 |
-18 |
| |
2. |
Loans (a+b+c) |
16,749 |
7,593 |
9,156 |
19,742 |
10,437 |
9,305 |
| |
|
a) |
External Assistance |
732 |
491 |
241 |
983 |
515 |
468 |
| |
|
|
i) |
By India |
6 |
7 |
-1 |
6 |
7 |
-1 |
| |
|
|
ii) |
To India |
726 |
484 |
242 |
977 |
508 |
469 |
| |
|
b) |
Commercial Borrowings |
8,291 |
1,338 |
6,953 |
6,290 |
2,080 |
4,210 |
| |
|
|
i) |
By India |
359 |
345 |
14 |
443 |
503 |
-60 |
| |
|
|
ii) |
To India |
7,932 |
993 |
6,939 |
5,847 |
1,577 |
4,270 |
| |
|
c) |
Short Term To India |
7,726 |
5,764 |
1,962 |
12,469 |
7,842 |
4,627 |
| |
|
|
i) |
Suppliers’ Credit >180 days & Buyers’ Credit |
6,883 |
5,764 |
1,119 |
11,012 |
7,842 |
3,170 |
| |
|
|
ii) |
Suppliers’ Credit up to 180 days |
843 |
— |
843 |
1,457 |
— |
1,457 |
| |
3. |
Banking Capital (a+b) |
8,560 |
9,479 |
-919 |
13,714 |
7,071 |
6,643 |
| |
|
a) |
Commercial Banks |
8,560 |
9,473 |
-913 |
13,690 |
7,000 |
6,690 |
| |
|
|
i) |
Assets |
2,543 |
2,861 |
-318 |
4,404 |
358 |
4,046 |
| |
|
|
ii) |
Liabilities |
6,017 |
6,612 |
-595 |
9,286 |
6,642 |
2,644 |
| |
|
|
|
of which: Non-Resident Deposits |
5,252 |
5,699 |
-447 |
6,975 |
6,606 |
369 |
| |
|
b) |
Others |
— |
6 |
-6 |
24 |
71 |
-47 |
| |
4. |
Rupee Debt Service |
— |
43 |
-43 |
— |
2 |
-2 |
| |
5. |
Other Capital |
1,151 |
1,831 |
-680 |
7,378 |
3,196 |
4,182 |
| |
Total Capital Account (1 to 5) |
69,494 |
51,702 |
17,792 |
95,039 |
61,884 |
33,155 |
C. |
Errors & Omissions |
88 |
— |
88 |
378 |
— |
378 |
D. |
Overall Balance (Total Current Account, Capital Account and Errors & Omissions (A+B+C)) |
133,818 |
122,618 |
11,200 |
167,703 |
138,467 |
29,236 |
E. |
Monetary Movements (i+ii) |
— |
11,200 |
-11,200 |
— |
29,236 |
-29,236 |
| |
i) |
I.M.F. |
— |
— |
— |
— |
— |
— |
| |
ii) |
Foreign Exchange Reserves (Increase – / Decrease +) |
— |
11,200 |
-11,200 |
— |
29,236 |
-29,236 |
|
| |
Statement I : India's Overall Balance of Payments (Contd.) |
(US $ million) |
Item |
Oct-Dec 2007PR |
Jan-Mar 2008 PR |
Credit |
Debit |
Net |
Credit |
Debit |
Net |
1 |
32 |
33 |
34 |
35 |
36 |
37 |
A. |
Current Account |
|
|
|
|
|
|
| |
I. |
Merchandise |
40,985 |
67,038 |
-26,053 |
52,549 |
74,895 |
-22,346 |
| |
II. |
Invisibles (a+b+c) |
39,553 |
18,031 |
21,522 |
45,158 |
24,338 |
20,820 |
| |
|
a) |
Services |
24,618 |
12,592 |
12,026 |
25,982 |
18,415 |
7,567 |
| |
|
|
i) |
Travel |
3395 |
2,519 |
876 |
3,618 |
2,782 |
836 |
| |
|
|
ii) |
Transportation |
2,799 |
3,043 |
-244 |
3,171 |
3,386 |
-215 |
| |
|
|
iii) |
Insurance |
438 |
261 |
177 |
487 |
314 |
173 |
| |
|
|
iv) |
G.n.i.e. |
90 |
75 |
15 |
78 |
63 |
15 |
| |
|
|
v) |
Miscellaneous |
17,896 |
6,694 |
11,202 |
18,628 |
11,870 |
6,758 |
| |
|
|
|
of which |
|
|
|
|
|
|
| |
|
|
|
Software Services |
9,608 |
852 |
8,756 |
12,806 |
726 |
12,080 |
| |
|
|
|
Business Services |
4,588 |
4,245 |
343 |
4,531 |
5,770 |
-1,239 |
| |
|
|
|
Financial Services |
882 |
763 |
119 |
891 |
1,224 |
-333 |
| |
|
|
|
Communication Services |
601 |
183 |
418 |
681 |
265 |
416 |
| |
|
b) |
Transfers |
11,428 |
493 |
10,935 |
14,495 |
982 |
13,513 |
| |
|
|
i) |
Official |
195 |
121 |
74 |
247 |
116 |
131 |
| |
|
|
ii) |
Private |
11,233 |
372 |
10,861 |
14,248 |
866 |
13,382 |
| |
|
c) |
Income |
3,507 |
4,946 |
-1,439 |
4,681 |
4,941 |
-260 |
| |
|
|
i) |
Investment Income |
3,401 |
4,679 |
-1,278 |
4,520 |
4,608 |
–88 |
| |
|
|
ii) |
Compensation of Employees |
106 |
267 |
-161 |
161 |
333 |
-172 |
| |
Total Current Account (I+II) |
80,538 |
85,069 |
-4,531 |
97,707 |
99,233 |
-1,526 |
B. |
Capital Account |
|
|
|
|
|
|
| |
1. |
Foreign Investment (a+b) |
86,531 |
69,639 |
16,892 |
88,992 |
84,232 |
4,760 |
| |
|
a) |
Foreign Direct Investment (i+ii) |
8,316 |
6,275 |
2,041 |
14,750 |
6,254 |
8,496 |
| |
|
|
i) |
In India |
7,916 |
43 |
7,873 |
14,240 |
43 |
14,197 |
| |
|
|
|
Equity |
6,022 |
43 |
5,979 |
12,448 |
26 |
12,422 |
| |
|
|
|
Reinvested Earnings |
1,792 |
— |
1,792 |
1,792 |
— |
1,792 |
| |
|
|
|
Other Capital |
102 |
— |
102 |
— |
17 |
-17 |
| |
|
|
ii) |
Abroad |
400 |
6,232 |
-5,832 |
510 |
6,211 |
-5,701 |
| |
|
|
|
Equity |
400 |
5,206 |
-4,806 |
510 |
4,419 |
-3,909 |
| |
|
|
|
Reinvested Earnings |
— |
271 |
-271 |
— |
271 |
-271 |
| |
|
|
|
Other Capital |
— |
755 |
-755 |
— |
1,521 |
-1,521 |
| |
|
b) |
Portfolio Investment |
78,215 |
63,364 |
14,851 |
74,242 |
77,978 |
-3,736 |
| |
|
|
i) |
In India |
78,096 |
63,345 |
14,751 |
74,188 |
77,952 |
-3,764 |
| |
|
|
|
of which |
|
|
|
|
|
|
| |
|
|
|
FIIs |
72,309 |
63,345 |
8,964 |
73,808 |
77,952 |
-4,144 |
| |
|
|
|
GDRs/ADRs |
5,597 |
— |
5,597 |
379 |
— |
379 |
| |
|
|
ii) |
Abroad |
119 |
19 |
100 |
54 |
26 |
28 |
| |
2. |
Loans (a+b+c) |
21,543 |
10,601 |
10,942 |
25,494 |
12,967 |
12,527 |
| |
|
a) |
External Assistance |
1,109 |
544 |
565 |
1,417 |
577 |
840 |
| |
|
|
i) |
By India |
6 |
7 |
-1 |
6 |
7 |
-1 |
| |
|
|
ii) |
To India |
1,103 |
537 |
566 |
1,411 |
570 |
841 |
| |
|
b) |
Commercial Borrowings |
8,449 |
2,202 |
6,247 |
7,346 |
2,123 |
5,223 |
| |
|
|
i) |
By India |
363 |
384 |
-21 |
427 |
392 |
35 |
| |
|
|
ii) |
To India |
8,086 |
1,818 |
6,268 |
6,919 |
1,731 |
5,188 |
| |
|
c) |
Short Term To India |
11,985 |
7,855 |
4,130 |
16,731 |
10,267 |
6,464 |
| |
|
|
i) |
Suppliers’ Credit >180 days & Buyers’ Credit |
10,231 |
7,855 |
2,376 |
14,515 |
10,267 |
4,248 |
| |
|
|
ii) |
Suppliers’ Credit up to 180 days |
1,754 |
- |
1,754 |
2,216 |
- |
2,216 |
| |
3. |
Banking Capital (a+b) |
12,588 |
12,381 |
207 |
20,951 |
15,125 |
5,826 |
| |
|
a) |
Commercial Banks |
12,585 |
12,029 |
556 |
20,899 |
15,122 |
5,777 |
| |
|
|
i) |
Assets |
5,636 |
3,939 |
1,697 |
6,979 |
5,510 |
1,469 |
| |
|
|
ii) |
Liabilities |
6,949 |
8,090 |
-1,141 |
13,920 |
9,612 |
4,308 |
| |
|
|
|
of which: Non-Resident Deposits |
6,456 |
7,309 |
-853 |
10,718 |
9,608 |
1,110 |
| |
|
b) |
Others |
3 |
352 |
-349 |
52 |
3 |
49 |
| |
4. |
Rupee Debt Service |
— |
— |
— |
— |
76 |
-76 |
| |
5. |
Other Capital |
6,612 |
3,636 |
2,976 |
5,763 |
2,771 |
2,992 |
| |
Total Capital Account (1 to 5) |
127,274 |
96,257 |
31,017 |
141,200 |
115,171 |
26,029 |
C. |
Errors & Omissions |
252 |
— |
252 |
487 |
— |
487 |
D. |
Overall Balance (Total Current Account, Capital Account and Errors & Omissions (A+B+C)) |
208,064 |
181,326 |
26,738 |
239,394 |
214,404 |
24,990 |
E. |
Monetary Movements (i+ii) |
— |
26,738 |
-26,738 |
— |
24,990 |
-24,990 |
| |
i) |
I.M.F. |
— |
— |
— |
— |
— |
— |
| |
ii) |
Foreign Exchange Reserves (Increase – / Decrease +) |
— |
26,738 |
-26,738 |
— |
24,990 |
-24,990 |
|
| |
Statement I : India's Overall Balance of Payments (Contd.) |
(US $ million) |
Item |
Apr-Jun 2008 PR |
Jul-Sep 2008 PR |
Credit |
Debit |
Net |
Credit |
Debit |
Net |
1 |
38 |
39 |
40 |
41 |
42 |
43 |
A. |
Current Account |
|
|
|
|
|
|
| |
I. |
Merchandise |
49,120 |
79,637 |
-30,517 |
47,700 |
86,213 |
-38,513 |
| |
II. |
Invisibles (a+b+c) |
38,354 |
16,833 |
21,521 |
45,192 |
19,508 |
25,684 |
| |
|
a) |
Services |
22,474 |
11,728 |
10,746 |
27,328 |
13,738 |
13,590 |
| |
|
|
i) |
Travel |
2,504 |
2,164 |
340 |
2,786 |
2,704 |
82 |
| |
|
|
ii) |
Transportation |
2,530 |
3,328 |
-798 |
2,900 |
3,744 |
-844 |
| |
|
|
iii) |
Insurance |
350 |
228 |
122 |
364 |
306 |
58 |
| |
|
|
iv) |
G.n.i.e. |
130 |
110 |
20 |
81 |
95 |
-14 |
| |
|
|
v) |
Miscellaneous |
16,960 |
5,898 |
11,062 |
21,197 |
6,889 |
14,308 |
| |
|
|
|
of which |
|
|
|
|
|
|
| |
|
|
|
Software Services |
11,656 |
857 |
10,799 |
12,220 |
924 |
11,296 |
| |
|
|
|
Business Services |
3,550 |
3,127 |
423 |
4,840 |
3,531 |
1,309 |
| |
|
|
|
Financial Services |
609 |
628 |
-19 |
1,670 |
965 |
705 |
| |
|
|
|
Communication Services |
510 |
226 |
284 |
740 |
296 |
444 |
| |
|
b) |
Transfers |
12,307 |
658 |
11,649 |
13,719 |
832 |
12,887 |
| |
|
|
i) |
Official |
148 |
111 |
37 |
51 |
100 |
-49 |
| |
|
|
ii) |
Private |
12,159 |
547 |
11,612 |
13,668 |
732 |
12,936 |
| |
|
c) |
Income |
3,573 |
4,447 |
-874 |
4,145 |
4,938 |
-793 |
| |
|
|
i) |
Investment Income |
3,418 |
4,117 |
-699 |
3,855 |
4,606 |
-751 |
| |
|
|
ii) |
Compensation of Employees |
155 |
330 |
-175 |
290 |
332 |
-42 |
| |
Total Current Account (I+II) |
87,474 |
96,470 |
-8,996 |
92,892 |
105,721 |
-12,829 |
B. |
Capital Account |
|
|
|
|
|
|
| |
1. |
Foreign Investment (a+b) |
52,916 |
48,138 |
4,778 |
51,883 |
47,629 |
4,254 |
| |
|
a) |
Foreign Direct Investment (i+ii) |
12,152 |
3,163 |
8,989 |
9,252 |
3,688 |
5,564 |
| |
|
|
i) |
In India |
11,913 |
22 |
11,891 |
8,834 |
52 |
8,782 |
| |
|
|
|
Equity |
10,240 |
22 |
10,218 |
7,304 |
52 |
7,252 |
| |
|
|
|
Reinvested Earnings |
1,502 |
— |
1,502 |
1,502 |
— |
1,502 |
| |
|
|
|
Other Capital |
171 |
— |
171 |
28 |
— |
28 |
| |
|
|
ii) |
Abroad |
239 |
3,141 |
-2,902 |
418 |
3,636 |
-3,218 |
| |
|
|
|
Equity |
239 |
2,339 |
-2,100 |
418 |
2,854 |
-2,436 |
| |
|
|
|
Reinvested Earnings |
— |
271 |
-271 |
— |
271 |
-271 |
| |
|
|
|
Other Capital |
— |
531 |
-531 |
— |
511 |
-511 |
| |
|
b) |
Portfolio Investment |
40,764 |
44,975 |
-4,211 |
42,631 |
43,941 |
-1,310 |
| |
|
|
i) |
In India |
40,745 |
44,923 |
-4,178 |
42,618 |
43,919 |
-1,301 |
| |
|
|
|
of which |
|
|
|
|
|
|
| |
|
|
|
FIIs |
39,746 |
44,923 |
-5,177 |
42,482 |
43,919 |
-1,438 |
| |
|
|
|
GDRs/ADRs |
999 |
— |
999 |
136 |
— |
136 |
| |
|
|
ii) |
Abroad |
19 |
52 |
-33 |
13 |
22 |
-9 |
| |
2. |
Loans (a+b+c) |
13,853 |
9,625 |
4,228 |
16,341 |
12,780 |
3,561 |
| |
|
a) |
External Assistance |
909 |
558 |
351 |
1,095 |
577 |
518 |
| |
|
|
i) |
By India |
6 |
8 |
-2 |
6 |
8 |
-2 |
| |
|
|
ii) |
To India |
903 |
550 |
353 |
1,089 |
569 |
520 |
| |
|
b) |
Commercial Borrowings |
2,768 |
1,288 |
1,480 |
3,637 |
1,886 |
1,751 |
| |
|
|
i) |
By India |
404 |
193 |
211 |
532 |
138 |
394 |
| |
|
|
ii) |
To India |
2,364 |
1,095 |
1,269 |
3,105 |
1,748 |
1,357 |
| |
|
c) |
Short Term To India |
10,176 |
7,779 |
2,397 |
11,609 |
10,317 |
1,292 |
| |
|
|
i) |
Suppliers’ Credit >180 days & Buyers’ Credit |
9,256 |
7,779 |
1,477 |
11,609 |
9,766 |
1,843 |
| |
|
|
ii) |
Suppliers’ Credit up to 180 days |
920 |
— |
920 |
— |
551 |
-551 |
| |
3. |
Banking Capital (a+b) |
21,952 |
19,256 |
2,696 |
16,215 |
14,084 |
2,131 |
| |
|
a) |
Commercial Banks |
21,952 |
19,105 |
2,847 |
16,215 |
14,081 |
2,134 |
| |
|
|
i) |
Assets |
11,457 |
10,533 |
924 |
6,446 |
5,154 |
1,292 |
| |
|
|
ii) |
Liabilities |
10,495 |
8,572 |
1,923 |
9,769 |
8,927 |
842 |
| |
|
|
|
of which: Non-Resident Deposits |
9,063 |
8,249 |
814 |
9,174 |
8,915 |
259 |
| |
|
b) |
Others |
— |
151 |
-151 |
— |
3 |
-3 |
| |
4. |
Rupee Debt Service |
— |
30 |
-30 |
— |
3 |
-3 |
| |
5. |
Other Capital |
2,374 |
2,923 |
-549 |
882 |
2,973 |
-2,091 |
| |
Total Capital Account (1 to 5) |
91,095 |
79,972 |
11,123 |
85,321 |
77,469 |
7,852 |
C. |
Errors & Omissions |
108 |
— |
108 |
243 |
— |
243 |
D. |
Overall Balance (Total Current Account, Capital Account and Errors & Omissions (A+B+C)) |
178,677 |
176,442 |
2,235 |
178,456 |
183,190 |
-4,734 |
E. |
Monetary Movements (i+ii) |
— |
2235 |
-2,235 |
4,734 |
— |
4,734 |
| |
i) |
I.M.F. |
— |
— |
— |
— |
— |
— |
| |
ii) |
Foreign Exchange Reserves (Increase – / Decrease +) |
— |
2235 |
-2,235 |
4,734 |
— |
4,734 |
|
| |
Statement I : India's Overall Balance of Payments (Contd.) |
(US $ million) |
Item |
Oct-Dec 2008 P |
Oct-Dec 2007 PR |
Credit |
Debit |
Net |
Credit |
Debit |
Net |
1 |
44 |
45 |
46 |
47 |
48 |
49 |
A. |
Current Account |
|
|
|
|
|
|
| |
I. |
Merchandise |
36,707 |
73,014 |
-36,307 |
40,985 |
67,038 |
-26,053 |
| |
II. |
Invisibles (a+b+c) |
39,308 |
17,645 |
21,663 |
39,553 |
18,031 |
21,522 |
| |
|
a) |
Services |
24,730 |
11,933 |
12,797 |
24,618 |
12,592 |
12,026 |
| |
|
|
i) |
Travel |
2,924 |
1,989 |
935 |
3,395 |
2,519 |
876 |
| |
|
|
ii) |
Transportation |
2,531 |
3,210 |
-679 |
2,799 |
3,043 |
-244 |
| |
|
|
iii) |
Insurance |
344 |
269 |
75 |
438 |
261 |
177 |
| |
|
|
iv) |
G.n.i.e. |
97 |
233 |
-136 |
90 |
75 |
15 |
| |
|
|
v) |
Miscellaneous |
18,834 |
6,232 |
12,602 |
17,896 |
6,694 |
11,202 |
| |
|
|
|
of which |
|
|
|
|
|
|
| |
|
|
|
Software Services |
10,744 |
580 |
10,164 |
9,608 |
852 |
8,756 |
| |
|
|
|
Business Services |
4,333 |
3,268 |
1,065 |
4,588 |
4,245 |
343 |
| |
|
|
|
Financial Services |
1,111 |
735 |
376 |
882 |
763 |
119 |
| |
|
|
|
Communication Services |
547 |
217 |
330 |
601 |
183 |
418 |
| |
|
b) |
Transfers |
11,387 |
847 |
10,540 |
11,428 |
493 |
10,935 |
| |
|
|
i) |
Official |
285 |
101 |
184 |
195 |
121 |
74 |
| |
|
|
ii) |
Private |
11,102 |
746 |
10,356 |
11,233 |
372 |
10,861 |
| |
|
c) |
Income |
3,191 |
4,865 |
-1,674 |
3,507 |
4,946 |
-1,439 |
| |
|
|
i) |
Investment Income |
3,000 |
4,535 |
-1,535 |
3,401 |
4,679 |
-1,278 |
| |
|
|
ii) |
Compensation of Employees |
191 |
330 |
-139 |
106 |
267 |
-161 |
| |
Total Current Account (I+II) |
76,015 |
90,659 |
-14,644 |
80,538 |
85,069 |
-4,531 |
B. |
Capital Account |
|
|
|
|
|
|
| |
1. |
Foreign Investment (a+b) |
33,523 |
38,523 |
-5,000 |
86,531 |
69,639 |
16,892 |
| |
|
a) |
Foreign Direct Investment (i+ii) |
6,925 |
6,105 |
820 |
8,316 |
6,275 |
2,041 |
| |
|
|
i) |
In India |
6,713 |
29 |
6,684 |
7,916 |
43 |
7,873 |
| |
|
|
|
Equity |
4,109 |
29 |
4,080 |
6,022 |
43 |
5,979 |
| |
|
|
|
Reinvested Earnings |
1,721 |
— |
1,721 |
1,792 |
— |
1,792 |
| |
|
|
|
Other Capital |
883 |
— |
883 |
102 |
— |
102 |
| |
|
|
ii) |
Abroad |
212 |
6,076 |
-5,864 |
400 |
6,232 |
-5,832 |
| |
|
|
|
Equity |
212 |
4,491 |
-4,279 |
400 |
5,206 |
-4,806 |
| |
|
|
|
Reinvested Earnings |
— |
271 |
-271 |
— |
271 |
-271 |
| |
|
|
|
Other Capital |
— |
1,314 |
-1,314 |
— |
755 |
-755 |
| |
|
b) |
Portfolio Investment |
26,598 |
32,418 |
-5,820 |
78,215 |
63,364 |
14,851 |
| |
|
|
i) |
In India |
26,568 |
32,355 |
-5,787 |
78,096 |
63,345 |
14,751 |
| |
|
|
|
of which |
|
|
|
|
|
|
| |
|
|
|
FIIs |
26,561 |
32,355 |
-5,794 |
72,309 |
63,345 |
8,964 |
| |
|
|
|
GDRs/ADRs |
7 |
— |
7 |
5,597 |
— |
5,597 |
| |
|
|
ii) |
Abroad |
30 |
63 |
-33 |
119 |
19 |
100 |
| |
2. |
Loans (a+b+c) |
16,848 |
15,115 |
1,733 |
21,543 |
10,601 |
10,942 |
| |
|
a) |
External Assistance |
1,655 |
663 |
992 |
1,109 |
544 |
565 |
| |
|
|
i) |
By India |
6 |
8 |
-2 |
6 |
7 |
-1 |
| |
|
|
ii) |
To India |
1,649 |
655 |
994 |
1,103 |
537 |
566 |
| |
|
b) |
Commercial Borrowings |
5,628 |
1,745 |
3,883 |
8,449 |
2,202 |
6,247 |
| |
|
|
i) |
By India |
669 |
149 |
520 |
363 |
384 |
-21 |
| |
|
|
ii) |
To India |
4,959 |
1,596 |
3,363 |
8,086 |
1,818 |
6,268 |
| |
|
c) |
Short Term To India |
9,565 |
12,707 |
-3,142 |
11,985 |
7,855 |
4,130 |
| |
|
|
i) |
Suppliers’ Credit >180 days & Buyers’ Credit |
9,565 |
10,357 |
-792 |
10,231 |
7,855 |
2,376 |
| |
|
|
ii) |
Suppliers’ Credit up to 180 days |
— |
2,350 |
-2,350 |
1,754 |
— |
1,754 |
| |
3. |
Banking Capital (a+b) |
14,811 |
19,767 |
-4,956 |
12,588 |
12,381 |
207 |
| |
|
a) |
Commercial Banks |
14,808 |
19,336 |
-4,528 |
12,585 |
12,029 |
556 |
| |
|
|
i) |
Assets |
5,192 |
7,542 |
-2,350 |
5,636 |
3,939 |
1,697 |
| |
|
|
ii) |
Liabilities |
9,616 |
11,794 |
-2,178 |
6,949 |
8,090 |
-1,141 |
| |
|
|
|
of which: Non-Resident Deposits |
9,523 |
8,481 |
1,042 |
6,456 |
7,309 |
-853 |
| |
|
b) |
Others |
3 |
431 |
-428 |
3 |
352 |
-349 |
| |
4. |
Rupee Debt Service |
— |
— |
— |
— |
— |
— |
| |
5. |
Other Capital |
4,777 |
237 |
4,540 |
6,612 |
3,636 |
2,976 |
| |
Total Capital Account (1 to 5) |
69,959 |
73,642 |
-3,683 |
127,274 |
96,257 |
31,017 |
C. |
Errors & Omissions |
446 |
— |
446 |
252 |
— |
252 |
D. |
Overall Balance (Total Current Account, Capital Account and Errors & Omissions (A+B+C)) |
146,420 |
164,301 |
-17,881 |
208,064 |
181,326 |
26,738 |
E. |
Monetary Movements (i+ii) |
17,881 |
— |
17,881 |
— |
26738 |
-26738 |
| |
i) |
I.M.F. |
— |
— |
— |
— |
— |
— |
| |
ii) |
Foreign Exchange Reserves (Increase – / Decrease +) |
17,881 |
— |
17,881 |
— |
26,738 |
-26738 |
|
| |
Statement I : India's Overall Balance of Payments (Concld.) |
(US $ million) |
Item |
Apr-Dec 2007PR |
Apr-Dec 2008 P |
Credit |
Debit |
Net |
Credit |
Debit |
Net |
1 |
50 |
51 |
52 |
53 |
54 |
55 |
A. Current Account |
|
|
|
|
|
|
| |
I. |
Merchandise |
113,614 |
182,894 |
-69,280 |
133,527 |
238,864 |
-105,337 |
| |
II. |
Invisibles (a+b+c) |
103,446 |
49,674 |
53,772 |
122,854 |
53,986 |
68,868 |
| |
|
a) |
Services |
64,095 |
34,097 |
29,998 |
74,532 |
37,399 |
37,133 |
| |
|
|
i) |
Travel |
7,731 |
6,472 |
1,259 |
8,214 |
6,857 |
1,357 |
| |
|
|
ii) |
Transportation |
6,843 |
8,128 |
-1,285 |
7,961 |
10,282 |
-2,321 |
| |
|
|
iii) |
Insurance |
1,152 |
730 |
422 |
1,058 |
803 |
255 |
| |
|
|
iv) |
G.n.i.e. |
252 |
313 |
-61 |
308 |
438 |
-130 |
| |
|
|
v) |
Miscellaneous |
48,117 |
18,454 |
29,663 |
56,991 |
19,019 |
37,972 |
| |
|
|
|
of which |
|
|
|
|
|
|
| |
|
|
|
Software Services |
27,494 |
2,332 |
25,162 |
34,620 |
2,361 |
32,259 |
| |
|
|
|
Business Services |
12,240 |
10,945 |
1,295 |
12,723 |
9,926 |
2,797 |
| |
|
|
|
Financial Services |
2,326 |
1,914 |
412 |
3,390 |
2,328 |
1,062 |
| |
|
|
|
Communication Services |
1,727 |
594 |
1,133 |
1,797 |
739 |
1,058 |
| |
|
b) |
Transfers |
29,764 |
1,333 |
28,431 |
37,413 |
2,337 |
35,076 |
| |
|
|
i) |
Official |
506 |
398 |
108 |
484 |
312 |
172 |
| |
|
|
ii) |
Private |
29,258 |
935 |
28,323 |
36,929 |
2,025 |
34,904 |
| |
|
c) |
Income |
9,587 |
14,244 |
-4,657 |
10,909 |
14,250 |
-3,341 |
| |
|
|
i) |
Investment Income |
9,288 |
13,481 |
-4,193 |
10,273 |
13,258 |
-2,985 |
| |
|
|
ii) |
Compensation of Employees |
299 |
763 |
-464 |
636 |
992 |
-356 |
| |
Total Current Account (I+II) |
217,060 |
232,568 |
-15,508 |
256,381 |
292,850 |
-36,469 |
B. |
Capital Account |
|
|
|
|
|
|
| |
1. |
Foreign Investment (a+b) |
183,770 |
143,573 |
40,197 |
138,322 |
134,290 |
4,032 |
| |
|
a) |
Foreign Direct Investment (i+ii) |
22,088 |
15,183 |
6,905 |
28,329 |
12,956 |
15,373 |
| |
|
|
i) |
In India |
20,121 |
82 |
20,039 |
27,460 |
103 |
27,357 |
| |
|
|
|
Equity |
14,418 |
82 |
14,336 |
21,653 |
103 |
21,550 |
| |
|
|
|
Reinvested Earnings |
5,376 |
— |
5,376 |
4,725 |
— |
4,725 |
| |
|
|
|
Other Capital |
327 |
— |
327 |
1,082 |
— |
1,082 |
| |
|
|
ii) |
Abroad |
1,967 |
15,101 |
-13,134 |
869 |
12,853 |
-11,984 |
| |
|
|
|
Equity |
1,967 |
12,479 |
-10,512 |
869 |
9,684 |
-8,815 |
| |
|
|
|
Reinvested Earnings |
— |
813 |
-813 |
— |
813 |
-813 |
| |
|
|
|
Other Capital |
— |
1,809 |
-1,809 |
— |
2,356 |
-2,356 |
| |
|
b) |
Portfolio Investment |
161,682 |
128,390 |
33,292 |
109,993 |
121,334 |
-11,341 |
| |
|
|
i) |
In India |
161,500 |
128,342 |
33,158 |
109,931 |
121,197 |
-11,266 |
| |
|
|
|
of which |
|
|
|
|
|
|
| |
|
|
|
FIIs |
152,813 |
128,342 |
24,471 |
108,789 |
121,197 |
-12,408 |
| |
|
|
|
GDRs/ADRs |
8,390 |
— |
8,390 |
1,142 |
— |
1,142 |
| |
|
|
ii) |
Abroad |
182 |
48 |
134 |
62 |
137 |
-75 |
| |
2. |
Loans (a+b+c) |
58,034 |
28,631 |
29,403 |
47,042 |
37,520 |
9,522 |
| |
|
a) |
External Assistance |
2,824 |
1,550 |
1,274 |
3,659 |
1,798 |
1,861 |
| |
|
|
i) |
By India |
18 |
21 |
-3 |
18 |
24 |
-6 |
| |
|
|
ii) |
To India |
2,806 |
1,529 |
1,277 |
3,641 |
1,774 |
1,867 |
| |
|
b) |
Commercial Borrowings |
23,030 |
5,620 |
17,410 |
12,033 |
4,919 |
7,114 |
| |
|
|
i) |
By India |
1,165 |
1,232 |
-67 |
1,605 |
480 |
1,125 |
| |
|
|
ii) |
To India |
21,865 |
4,388 |
17,477 |
10,428 |
4,439 |
5,989 |
| |
|
c) |
Short Term To India |
32,180 |
21,461 |
10,719 |
31,350 |
30,803 |
547 |
| |
|
|
i) |
Suppliers’ Credit >180 days & Buyers’ Credit |
28,126 |
21,461 |
6,665 |
30,430 |
27,902 |
2,528 |
| |
|
|
ii) |
Suppliers’ Credit up to 180 days |
4,054 |
— |
4,054 |
920 |
2,901 |
-1,981 |
| |
3. |
Banking Capital (a+b) |
34,862 |
28,931 |
5,931 |
52,978 |
53,107 |
-129 |
| |
|
a) |
Commercial Banks |
34,835 |
28,502 |
6,333 |
52,975 |
52,522 |
453 |
| |
|
|
i) |
Assets |
12,583 |
7,158 |
5,425 |
23,095 |
23,229 |
-134 |
| |
|
|
ii) |
Liabilities |
22,252 |
21,344 |
908 |
29,880 |
29,293 |
587 |
| |
|
|
|
of which: Non-Resident Deposits |
18,683 |
19,614 |
-931 |
27,760 |
25,645 |
2,115 |
| |
|
b) |
Others |
27 |
429 |
-402 |
3 |
585 |
-582 |
| |
4. |
Rupee Debt Service |
— |
45 |
-45 |
— |
33 |
–33 |
| |
5. |
Other Capital |
15,141 |
8,663 |
6,478 |
8,033 |
6,133 |
1,900 |
| |
Total Capital Account (1 to 5) |
291,807 |
209,843 |
81,964 |
246,375 |
231,083 |
15,292 |
C. |
Errors & Omissions |
718 |
— |
718 |
797 |
— |
797 |
D. |
Overall Balance (Total Current Account, Capital Account and Errors & Omissions (A+B+C)) |
509,585 |
442,411 |
67,174 |
503,553 |
523,933 |
-20,380 |
E. |
Monetary Movements (i+ii) |
— |
67,174 |
-67,174 |
20,380 |
— |
20,380 |
| |
i) |
I.M.F. |
— |
— |
— |
— |
— |
— |
| |
ii) |
Foreign Exchange Reserves (Increase – / Decrease +) |
— |
67,174 |
-67,174 |
20,380 |
— |
20,380 |
|


