India’s Foreign Trade: 2012-13 (April - December) - আৰবিআই - Reserve Bank of India
India’s Foreign Trade: 2012-13 (April - December)
India’s Foreign Trade: 2012-13 (April-December)* This article reviews India’s merchandise trade performance during April-December 2012-13 on the basis of the data released by the Directorate General of Commercial Intelligence and Statistics (DGCI&S). It also analyses disaggregated commodity-wise and directionwise details during this period. Highlights India’s trade performance during 2012-13 (upto December 2012) continued to be weak as the trade deficit increased to US$ 147.2 billion reflecting substantial contraction in merchandise exports as compared to imports. The deterioration in export performance was evident across far more commodity groups as well as export destinations in H1 of 2012-13 as concerns regarding global slowdown escalated further during the period. Contraction in exports of manufactured goods, contributing around 64 per cent of total merchandise exports significantly impacted India’s export performance. Of which, labour intensive sectors like handicrafts, textiles and gems & jewellery witnessed significant decline. Recovery in the trade sector is largely contingent upon the revival of global demand. As per latest projections by the IMF, global trade volume is expected to grow by 3.8 per cent in 2013 as against 2.8 per cent in 2012. Major highlights of India’s trade performance during the period of April- December 2012-13 are given below:
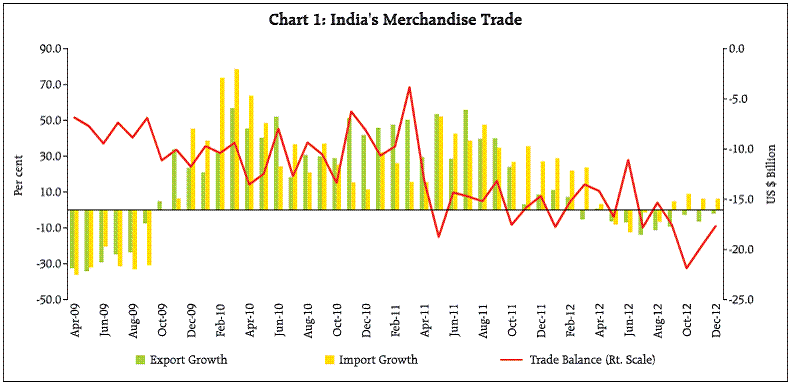
I. India’s Merchandise Trade Exports (April-December 2012) Although export performance continued to be weak during this period, decline in exports in Q3 of 2012-13 was relatively less pronounced than that in H1 of 2012-13, perhaps reflecting the impact of export promotional measures undertaken by the Government in June 2012 (Chart 1). Lingering global uncertainties and weakness in advanced and EMDEs, however, continued to weigh on India’s external demand. Exports during April-December 2012 stood at US$ 214.1 billion with a decline of 5.5 per cent as against US$ 226.6 billion in April-December 2011 with an increase of 29.6 per cent (Table 1).
Commodity-wise and Destination-wise Exports (April-September 2012-13) Disaggregated commodity-wise export data show that decline or deceleration in growth that began in H2 of the preceding financial year seem to have gathered momentum in H1 of 2012-13 (Table 2). Major items which moved from positive growth territory in the second half of preceding year to the negative growth territory in the current year include engineering goods, petroleum products, textiles and iron ore. Exports of iron ore continued to show growth deceleration reflecting the persistent impact of poor mining activity, increase in export duty since end-December 2011, increase in freights for iron ore exports and increase in iron ore price by about 8-13 per cent by the state owned miners. Though slower growth has been pervasive across all major sectors, some minor subsectors or commodities, however recorded accelerated growth. These mainly include tobacco, wheat, rice, processed minerals, manufacture of metal and carpets which together constitute less than 8 per cent of total exports. Destination wise data show that exports to countries in the European Union and Asian countries has suffered a major setback. While exports to EU, accounting for 16.3 per cent in India’s merchandise exports, declined by 11.2 per cent, those to Asian countries, (excluding Japan) with a share of 28.1 per cent, contracted by 8.4 per cent during April-September 2012 (Table 3). Even though India’s exports have gradually became more diversified over the years through various policy measures (Box I), the growth deceleration in most of the Asian economies seems to have affected India’s exports in H1 of 2012-13. In particular, a significant decline was observed in external demand from export-oriented Asian economies, viz., China, Japan, Singapore, Hong Kong, South Korea and Malaysia. With scaling down of manufacturing activity in these economies, the demand for inputs from India seems to have been affected. Growth in exports to African and Latin American countries was also substantially lower during April-September 2012 as compared with corresponding period of 2011-12.
As shown in Table 4 and Table 5, high growth in exports recorded during H1 of 2011-12 was well diversified across region. As growth concerns evident in advanced economies spread over emerging market and developing economies as well, India’s exports began to be impacted since H2 of 2011-12. For instance, the relative weighted contribution of developing Asia to total export growth declined to 4.3 percentage points in H2 of 2011-12 and later turned negative to 2.4 percentage points in H1 of 2012-13 (13.1 percentage points in H1 of 2011-12). Similarly, the relative contribution of newly explored markets in Africa and Latin America in India’s export growth also recorded a sharp decline in H1 of 2012-13. It implies that India’s exports were impacted not only due to fragile economic and financial conditions in traditional markets like the US and the EU but also due to slowdown in relatively new markets in Asia, Africa and Latin America which appear to have been affected more by adverse spillovers from the advanced economies.
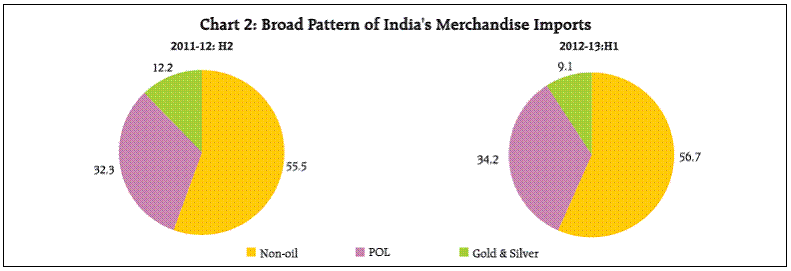
Box I: Policy Measures to Diversify India’s Exports: Destination-wise In recent years, India has made a distinct shift in terms of country-wise diversification of export. In fact, recognising the changing dynamics of world growth, India’s trade policy recognised the need for adopting a market diversification strategy. As a part of the strategic plan, the Government accorded significant priority to market diversification of India’s exports and building up a brand image of India. India’s strategy towards market diversification emphasises (i) retaining presence in traditional advanced country markets, (ii) move up the value chain in providing products in traditional export markets and (iii) explore opportunities both in terms of markets and products in newly opened up emerging markets. An inter-temporal comparison of India’s destinationwise exports shows that the share of EMDEs in India’s total merchandise exports has increased gradually since mid-1990s. Initiated along with the new economic policy in 1991, the Look East Policy seems to have boosted India’s trade linkages with South-East Asian countries. Since the liberalisation of the economy, the Government provided a conducive policy environment through a mix of measures including fiscal incentives, institutional changes, procedural rationalisation, and efforts for enhanced market access across the world to boost exports. In 2006, the Government introduced a focus market scheme (FMS) which underscored the strategic necessity of enlarging India’s market share in potential market. Under FMS, the Government allows duty credit facility linked to the FOB value of exports of all products to the notified countries. The objective of FMS was to offset the high freight cost and other difficulties faced by exporters entering international markets. Since its inception, the list of countries notified under FMS has been gradually expanded. During 2008-09 to 2011-12, 29 new countries have been included within the ambit of FMS. The scope under other schemes, viz., the Market Linked Focus Product Scheme (MLFPS) has also been expanded. The coverage of FMS, Special FMS and Market-Linked Focus Product Scheme was further broadened in 2012-13 (June 2012 and December 2012). With increasing policy attention to explore new export markets in EMDEs, the high growth destinations, such as East Asian and South-East Asian economies like China, Singapore and Hong Kong have dominated the India’s exports scenario with the third, fourth and fifth positions in recent years. Not only that United Arab Emirates has emerged the top destination for India’s exports, exports to other EMDEs, Brazil, Indonesia and Saudi Arabia have also increased significantly over the years. Imports (April-December 2012) Merchandise imports during April-December 2012-13 stood at US$ 361.3 billion, compared with US$ 363.9 billion for the same period in 2011-12, registering a marginal decline of 0.7 per cent (35.2 per cent in April-December 2011-12 ). The fall in growth rate of imports was led by decline in import of gold and nonoil non-gold imports. While the decline in former reflects the impact of hike in customs duty during initial months of 2012-13, the latter largely reflects the lower import demand for export related items and overall slowdown in domestic economic activity. Oil imports stood at US$ 125.4 billion during this period in 2012-13 compared to US$ 111.0 billion a year ago. The trend in crude oil prices is shown in Table 6. Commodity-wise and Destination-wise Imports (April-September 2012-13) Commodity wise import data show that in H1 of 2012-13 the import of petroleum, oil and lubricants (POL), which constituted nearly 34 per cent of total merchandise imports, grew at 5.8 per cent in H1 of 2012-13 (Table 7 and Chart 2). Notwithstanding a decline in international price of crude oil (Indian basket) by 3.6 per cent during April-September 2012, a positive growth in POL imports essentially reflects rise in quantum terms. Import demand for capital goods and export related goods contracted mainly due to lower investment activity and sluggish export demand. Among capital goods, imports of ‘machine tools’, ‘machinery (both electrical and non electrical)’, ‘transport equipment’ and ‘electronic goods’ recorded a lower growth. Imports of gold and silver declined by 32.6 per cent in H1 of 2012-13, compared to a rise of 74.5 per cent in H1 of 2011-12 perhaps partly due to initial response to increase in customs duty of gold in January and March 2012.1 Among the export related items, imports of pearl precious semi-precious stones and textile yarn have been affected due to fall in global demand.
The data pertaining to country-wise imports reflects the fact that in H1 of 2012-13, China continues to be the largest import source for India with a share of 11.9 per cent of total merchandise imports, followed by the UAE and Saudi Arabia with respective shares of 8.4 per cent and 6.8 per cent. The shares of all these countries in India’s imports have increased in H1 of 2012-13. Despite a fall in the imports from the USA and Switzerland in H1 of 2012-13, these countries continued to be a significant source for India’s imports accounting for 5.2 per cent and 4.6 per cent, respectively of total merchandise imports. Decline in imports from EU led to a fall in its share in India’s total merchandise imports from 12.1 per cent in H1 of 2011-12 to 11.1 per cent in H1 of 2012-13 (Table 8).
Trade Deficit Owing to a sharper contraction in merchandise exports than imports, the trade deficit widened from US$ 137.3 billion in April-December 2011-12 to US$ 147.2 billion in April-December 2012-13. Net oil imports continued to be a major drag on India’s trade deficit implying large domestic energy deficit. Net oil imports accounted for 60.5 per cent of total trade deficit during April-December 2012 as compared with 50.0 per cent during April-December 2011.
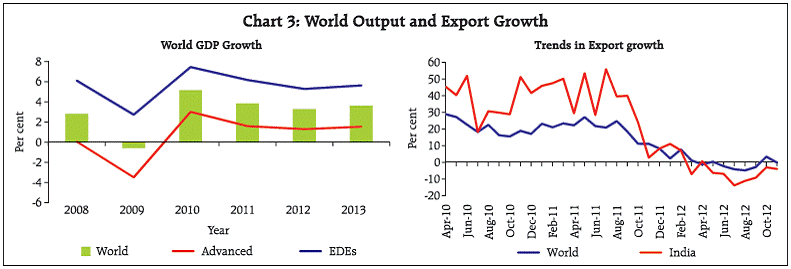
II. Global Trade The growth in world trade volume showed substantial moderation in 2012 as both advanced and emerging market economies were impacted due to trade inter-linkages. Deterioration in India’s export performance was more pronounced than that of total world exports. Going forward, the world growth is projected to increase marginally during 2013 on the back of somewhat diminished risks to growth in the euro area and the United States. Accordingly, the world trade prospects may improve gradually and the IMF also projects a higher growth in world trade volume at 3.8 per cent in 2013 as compared with 2.8 per cent in 2012 (Chart 3).
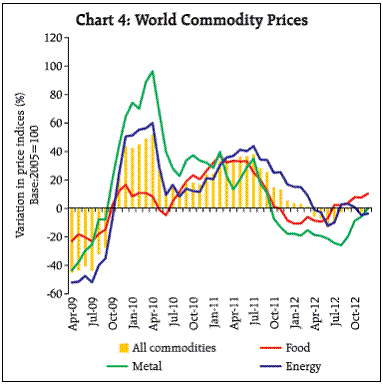
A cross-country comparison based on available data upto Q2 shows that most of the advanced economies and EMDEs have witnessed either decline or decelerated growth in exports. However, among these economies (barring Indonesia), decline was more pronounced in case of India. India’s share in world exports also declined marginally (Table 9). International Commodity Prices In 2012, the movements in commodity prices have been somewhat erratic reflecting major global events. For instance, price movements in the first half of 2012 witnessed easing of commodity prices especially energy and metals as European sovereign debt troubles intensified and emerging economies, especially China, showed deceleration in growth (Chart 4). However, price pressures were distinctly upward in the second half of the year. Upward pressure in the international crude oil prices emanated in the aftermath of EU embargo on Iranian oil imports in July 2012 and also due to persisting political instability in several oilproducing countries in the Middle East. In addition, renewed monetary policy easing by the central banks of the EU and the US as well as weakness of the US dollar caused rebound in other industrial commodities. Upward pressure in food prices was mainly on account of hot weather and dry conditions in the US, Eastern Europe, and Central Asia which reduced maize and wheat output in these areas. III. Outlook Going forward, improvement in India’s export would largely depend on durable recovery in both advanced and EMDEs. Although global growth concerns have diminished somewhat in recent months, immediate recovery in the world economy cannot be expected. A broad set of indicators for global industrial production and trade suggests that global growth has not strengthened further. Recognising the lacklustre performance of export sector due to global factors, the government announced second round of export promotion measures on December 26, 2012. These mainly included (i) extension of interest subvention scheme for select employment oriented sectors (including SMEs in all sectors) upto end-March 2014, (ii) introduction of “pilot scheme” of 2 per cent interest subvention for project exports through EXIM Bank for countries of SAARC region, (iii) broadening the scope of Focus Market Scheme and Special Focus Market Scheme, Market Linked Focus Product Scheme and (iv) incentive on incremental exports to the US, EU and countries of Asia during the period January-March 2013 over the base period. In January 2013, the Reserve Bank allowed swap facility for expansion of export credit in foreign currency. Under the swap arrangement, a bank can buy US Dollars, up to its eligible swap limit, from the Reserve Bank and simultaneously sell the same amount of US Dollar forward as per the term of the swap at the prevailing market rates for swaps of similar tenor. At the end of the swap term, the bank will exchange with the Reserve Bank the US Dollars against Rupee. The Reserve Bank had enhanced the period of realisation and repatriation of proceeds representing the full export value of goods or software exported, from six months to twelve months from the date of export which has been further extended up to March 31, 2013. Notwithstanding these measures, quick recovery in exports to major trading partners may not be imminent unless growth in both advanced and EMDEs picks up. To curb demand for some of major import items, the government has announced certain measures. For instance, the customs duty on gold was raised further from 4 per cent to 6 per cent in January 2013. Similarly, government has allowed oil marketing companies to gradually raise the retail diesel prices. The impact of such measures on India’s overall trade deficit is yet to be seen and can be expected in the medium term, provided global outlook also improves significantly.
* Prepared in the Division of International Trade and Finance, Department of Economic and Policy Research. The previous issue of the article was published in the Reserve Bank Bulletin, December 2012. 1 In January 2013, the customs duty on import of gold was increased further to 6 per cent from 4 per cent. |
|||||||||||||||||||||||||||||||||||||||||||||||||||||||||||||||||||||||||||||||||||||||||||||||||||||||||||||||||||||||||||||||||||||||||||||||||||||||||||||||||||||||||||||||||||||||||||||||||||||||||||||||||||||||||||||||||||||||||||||||||||||||||||||||||||||||||||||||||||||||||||||||||||||||||||||||||||||||||||||||||||||||||||||||||||||||||||||||||||||||||||||||||||||||||||||||||||||||||||||||||||||||||||||||||||||||||||||||||||||||||||||||||||||||||||||||||||||||||||||||||||||||||||||||||||||||||||||||||||||||||||||||||||||||||||||||||||||||||||||||||||||||||||||||||||||||||||||||||||||||||||||||||||||||||||||||||||||||||||||||||||||||||||||||||||||||||||||||||||||||||||


