| This article on Indian investment abroad in joint ventures (JVs) and wholly owned subsidiaries (WOSs), brought out along with the quarterly release of India’s balance of payments (BoP) statistics, reviews India’s outward investment in JVs and WOSs during the quarter October-December 2008 and the period, April-December 2008.
I. India’s Outward FDI Proposals1
I.1 Magnitude
During the quarter, October-December 2008, 828 proposals amounting to US$ 7,409 million were cleared for investments abroad in JVs and WOSs, as against 546 proposals amounting to US$ 7,882 million during October-December 2007. The number of proposals recorded a substantial increase of 51.6 per cent, while, the magnitude of investment proposals showed a decline of 6.0 per cent during the quarter under review (Table 1). Equity accounted for 75.8 per cent of the investment, followed by guarantees (12.9 per cent) and loans (11.3 per cent). During the corresponding quarter of the previous year (October-December 2007), equity constituted 82.1 per cent, guarantees formed 10.3 per cent and loans constituted 7.6 per cent of the amount of proposals for investment. Thus, during the third quarter of 2008-09, the share of equity in total amount of investments proposals declined, while those of loans and guarantees showed increase. 1 India’s outward FDI in this review refers to Indian investment abroad in joint ventures (JVs) and wholly owned subsidiaries (WOSs) by Indian public and private limited companies, registered partnership firms and remittances in respect of production sharing agreements for oil exploration. * Prepared in the Division of International Trade, Department of Economic Analysis and Policy. The previous issue of the article was published in RBI Bulletin, January 2009.
Table 1 : India’s Outward FDI : Proposals Cleared during October - December |
Period/Route of Approval |
Number of Proposals
|
Amount of Proposals (US $ million) |
Equity |
Loans |
Guarantees |
Total |
1 |
2 |
3 |
4 |
5 |
6 |
2007-08 |
|
|
|
|
|
October-December 2007 |
|
|
|
|
|
I. |
Approval Route |
2 |
15.98 |
— |
— |
15.98 |
II. |
Automatic Route |
544 |
6452.88 |
599.61 |
813.82 |
7866.31 |
Total (I+II) |
546 |
6468.86 |
599.61 |
813.82 |
7882.29 |
2008-09 |
|
|
|
|
|
October-December 2008 |
|
|
|
|
|
I. |
Approval Route |
1 |
1.08 |
— |
— |
1.08 |
II. |
Automatic Route |
827 |
5614.64 |
835.3 |
958.09 |
7408.03 |
Total (I+II) |
828 |
5615.72 |
835.3 |
958.09 |
7409.11 |
During the first nine months of 2008-09 (April-December 2008), 2,828 proposals amounting to US$ 16,352 million were cleared for investments abroad in JVs and WOSs, as against 1,595 proposals amounting to US$ 18,437 million during the corresponding period of the previous year (Table 2). The number of proposals recorded an increase of 77.3 per cent over the corresponding period of the previous year, whereas the magnitude of investment proposals showed a decline of 11.3 per cent. Equity accounted for 67.2 per cent of the amount of proposals for investment, followed by loans (18.7 per cent) and guarantees (14.1 per cent). As against this, during the corresponding period of the previous year (April-December 2007), equity constituted 61.4 per cent of the amount of proposals for investment, while guarantees and loans formed 31.4 per cent and 7.2 per cent, respectively. This reflects increase in the share of equity and loans in the financing of investment proposals during the first three quarters of the current financial year as compared to the same period of the previous year.
Table 2 : India's Outward FDI - Proposals Cleared during April - December |
Period/Route of Approval |
Number of Proposals |
Amount of Proposals (US $ million) |
Equity |
Loans |
Guarantees |
Total |
1 |
2 |
3 |
4 |
5 |
|
2007-08 |
|
|
|
|
|
April-December 2007 |
|
|
|
|
|
I. |
Approval Route |
7 |
432.41 |
— |
— |
432.41 |
II. |
Automatic Route |
1588 |
10892.58 |
1331.77 |
5780.50 |
18004.85 |
Total (I+II) |
1595 |
11324.99 |
1331.77 |
5780.50 |
18437.26 |
2008-09 |
|
|
|
|
|
April-December 2008 |
|
|
|
|
|
I. |
Approval Route |
3 |
38.67 |
— |
— |
38.67 |
II. |
Automatic Route |
2825 |
10948.68 |
3059.92 |
2304.44 |
16313.04 |
Total (I+II) |
2828 |
10987.35 |
3059.92 |
2304.44 |
16351.71 |
Route-wise, proposals indicated that during October-December 2008, almost all the proposals cleared were through automatic route and only 1 proposal was cleared through approval route2 . Under approval route, in October 2008, approval was accorded to M/s Gujarat State Petroleum Corporation for their oil exploration project in Australia. During October-December 2007, 99.6 per cent of the proposals involving 99.8 per cent amount were through automatic route, while the rest were through the approval route.
During April-December 2008, 99.9 per cent of the proposals involving 99.8 per cent of the amount were through automatic route and the remaining 0.1 per cent of the proposals involving 0.2 per cent of the amount were through approval route. Under automatic route, equity occupied 67.1 per cent of the amount of investment proposals, 2 Indian residents are permitted to make investment in overseas joint ventures and wholly owned subsidiaries under automatic route and approval route. Under automatic route, all proposals are routed through designated authorized dealer banks and these do not require prior approval from the Reserve Bank. Proposals not covered by the conditions under the automatic route require the prior clearance of the Reserve Bank and come under approval route. whereas under approval route, all the proposals were through equity only. During the corresponding period of the previous year (April-December 2007), 99.6 per cent of the proposals involving 97.7 per cent amount were through automatic route, while the balance 0.4 per cent of the proposals involving 2.3 per cent amount were through the approval route.
I.2 Sectoral Pattern and Direction
I.2.1 Sectoral Pattern
During the quarter, October-December 2008, almost 96 per cent of the total outward FDI proposals cleared were for investments of US$ 5 million and above. Sector-wise, 73 per cent of the proposals were in manufacturing, followed by non-financial services (7 per cent) and trading (6 per cent) and the balance were ‘others’. During the corresponding quarter of the previous year, 10 per cent of the proposals were in manufacturing followed by non-financial services (7 per cent) and trading (6 per cent) and the rest were ‘others’. Within the manufacturing sector, investment proposals were in the areas like industrial lubricants, power generation, electrical equipments and construction. In trading the investment proposals were in sectors like pharmaceutical formulation and healthcare products. Proposals in non-financial services included activities, such as software development services and textiles. The category of ‘others’ comprised real estate development and construction, producing and telecasting of teleserials, oil exploration and films.
The overall investment proposals during April-December 2008 indicated that almost 95 per cent were for investments of US$ 5 million and above. Sector-wise, 57 per cent of the proposals were in manufacturing followed by non-financial services (9 per cent), trading (6 per cent) and the balance were ‘others’ (Table 3 and Chart 1). During April-December 2007, 43 per cent of the proposals were in manufacturing followed by non-financial services (10 per cent) and trading (4 per cent) and the rest were ‘others’. The pattern of investment proposals during April-December 2008 revealed an increase in the share of manufacturing and trading and marginal decline in the share of non-financial services as compared with the corresponding period of the previous year.
Table 3 : Sector-wise Distribution of India’s Outward FDI |
(US $ million) |
Sectors |
2007-08 |
2008-09 |
October-December |
April-December |
October-December |
April-December |
1 |
2 |
3 |
4 |
|
Trading |
426.5 |
620.5 |
407.8 |
993.1 |
Manufacturing |
759.8 |
7634.0 |
5165.0 |
8750.3 |
Financial Services |
32.5 |
32.5 |
87.5 |
205.1 |
Non-Financial Services |
506.3 |
1677.7 |
481.0 |
1392.5 |
Others |
6031.1 |
7681.1 |
969.0 |
4116.9 |
Total |
7756.2 |
17645.8 |
7110.3 |
15457.9 |
Note: Figures relate to investments of US$ 5 million and above. |
I.2.2 Direction
Direction of investment proposals during October-December 2008 revealed that Netherlands, the UK and Singapore together accounted for 73 per cent of the amount of proposals for outward FDI (US$ 5 million and above). As against this, during the corresponding quarter of the previous year, Singapore, Mauritius and the US accounted for 72 per cent of the proposals.
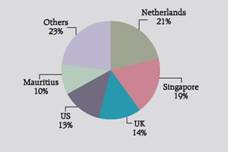
During April-December 2008, Netherlands, Singapore and the UK together accounted for 54 per cent of the proposals for outward FDI (US$ 5 million and above) [Table 4 and Chart 2]. During the corresponding period of the previous year, Singapore and Netherlands accounted for 63 per cent of the amount of proposals.
Chart 1 : Distribution of India's Outward FDI
Chart 1 (a): Distribution of India's Outward FDI during April-December 2007 (Per cent Shares)
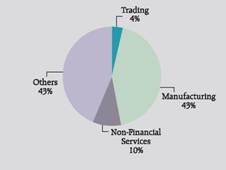
Chart 1 (b): Distribution of India's Outward FDI during April-December 2008 (Per cent Shares)
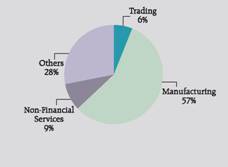
Table 4 : Direction of India’s Outward FDI |
(US $ million) |
Country |
2007-08 |
2008-09 |
October-December |
April-December |
October-December |
April-December |
1 |
2 |
3 |
4 |
5 |
Netherlands |
281.7 |
5045.4 |
2298.2 |
3230.3 |
UK |
45.9 |
319.3 |
1765.4 |
2265.7 |
Singapore |
5198.8 |
7155.8 |
1245.9 |
2954.1 |
Mauritius |
706.4 |
875.1 |
733.3 |
1624.0 |
US |
499.3 |
828.7 |
288.5 |
2063.4 |
UAE |
101.5 |
192.4 |
285.4 |
745.8 |
Cyprus |
43.3 |
232.0 |
87.5 |
240.7 |
Australia |
20.0 |
20.0 |
84.8 |
133.9 |
Thailand |
5.6 |
5.6 |
82.4 |
82.4 |
Bermuda |
— |
— |
69.7 |
69.7 |
Others |
1996.0 |
4553.9 |
308.3 |
2259.7 |
Total |
8898.5 |
19228.2 |
7249.5 |
15669.6 |
Note: Figures relate to investments of US$ 5 million and above. |
Chart 2: Direction of India's Outward FDI
Chart 2(a): Direction of India's Outward FDI during April-December 2007 (Per cent Shares)
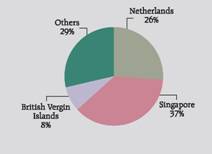 Chart 2 (b): Direction of India's Outward FDI during April-December 2008 (Per cent Shares)
II. India’s Outward FDI: Actual Outflows3
II.1 Magnitude of Outflows
Actual outward FDI in JVs and WOSs during the quarter October-December 2008 stood at US$ 5,569 million, showing a decline of 2.0 per cent over US$ 5,680 million during the corresponding period of the previous year.
Of the total investments, 76 per cent were in the form of equity and the remaining 24 per cent were loans. During October-December 2007, 87 per cent of the outward investments were in the form of equity and the remaining 13 per cent were loans.
During the period April-December 2008, the actual outward FDI in JVs and WOSs stood at US$ 11,301 million, registering a decline of 15.3 per cent over the investment of US$ 13,346 million during the corresponding period of the previous year (Table 5). Of the total investments, 79 per cent were in the form of equity and 21 per cent were loans. Against this, during April-December 2007, 87 per cent of the investments in JVs and WOSs were in the form of equity and the remaining 13 per cent were loans. Thus, during April-December 2008, the share of equity has gone down in the outward investments with the amount of equity showing a decline of 22.5 per cent.
The United Nations Conference on Trade and Development (UNCTAD), in a survey on global foreign direct investment (FDI) highlighted that the motives behind the growth of FDI during the coming few years would be market seeking and resource seeking, even while global risk factors such as geopolitical instability, protectionist policies and uncertainties about world economic growth could potentially obstruct the investment flows (Box).
Table 5 : India’s Outward FDI : Actual Outflows |
(US $ million) |
Period |
Equity |
Loans |
Guarantees Invoked |
Total |
1 |
2 |
3 |
4 |
5 |
2007-08 |
|
|
|
|
October-December 2007 |
4925.13 |
754.82 |
— |
5679.95 |
April-December 2007 |
11546.24 |
1799.88 |
— |
13346.12 |
2008-09 |
|
|
|
|
October-December 2008 |
4254.49 |
1314.21 |
— |
5568.70 |
April-December 2008 |
8944.96 |
2355.85 |
— |
11300.81 |
Note: Data are provisional. |
3 Financing of outward FDI by Indian entities is broadly in the form of equity, loan and guarantee. These include sources, such as drawal of foreign exchange in India, capitalization of exports, funds raised through external commercial borrowings, foreign currency convertible bonds and ADRs/GDRs, and also through leveraged buyouts by way of setting up of special purpose vehicles (SPVs). The equity data presented in this review do not include equity of individuals and banks, and the SPVs set up for funding overseas investment, while BoP statistics, in addition, include the equity of banks (unincorporated banks’ branches operating abroad). Box : UNCTAD Survey on Global Investment The United Nations Conference on Trade and Development (UNCTAD) in its global survey on FDI brought out in 2007 portrayed the likely evolution of foreign direct investment (FDI) over the period 2007-2009. The survey results indicated that significant motives behind the growth of FDI during the coming few years would be market-seeking and resource-seeking (skilled labour, raw material and finance), while there would be opportunities for world-over expansion, but global risk factors such as geopolitical instability, protectionist policies and uncertainties about world economic growth could potentially obstruct the investment flows. Regarding host regions, companies’ preference for South, East and South-East Asia and new EU-12 as investment locations would rise. Western Europe and North America would continue to attract the largest share of FDI flows, whereas regions such as Africa and West Asia would be given a lower degree of preference.
The new FDI projects are expected in primary sector and in service industries like utilities and trade. In manufacturing sector, investment could be attracted in the fields like environment and renewable energies, information and communication technologies, health care and biotechnology. The rise in investment would be from transnational corporations (TNCs) in developed countries as well as emerging economies. Companies from all regions are expected to increase their FDI, with those from developing Asia showing dynamism.
The UNCTAD survey also pointed out long term issues and uncertainties, which might have an impact on FDI in the long term. First is the environment, where negative externalities pertaining to mega cities would lead to a rising attractiveness of medium sized towns for investment projects having widespread impact on geographical and sectoral structure of economies. The depletion/exhaustion of oil resources would affect related activities such as automobiles, transportation, basic chemicals, plastics and pharmaceuticals, thereby leading to important changes in sectoral investment patterns. Second relates to social responsibility concerns as companies are faced with social and ethical issues like impact of their FDI activities on particular sections of society in host and home countries. Third issue is the impact of technological innovation wherein growth of information and communication technologies may impact business networks and investment patterns. New fields could be opened up for relocation of services like call centres and increase investment in these fields which in turn may lead to the dependence of companies on strategic alliances with remote partners and thereby reduce need to establish wholly owned business in foreign countries. The fourth issue is related to the future of organizations as the internal transformation processes of the corporations could have an impact on their world investment patterns. The notion of collaborative work and leveraging of knowledge can affect the way international innovation and research and development networks will be set up and managed. Furthermore, the management of risks and volatile markets could have implications for risk/profitability trade-off in the investment decision-making process. Finally the issue relating to the impact of demographic changes. The ageing of populations in western countries may result into companies shifting the business to locations which are endowed with a younger populations, adopting new types of promotional activities focused on FDI.
(Source: www.unctad.org)
India’s Overseas Investment: Major Liberalisation Measures since 2000
The introduction of FEMA in 2000 brought about significant policy liberalization. The limit for investment up to US$ 50 million, which was earlier available in a block of three years, was made available annually without any profitability condition. Companies were allowed to invest 100 per cent of the proceeds of their ADR/GDR issues for acquisitions of foreign companies and direct investments in JVs and WOSs.
Automatic route was further liberalised in March 2002 wherein Indian parties investing in JVs/WOSs outside India were permitted to invest an amount not exceeding US$ 100 million as against the earlier limit of US$ 50 million in a financial year. Also, the investments under the automatic route could be funded by withdrawal of foreign exchange from an authorized dealer (AD) not exceeding 50 per cent of the net worth of the Indian party.
With a view to enabling Indian corporates to become global players by facilitating their overseas direct investment, permitted end-use for ECB was enlarged to include overseas direct investment in JVs/WOSs in February 2004. This was designed to facilitate corporates to undertake fresh investment or expansion of existing JV/WOS including mergers and acquisitions abroad by harnessing resources at globally competitive rates.
In order to promote Indian investment abroad and to enable Indian companies to reap the benefits of globalization, the ceiling of investment by Indian entities was revised from 100 per cent of the net worth to 200 per cent of the net worth of the investing company under the automatic route for overseas investment. The limit of 200 per cent of the net worth of the Indian party was enhanced to 300 per cent of the net worth in June 2007 under automatic route (200 per cent in case of registered partnership firms). In September 2007, this was further enhanced to 400 per cent of the net worth of the Indian party.
As a simplification of the procedure, share certificates or any other document as an evidence of investment in the foreign entity by an Indian party which has acquired foreign security should not be submitted to the Reserve Bank. The share certificates or any other document as evidence of investment where share certificates are not issued would be required to be submitted to and retained by the designated AD category–I bank, which would be required to monitor the receipt of such documents to ensure bona fides of the documents so received.
The Indian venture capital funds (VCFs), registered with the SEBI, are permitted to invest in equity and equity-linked instruments of off-shore venture capital undertakings, subject to an overall limit of US$ 500 million and compliance with the SEBI regulations issued in this regard.
The Liberalized Remittance Scheme (LRS) for Resident Individuals was further liberalized by enhancing the existing limit of US$ 100,000 per financial year to US$ 200,000 per financial year (April-March) in September 2007.
The limit for portfolio investment by listed Indian companies in the equity of listed foreign companies was raised in September 2007 from 35 per cent to 50 per cent of the net worth of the investing company as on the date of its last audited balance sheet. Furthermore, the requirement of reciprocal 10 per cent shareholding in Indian companies has been dispensed with.
India’s Overseas Investment: Major Liberalisation Measures since 2000 (Concld.)
The aggregate ceiling for overseas investment by mutual funds, registered with SEBI, was enhanced from US$ 4 billion to US$ 5 billion in September 2007. This was further raised to US$ 7 billion in April 2008. The existing facility to allow a limited number of qualified Indian mutual funds to invest cumulatively up to US$ 1 billion in overseas Exchange Traded Funds, as may be permitted by the SEBI, would continue. The investments would be subject to the terms and conditions and operational guidelines as issued by SEBI.
Registered Trusts and Societies engaged in manufacturing/educational sector have been allowed in June 2008 to make investment in the same sector(s) in a Joint Venture or Wholly Owned Subsidiary outside India, with the prior approval of the Reserve Bank.
Registered Trusts and Societies which have set up hospital(s) in India have been allowed in August 2008 to make investment in the same sector(s) in a JV/WOS outside India, with the prior approval of the Reserve Bank. |


