
Performance of Financial and Investment Companies, 2012-13 - আৰবিআই - Reserve Bank of India


Performance of Financial and Investment Companies, 2012-13
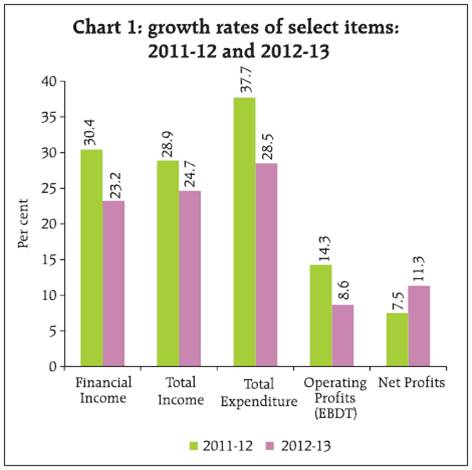
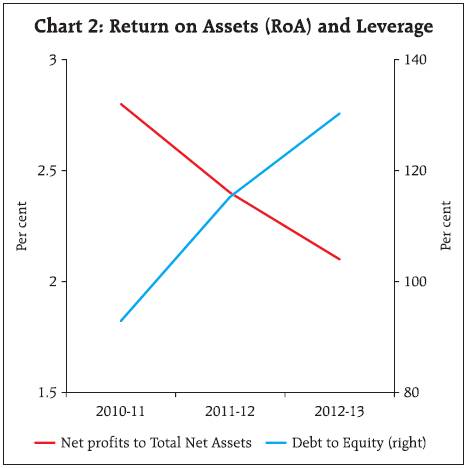
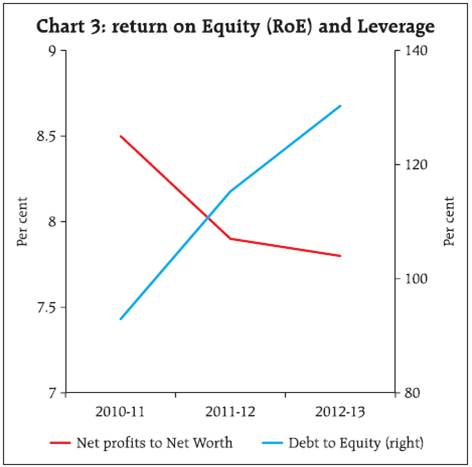
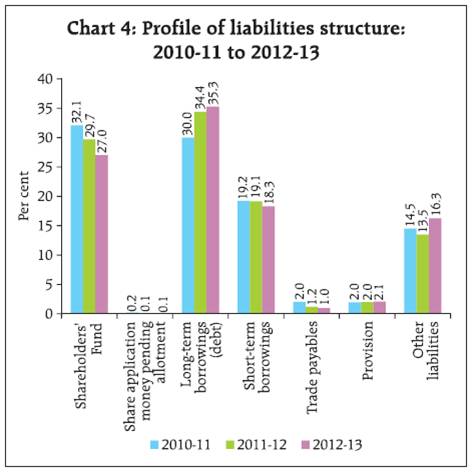
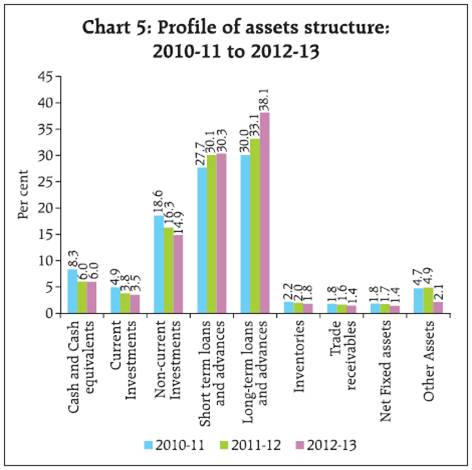
An analysis of financial performance of select 1,005 non-government financial and investment companies for the year 2012-13, based on their audited annual accounts revealed that the growth in income and expenditure decelerated during the year 2012-13 vis-à-vis previous year due to moderate growth in interest income and interest expenses, respectively. The growth in net profit improved in 2012-13, but the growth in operating profits (EBDT) and operating profit margin declined. The share of long-term borrowings, which constitutes major part of total liabilities of financial and investment companies, increased as compared to previous year, with fall in the share of shareholders’ funds. On the assets side, short-term and long-term loans as well as current and non-current investments gained in share. During 2012-13, profitability ratios like return on assets and return on shareholders’ equity declined mainly as a result of further increase in debt-equity ratio. The financial and investment companies continued to rely mainly on external sources for expansion and used it predominantly for growing their long-term loans and investment portfolios. This article presents an analyses of the performance of non-government non-banking financial and investment companies (excluding insurance and chit-fund companies) for the financial year 2012-13 based on the audited annual accounts of 1,005 companies, which closed their accounts during the period April 2012 to March 20131. The performance of these companies during the last three years period i.e., from 2010-11 to 2012-13 based on same set of companies data is also assessed in this article. The segment of financial and investment companies in the private corporate sector is highly skewed. The presence of large sized and influential companies in terms of assets, income, retained profits, etc., which are in large variance with the performance of remaining companies would exert considerable influence on the overall financial performance of the select companies. Therefore, the analysis presented in this article excludes results of ten such influential companies and confined to the sample of 1,005 companies. The detailed data for select 1,005 companies and also 1,015 companies (including ten influential companies) for the year 2012-13 along with explanatory notes have been made available in the website of the Reserve Bank of India. As per provisional estimate of population paid-up capital (PUC) supplied by Ministry of Corporate Affairs, GoI, the select 1,005 companies accounted for 35.4 per cent of paid-up capital of all non-government non-banking financial and investment companies as on March 31, 2013. The financial and investment companies were classified into five groups, viz.(1) Share Trading and Investment Holding,(2) Loan Finance, (3) Asset Finance, (4) Diversified and (5) Miscellaneous. A company was classified in one of the first three principal activity groups if at least half of its annual income during the study year 2012-13 was derived from that principal activity consistent with the income yielding assets. In case no single principal activity was predominant, the company was classified under ‘Diversified’ group. Companies not engaged in any of the above three activities, but conducting financial activities2 were classified under ‘Miscellaneous’ group. ‘Share Trading and Investment Holding’ companies dominated the sample in terms of number of companies followed by ‘Loan Finance’ companies. However, ‘Loan Finance’ companies dominate in terms of financial parameters viz., paid-up capital, financial income and total net assets (Table 1). 1. Growth in Net Profits improved but that in Operating Profits declined 1.1 The growth in income of select financial and investment companies declined to 24.7 per cent in 2012-13 from 28.9 per cent recorded in 2011-12. The growth in expenditure also declined to 28.5 per cent in 2012-13 from 37.7 per cent in 2011-12 (Chart 1). 1.2 The financial income of the select 1,005 financial and investment companies grew by 23.2 per cent in 2012-13 vis-à-vis 30.4 per cent in 2011-12. This moderation in financial income growth was mainly due to moderate growth in interest income together with decline in dividend income during the year. The growth in interest income moderated to 31.2 per cent in 2012-13 from 39.5 per cent in the previous year, whereas, dividend income declined by 1.3 per cent in 2012-13 from a positive growth of 38.5 per cent in 2011-12. Growth in interest expenses also decelerated sharply to 37.4 per cent vis-à-vis 57.6 per cent recorded in the previous year (Statement 1). 1.3 The operating profits (EBDT) of the select financial companies grew at a lower rate of 8.6 per cent in 2012-13 as compared to 14.3 per cent in 2011-12 (Chart 1 and Statement 1). However, net profits grew at an improved rate of 11.3 per cent in 2012-13 vis-à-vis 7.5 per cent in 2011-12. Dividend payment grew at higher rate, and consequently, retained profits grew at lower rate. It was also observed that the investment also grew at a higher rate vis-à-vis previous year. 1.4 Among the activity groups, the growth of both the operating profits and net profits moderated for ‘Loan Finance’ and ‘Assets Finance’ group of companies (Statement 1). The growth in borrowing from banks also decelerated in 2012-13 in all the activity groups, except for ‘Share Trading and Investment Holding’ companies. 2. Profitability ratios declined marginally mainly due to high leverage 2.1 The leverage (measured as a ratio of debt to equity) of the select financial and investment companies had increased gradually from 92.9 per cent in 2010-11 to 115.3 per cent in 2011-12 and further to 130.3 per cent in 2012-13. The increase in leverage ratio during 2012-13 vis-à-vis previous year was observed in all the activity groups of select financial and investment companies, except ‘Asset Finance’ and ‘Miscellaneous’ companies (Statement 2). 2.2 As a result of increased leverage ratio, the profitability of financial and investment companies as measured by return on assets (ratio of net profits to total net assets) and return on equity (ratio of net profit to net worth) declined marginally (Chart 2 and Chart 3). 2.3 The marginal decline in return on assets is observed in all activity groups except ‘Miscellaneous’ companies. However, for ‘Loan Finance’ companies the return on equity had increased vis-à-vis previous year (Statement 2). 2.4 The operating profit margin, measured as a ratio of operating profits to financial income also declined to 25.0 per cent in 2012-13 from 32.4 per cent recorded in 2010-11 due to low growth in operating profits (Chart 1, Statement 1 and Statement 2). 2.5 However, the dividend payout ratio (measured as ratio of dividends paid to net profits) of the select financial and investment companies had increased over the last three years, from 21.4 per cent in 2010-11 to 24.9 per cent in 2011-12 and then to 30.6 per cent in 2012-13. The increase in dividend payout ratio is seen in ‘Share Trading and Investment Holding’ and ‘Loan Finance’ groups of companies only (Statement 2). 3. Share of Interest Income and Income from Hire Purchase Financing in total Income increased 3.1 The fund based income continued to play dominant role in generating income for financial and investment companies as compared to fee-based income. 3.2 The shares of interest income, which is the main source of income generation for financial and investment companies and net earnings from hire purchase financing in total income continued to increase over the last three years. The share of interest income increased from 59.9 per cent in 2010-11 to 64.9 per cent in 2011-12 and then to 68.3 per cent in 2012-13, whereas, net earnings from hire purchase financing increased marginally from 5.3 per cent in 2010-11 to 5.6 per cent in 2011-12 and further to 6.0 per cent in 2012-13. However, the shares of brokerage income and income from share dealings in total income of the select financial and investment companies declined continuously in the last three years (Statement 3). 3.3 On the expenditure side, the share of interest expenses and provision (inclusive of both depreciation provision and other provision) to the total expenditure of the financial and investment companies increased in 2012-13 as compared to previous year. The interest expenses increased to 57.4 per cent in 2012-13 from 53.6 per cent in previous year. While, the share of expenses relating to salary, wages and bonus, bad debt and other expenses in total expenditure declined (Statement 3). 4. Share of Long-term Borrowings in Total Liabilities increased and that of Shareholders’ Funds declined 4.1 The share of long-term borrowings, which constitutes major part of total liabilities of financial and investment companies increased gradually to 35.3 per cent in 2012-13 from 34.4 per cent in 2011-12, whereas, the share of shareholders’ funds fell gradually from 32.1 per cent in 2010-11 to 29.7 per cent in 2011-12 to further 27.0 per cent in 2012-13 (Chart 4). The decline in shareholders’ funds might be due to increased dividends payout. 4.2 The increase in the share of long-term borrowings in total liabilities was observed for ‘Share Trading and Investment Holding’, ‘Loan Finance’ and ‘Diversified’ group of companies, whereas, marginal increase in share of shareholders’ fund to total liabilities was seen only for ‘Asset Finance’ companies (Statement 4). 5. Share of Long-term Loan and Advances in Total Assets continued to increase gradually, while share of investment declined 5.1 The assets pattern of select companies showed that share of both current and non-current investments has gradually declined over the last three years with loans and advances (both short and long-term loans and advances) substituting for it (Chart 5). Share of long term loans and advances increased to 38.1 per cent in 2012-13 from 33.1 per cent previous year. Both long-term and short-term loans and advances together constituted more than two-thirds of total assets in 2012-13. 5.2 Increase in long-term loan financing was seen in all the activity groups except ‘Share Trading and Investment Holding’, whereas, increase in short-term loan financing was observed in the case of ‘Loan Finance’ and ‘Miscellaneous’ groups of companies (Statement 5). 6. External sources continued to dominate in business expansion though its share in total sources of funds declined 6.1 With larger role of long-term borrowings in liabilities structure of financial and investment companies, the external sources (i.e., other than internally generated funds) continued to play major role in expanding business, however, their share in total sources of funds declined to 87.1 per cent in 2012-13 from 88.9 per cent in 2011-12. The decline in the share of external sources in total sources of funds was observed in almost all the activity groups of companies. The share of long-term and short-term borrowings in total sources of funds declined from 51.1 per cent and 18.7 per cent in 2011-12 to 38.6 per cent and 14.9 per cent in 2012-13, respectively (Statement 6). The decline in share of borrowings and increase in net profits might have contributed to the increase in share of internal sources in total sources of funds. 6.2 An increase in internal sources of fund was observed in all the activity groups of companies. In particular, for ‘Share Trading and Investment Holding’ companies, the share of internal sources of funds to total sources of funds increased to 40.4 per cent in 2012-13 from 28.6 per cent in previous year (Statement 6). 7. Long-term Loan financing and Investment pick-up in business activity 7.1 The share of long-term loan and advances in total uses of funds increased from 44.9 per cent in 2011-12 to 58.1 per cent in 2012-13, whereas, the share of short-term loan and advances in total uses of funds declined to 31.1 per cent in 2012-13 from 39.1 per cent in 2011-12. This increase in the share of long-term loans and advances in total uses of funds were observed for ‘Share Trading and Investment holding’, ‘Loan Finance’ and ‘Diversified’ groups of companies. While, the share of short-term loan and advances in total uses of funds declined in all activity groups except ‘Miscellaneous’ companies (Statement 7). 7.2 Further, it was also seen that the share of fresh investments (both current and non-current investments) in total uses of funds increased vis-à-vis previous year for almost all activity groups of companies except ‘Loan Finance’. The share of fresh current investment in total uses of funds was at 2.5 per cent in 2012-13, while there was fall during 2011-12. The share of non-current investment in total uses of funds also increased to 9.1 percent in 2012-13 from 7.3 per cent in 2011-12. For ‘Share Trading and Investment Holding’ group of companies the share of fresh non-current investments increased to 87.8 per cent in 2012-13 from 65.4 per cent in 2011-12 (Statement 7). 8. Profits of NBFC-Deposit taking (NBFC-D) and Housing Finance Companies (HFCs) improved and leverage declined in 2012-13 8.1 Contrary to the trend at aggregate level, growth rate of financial income for NBFC-D and HFCs increased during 2012-13 vis-à-vis previous year (Table 2). For the HFCs, the growth in expenditure decline to 56.6 per cent in 2012-13 from 66.0 per cent in 2011-12. 8.2 Not only the net profits, operating profits also grew at higher rate for both these type of companies in 2012-13 as compared to previous year. However, operating profit margin declined in 2012-13 in line with trend at aggregate level as compared to previous year. 8.3 The leverage for NBFC-D as well as for HFCs declined in 2012-13 after showing an increase in 2011-12 over 2010-11. The leverage ratio for HFCs was at significantly high level for all the three years. 9. Concluding Observations 9.1 It was observed from the aggregate results of the select 1,005 non-government financial and investment companies that their income and expenditure grew at lower rate during the year 2012-13 vis-à-vis previous year. However, the net profits grew at higher rate as compared to previous year, but the operating profits (EBDT) grew at lower rate and operating profit margin declined in 2012-13. Further, profitability ratios like return on assets and return on shareholders’ equity declined mainly due to further increase in debt-equity ratio during 2012-13. 9.2 The share of long-term borrowings, which constitutes major part of total liabilities of financial and investment companies increased as compared to previous year, indicating an increasing role of long term borrowings in liability structure, with declined share of shareholders’ funds. On the assets side, both short-term and long-term loans and advances as well as current and non-current investments gained in share. 9.3 The select financial and investment companies continued to rely mainly on external sources for expansion though its share in total sources of fund declined. Funds were predominantly used for growing their long-term loans and investment portfolios.
* Prepared in the Company Finances Division of the Department of Statistics and Information Management, Reserve Bank of India, Mumbai. The previous study was published in October 2013 issue of the Reserve bank of India Bulletin, which covered 1,342 non-government financial and investment companies during 2011-12. 1 In the case of companies, which either extended or shortened their accounting year, income, expenditure and appropriation figures have been annualised. The balance sheet data, however, have been retained as presented in the annual accounts of companies. The analysis of the financial performance for the year, are subject to this limitation. 2 Companies engaged in financial advisory services, fund management services, portfolio management services, etc., are also included in ‘Miscellaneous’ group. |
||||||||||||||||||||||||||||||||||||||||||||||||||||||||||||||||||||||||||||||||||||||||||||||||||||||||||||||||||||||||||||||||||||||||||||||||||||||||||||||||||||||||||||||||||||||||||||||||||||||||||||||||||||||||||||||||||||||||||||||||||||||||||||||||||||||||||||||||||||||||||||||||||||||||||||||||||||||||||||||||||||||||||||||||||||||||||||||||||||||||||||||||||||||||||||||||||||||||||||||||||||||||||||||||||||||||||||||||||||||||||||||||||||||||||||||||||||||||||||||||||||||||||||||||||||||||||||||||||||||||||||||||||

এই পৃষ্ঠাটো শ্বেয়াৰ কৰক:


ভাৰতীয় ৰিজাৰ্ভ বেংক মোবাইল এপ্পলিকেষ্যন ইনষ্টল কৰক আৰু নৱীনতম বাতৰিৰ প্ৰৱেশাধিকাৰ পাওক!


