 IST,
IST,


State of the Economy
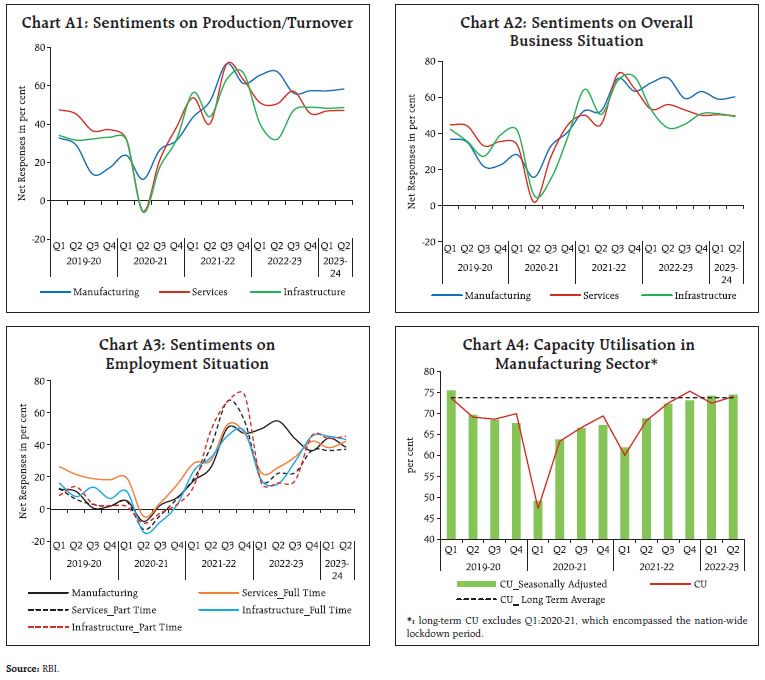
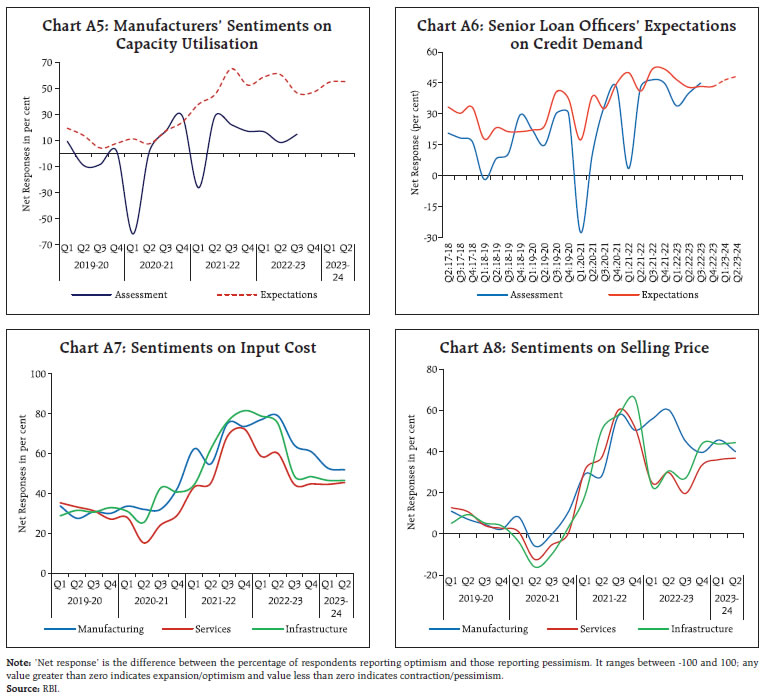
The year 2023 will probably be characterised by a milder global slowdown than earlier anticipated but the trajectory remains unpredictable. In India, domestic consumption and investment stand to benefit from stronger prospects for agricultural and allied activities, strengthening business and consumer confidence, and strong credit growth. Supply responses and cost conditions are poised to improve even though inflation witnessed a rebound in January. The Union Budget 2023-24’s emphasis on capital expenditure is expected to crowd-in private investment, strengthen job creation and demand, and raise India’s potential growth. We live in an age of perfect uncertainty – everything we know is well known to all – the explosive information revolution ensures it. Everything we do not know is anybody’s best guess – as John Kenneth Galbraith wrote nearly three decades ago, “there are two kinds of forecasters: those who don’t know, and those who don’t know they don’t know.”1 Yet, when everyone guesses in the same direction, it usually comes true. A good example is the last week of January 2023 during which the dialling down of monetary policy moves by the so-called systemic central banks2 was perfectly anticipated by triumphal financial markets. By executing a pirouette to lower orders of rate increases, they gave us a glimpse of the global economic outlook as seen through their lens. In the first week of February, more than ten central banks from both advanced but mostly emerging economies slowed or paused, followed by five more central banks in the second week, consolidating the view that the year 2023 will probably be characterised by a milder global slowdown than earlier anticipated. The International Monetary Fund (IMF) in its World Economic Outlook Update released on January 30 also confirmed this somewhat more optimistic view of the future, as set out in the following section. A noteworthy feature of the IMF’s forecast is the strength of emerging and developing economies, with Asia in the lead. China and India will generate half of global growth in 2023. Global inflation may ease grudgingly – from 8.8 per cent in 2022 to 6.6 per cent in 2023, according to the IMF, as re-openings, lower commodity prices and restitution of supply chains boost demand – but may still remain elevated relative to targets at 4.3 per cent in 2024. The risks are slanted to the downside, but a turning point has been passed3, and the central banks know it. Yet none of them are revealing any mood to ease off in spite of financial markets betting against them in a game-theoretic interaction that they will not just pause but also cut rates later this year. Central banks know that inflation is on its way down but they are on guard that the irrational exuberance of markets in bidding up financial prices could in fact re-fuel a resurgence of demand and inflation. Hence, remembering the GOAT’s costly policy error4, central banks would rather err on the side of caution and do more rather than less. If a soft landing is almost assured, rates can always be cut if growth slows more than expected, once low inflation is achieved on a durable basis. As inflation pressures ebb, financial conditions will likely improve, and this will support growth. Financial markets, on the other hand, are driven by a wager that the descent of inflation will be a once-in-a-generation decline, as revealed in market-based gauges of inflation such as break-even rates and swap curves. Equities are steadying and bonds have rallied while inflation optimism has spread to riskier assets. The US dollar has lost ground and is likely to decline further as macroeconomic conditions improve in the rest of the world. Can incoming data continue to beat expectations? The heaviest drag from the tightening of monetary policy through 2022 is yet to grip. A global economy on the cusp of recession remains unpredictable. 2023 would still be a challenging year. Central banks will find it difficult to gauge where to pause and ease. The worst of their fears can come true if indeed global growth slows but inflation remains elevated. Flexibility is called for, including in interpreting the incoming data, especially the labour market – adjusted for still weak labour participation, resignations, the greater incidence of part-time work and the recent large form lay-offs, it may not be as red hot as unemployment rates and earnings data suggest. As more stability in the outlook accrues, it would become important to realistically assess the scars of the repeated shocks of the pandemic and geopolitics on the structural characteristics of inflation. Has the golden mean been shattered, shifting up trend inflation inexorably? Will advanced economies have to accept inflation targets of say 4 per cent while emerging economies have to adopt even higher inflation goals. Graver risks are building up in the international environment for trade, commerce, financial and technology flows. World trade may be fragmented by forceful moves towards protectionism or friend shoring, with each country seeking control over the production of strategic materials and industries through the use of subsidies and other incentives. Over time, other sectors may turn strategic as muscular trade, industrial and technology policies are unleashed. The IMF estimates the costs of these developments between 0.2 per cent of global output in a limited fragmentation scenario to almost 7 per cent in a severe scenario – roughly equivalent to the combined annual output of Germany and Japan. If technological decoupling is added to the mix, some countries could see losses of up to 12 per cent of GDP. The IMF has warned that the global flow of goods and capital is levelling off and a surge in restrictions is making the world a much smaller place. Financial regionalisation and a fragmented global payments system can amplify the losses from trade restrictions. With less international risk-sharing, macroeconomic volatility could get amplified, and more severe crises could impose not just greater pressures on national buffers but also weaken the ability of the global community to support countries in crises, including indebtedness.5 Keeping to the tradition of looking at macroeconomic prospects as revealed in central bank speak, the last meeting of India’s monetary policy committee (MPC) was accompanied by the public release on February 8, 2023 of projections for the Indian economy for 2023-24. In the Delphic part of its forward guidance6, the MPC pointed to stronger prospects for agricultural and allied activities, the rebound in contact-intensive sectors and discretionary spending, strengthening business and consumer confidence, strong credit growth, resilient financial markets, and the government’s continued thrust on capital spending and infrastructure as factors creating a congenial environment for domestic consumption and investment. In its view, these factors would offset the adverse implications for exports due to the global slowdown. Accordingly, real GDP growth for 2023-24 was projected at 6.4 per cent. On the outlook for inflation, the MPC cited improving crop prospects while recognising risks from adverse weather events, the uncertainties surrounding the global commodity price outlook, and the ongoing pass-through of input costs to output prices, especially in services, to project CPI inflation at 5.3 per cent for 2023-24, down from 6.5 per cent in 2022-23. In the opinion of the MPC, inflation remains a major risk to the outlook in which domestic economic activity is expected to remain resilient. Accordingly, it judged that it is imperative to remain alert on inflation so as to ensure that it remains within the tolerance band and progressively aligns with the target. Hence, “further calibrated monetary policy action is warranted to keep inflation expectations anchored, break core inflation persistence and thereby strengthen medium-term growth prospects.”7 In this meeting, the MPC decided to increase the policy repo rate by 25 basis points to 6.50 per cent and retained the stance of withdrawal of accommodation. The MPC’s decision needs to be seen in the context of the journey that began in the second half of 2021-22 with the cessation of pandemic-induced liquidity injections, winding down of pandemic facilities, modulation of liquidity through variable rate reverse repo auctions and increases in the cash reserve ratio, all of which prepared the ground for the restoration of normal liquidity management operations and market timings. Policy rate increases were initially front-loaded but large hikes of 75 basis points that characterised the actions of systemic central banks were eschewed to avoid destabilising domestic economic activity. Inflation peaked in June 2022 and grudgingly eased thereafter. From December 2022, conditions became congenial for calibrating lower orders of rate increases and by February 2023, the policy rate regained positive territory when adjusted for four quarters ahead inflation. Importantly, there have been no backslides or reversals and the size of the rate change has been the best form of forward guidance. The MPC has been astute in communicating its resolve to bring inflation down to the target. To quote from Governor Shri Shaktikanta Das’s monetary policy statement of February 8, 2023, “We need to see a decisive moderation in inflation. We have to remain unwavering in our commitment to bring down inflation. Thus, monetary policy has to be tailored to ensuring a durable disinflation process…. The reduction in the size of the rate hike provides the opportunity to evaluate the effects of the actions taken so far on the inflation outlook and on the economy at large. It also provides elbow room to weigh all incoming data and forecasts to determine appropriate actions and policy stance, going forward. Monetary policy will continue to be agile and alert to the moving parts in the inflation trajectory to effectively address the challenges to the economy.” The impact of monetary policy actions is being reflected in the channels of transmission, but the road ahead is daunting. Over the year ahead, the retreat of inflation is expected to be stubborn and beset by supply shocks. Almost every other component of the consumer price index – statistical and exclusion-based measures – is showing a hardening of price pressures. Households’ inflation expectations have flat-lined and manufacturing corporations are facing moderation in growth of sales and revenues. With pressures building on profits, capital expenditure remains restrained. Hence, the stance of monetary policy will need to remain disinflationary for consumer spending and business investment to pick up on a durable basis and provide a solid foundation for an acceleration of growth. Medium-term policies for expanding India’s productive potential are emphasising domestic manufacturing and trade policies that incentivise domestic production and reshoring of value chains, or what has been termed as ‘productivism’8. Revival of activity is already evident across the hinterland night lights luminescence. With digital public goods infrastructure taking centre-stage in India’s G20 presidency, the country is ready to take leadership in digital innovations and realise India’s techade. Greening of the economy is gathering pace, with the issue of the maiden offering of sovereign green bonds, with plans for a green hydrogen ecosystem, electric vehicles and semi-conductor production, and surging renewables. A more confident India is aiming high with a 2047 vision. In the concluding section, we underscore how the Union Budget 2023-24 makes a sure-footed stride to actualise this vision. Set against this backdrop, the remainder of the article is structured into four sections. Section II sketches the rapidly evolving developments in the global economy. The evolution of the domestic economy is laid out in Section III. Section IV evaluates the domestic financial conditions, while the last Section sets out concluding remarks. The outlook for the global economy turned less gloomy as moderating inflation assuaged fears of further aggressive monetary tightening. Combined with reopening of some parts of the world from pandemic restrictions, the prospects for a milder slowdown than earlier anticipated have improved. Considerable uncertainty continues to prevail, however, as incoming data are parsed. In its January 2023 update of the World Economic Outlook (WEO), the IMF revised global growth for 2023 upwards by 20 basis points (bps) to 2.9 per cent vis-a-vis its October projection. The revision takes into account positive surprises such as a stronger boost from pent-up demand, faster fall in inflation and the likely easing of financial conditions. Notably, a global recession is no longer the baseline assessment. For advanced economies (AEs), growth for 2023 was revised upward by 10 basis points to 1.2 per cent while for emerging market economies (EMEs), it is estimated to be 30 basis points higher at 4.0 per cent in 2023 (as compared with WEO October 2022 projections) [Table 1]. 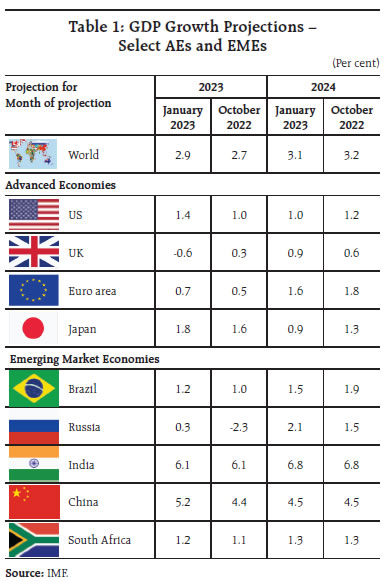 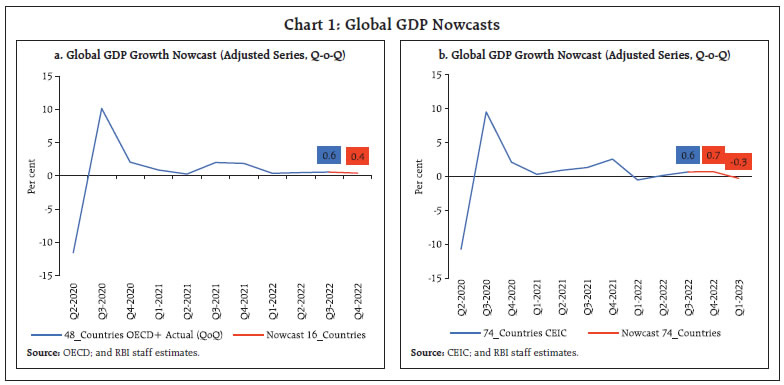 Against this backdrop, our model based nowcast, incorporating data for 74 countries, projects a decline in global growth momentum to -0.3 per cent in Q1: 2023 (Chart: 1a & 1b). Among high frequency indicators, the global composite purchasing managers’ index (PMI) at 49.8 in January 2023 posted an uptick, but remained in contractionary zone for the sixth successive month (Chart 2). The global manufacturing purchasing managers’ index at 49.1 in January remained below the neutral mark for the fifth consecutive month, although the contraction showed signs of easing in both output and new orders, with employment posting a slight increase. The services PMI rebounded to expansionary mode after six months. World trade volume contracted in November 2022 by 1.5 per cent (y-o-y) due to steep negative momentum and an unfavourable base effect (Chart 3a). The Baltic Dry Index - a measure of shipping charges for dry bulk commodities - fell precipitously, shedding over 50 per cent of its value in January 2023 as capesize demand remained numb along with weak demand across all vessel segments (Chart 3b). The IMF expects global trade in goods and services to decelerate to 2.4 per cent in 2023 from 5.4 per cent in 2022. 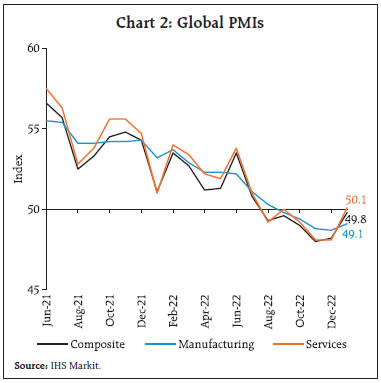 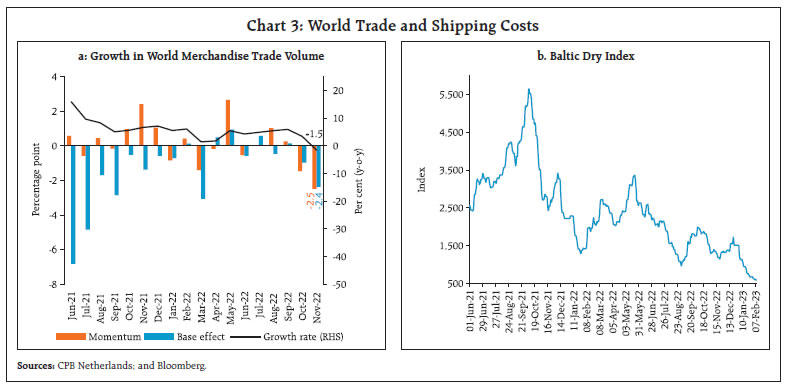 Global commodity prices exhibited volatility as the still weak global economic outlook continues to weigh on demand (Chart 4a). Crude oil prices traded at an average of US$ 83 per barrel in January and February (up to February 15, 2023) following the uncertainty lingering around evolving geopolitical concerns, supply shortages and shutdown of a major export terminal after the earthquake in Turkey (Chart 4b). The Food and Agricultural Organization (FAO) food price index9 declined for the tenth consecutive month in January, driven down by vegetable oils, dairy and sugar, while prices of cereals and meat remained largely stable (Chart 4c). 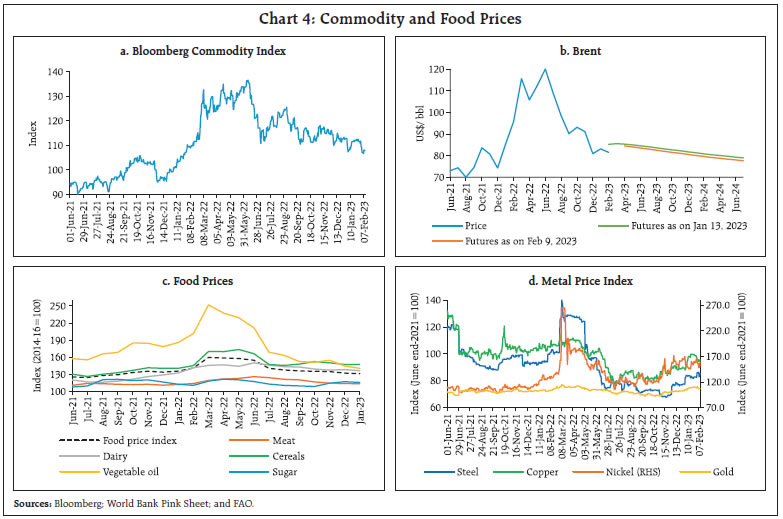 Metal prices increased on reopening plans and expectations of higher demand as pandemic restrictions were eased and on higher growth in global electronics industry. Gold prices inched up in January on safe haven demand (Chart 4d). Demand for gold has been increasing from all the major stakeholders, with central banks’ purchases of gold reaching the highest levels since 1967 in Q4:2022 (Chart 5a & 5b). Headline inflation eased across most AEs and EMEs. Although global headline inflation seems to have peaked in Q3:2022, the IMF warned that core inflation stays well above pre-pandemic levels in most economies. In the US, headline CPI inflation moderated marginally to 6.4 per cent in January 2023 from 6.5 per cent a month ago. Inflation based on Personal Consumption Expenditure (PCE) index eased markedly to 5.0 per cent in December 2022 (Chart 6a). In January, inflation slowed in the Euro area and in the UK to 8.5 per cent and 10.1 per cent, respectively. In Japan, CPI (all items less fresh food) inflation soared to a 41-year high of 4.0 per cent in December 2022. Among the EMEs, inflation eased further in Brazil (5.8 per cent), Russia (11.9 per cent), and South Africa (7.2 per cent) in December 2022 (Chart 6b). China, however, registered a 20 basis points increase in CPI inflation to 1.8 per cent in December. Global equity markets commenced 2023 with renewed optimism as incoming data suggested moderation in inflation and less aggressive rate hikes expectations, with EMEs faring better than AEs (Chart 7a). Markets, however, corrected in early February, especially in EMEs, as investors turned risk averse reflecting the expectation of higher interest rates in AEs especially after the release of robust nonfarm payroll and low unemployment rate data in the US. 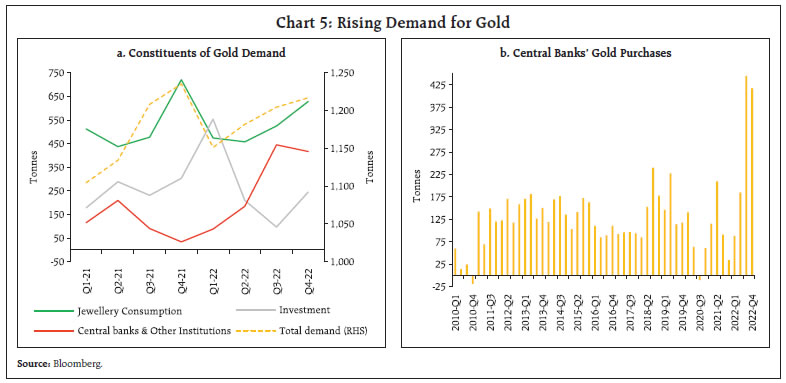 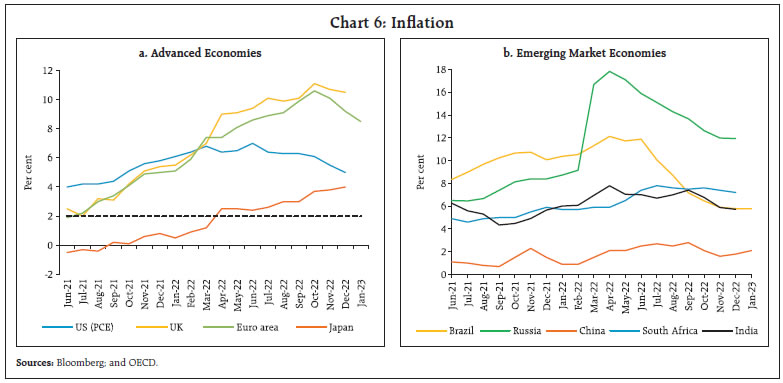 During January 2023, the 10-year G-sec yields softened across major AEs on lower-than-expected inflation prints in most countries, including the US, resulting in the 10-year US treasury yield shedding 37 basis points and the 2-year G-sec yield decreasing by 22 bps. This increased the magnitude of yield curve inversion (Chart 7b). In February, however, US bond yields hardened on the higher than anticipated US non-farm payroll data with the 2-year G-sec yield gaining over 20 bps (up to February 08, 2023). The US dollar reversed its rally after peaking in September 2022 and lost 1.4 per cent in January on expectations of less aggressive policy rate hikes. Concomitantly, the MSCI currency index for EMEs gained momentum, rising 2.6 per cent on the back of capital inflows (Chart 7c & 7d). 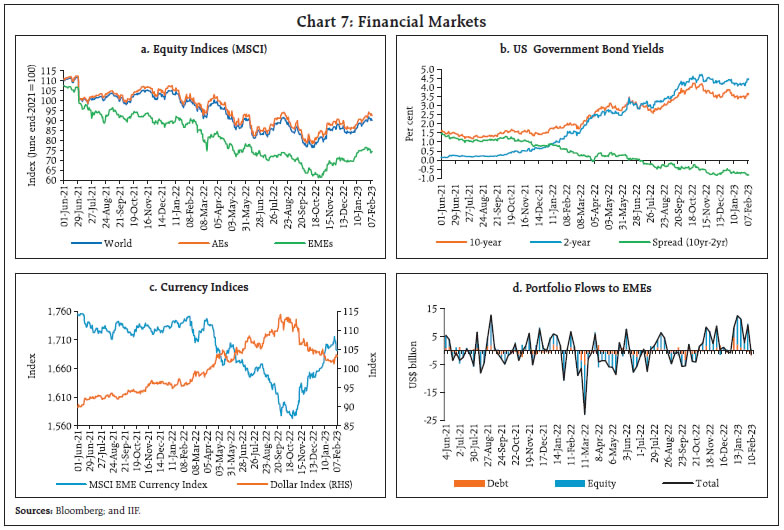 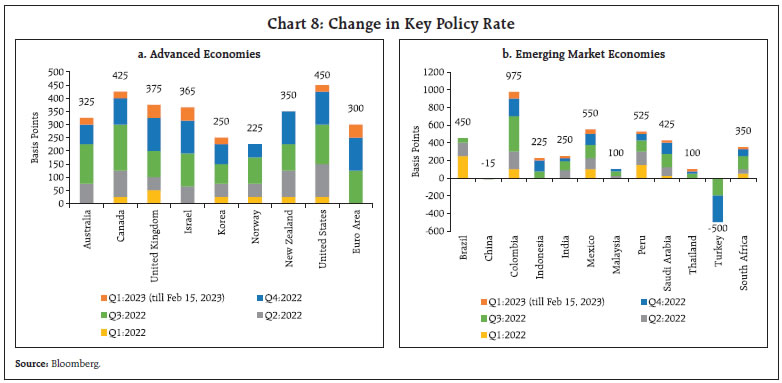 Central banks of most AEs and EMEs slowed the pace of tightening in recent months (Chart 8a). The US Federal Reserve raised the target range of the Federal Funds rate by 25 bps to 4.50-4.75 per cent, reducing the magnitude of its rate hike for the second time in a row. The European Central Bank (ECB) and the Bank of England (BoE) decided to raise their key rates by 50 bps each in February 2023. Canada slowed its pace of tightening as it hiked its policy rate by 25 bps in January and Australia continued hiking its rate by 25 bps in its February meeting. Japan has continued to diverge by maintaining an accommodative stance; however, it expanded its range for 10-year government bonds yield fluctuations. Most EME central banks have also continued with policy tightening while a few others have paused (Chart 8b). In December, South Africa moderated the pace of hike in its policy rate to 25 bps from 75 bps and Saudi Arabia slowed to 25 bps from 50 bps in its January meeting. Indonesia and Thailand raised their policy rates by 25 bps each in January. Brazil in February and Malaysia, Chile and Hungary in January held their key rates unchanged. China, on the contrary, continued with monetary accommodation. Supply responses and overall cost conditions in the Indian economy are poised to improve. Supply chain pressures continued to ease as indicated by our index of supply chain pressure for India (ISPI) [Chart 9]. 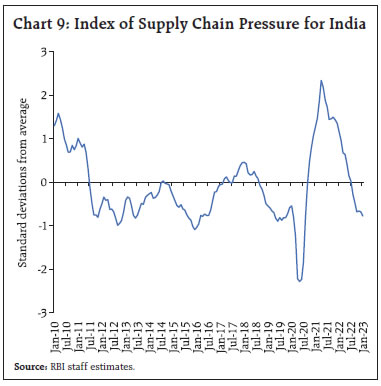 In consonance, the economic activity index (EAI) showed an uptick in activity in November and December 2022 (Chart 10a). Accordingly, our nowcast of GDP for Q3:2022-23 is placed at 4.4 per cent (Chart 10b). Aggregate Demand Lead indicators point towards sustained momentum in economic activity. E-way bill volumes and toll collections continued to increase, albeit at a moderate pace (Chart 11). Fuel consumption came off the nine-month high recorded in December due to seasonal factors. Sales of automobiles (passenger and commercial vehicles), sales of two wheelers, and vehicle registrations (transport and non-transport vehicles) picked up, buoyed by higher demand. Better crop prices have aided the pick-up in tractor sales. Sales of motorcycle and three-wheelers also picked up, with the latter more than doubling over January 2022 (Chart 12). In the tourism sector, average room rates continued to increase even as hotel occupancy rates remained flat. Revenue per available room (RevPAR), increased after recording a dip in November (Chart 13). 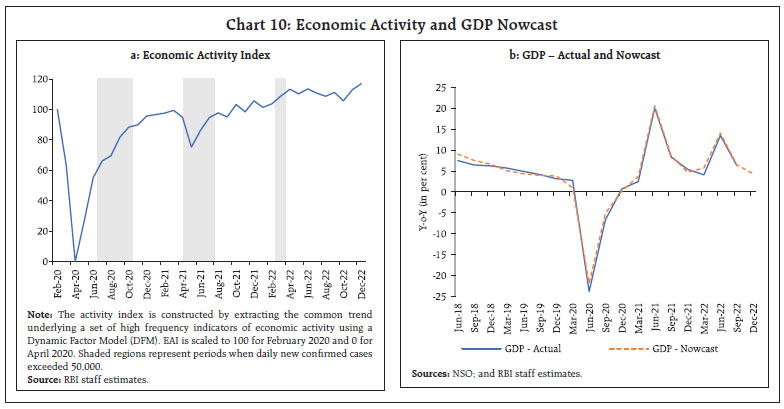 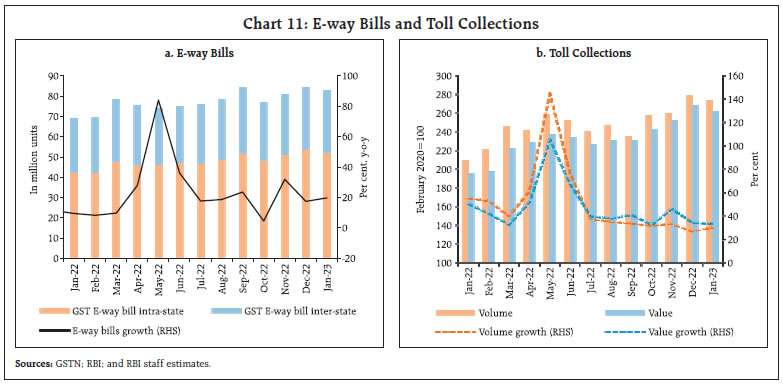 Households’ assessment and outlook for economic conditions reported in the Reserve Bank’s Consumer Confidence Survey (CCS) point towards rising confidence reflected in the current situation index (CSI) as well as the future expectations index (FEI) over a one-year horizon (Chart 14). 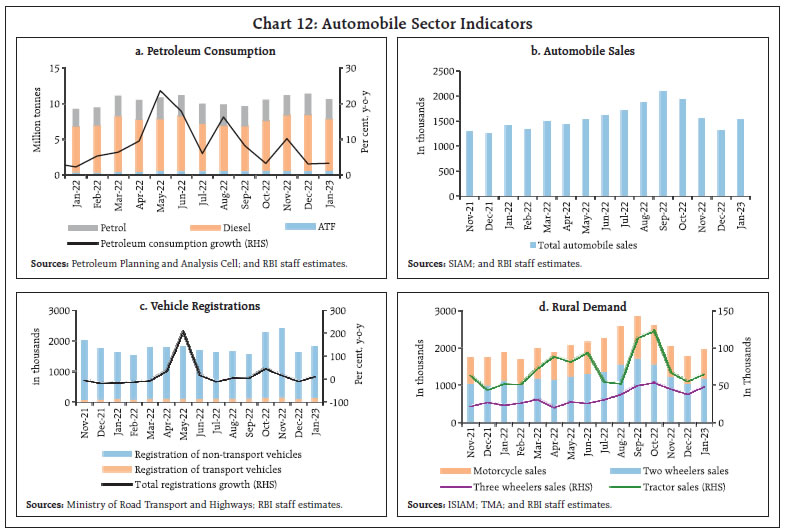 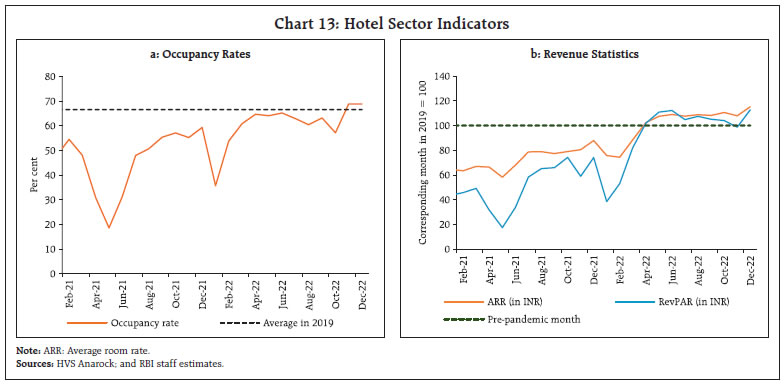 Led by a relatively larger fall in urban unemployment, the all-India unemployment rate eased to 7.1 per cent in January 2023 from 8.3 per cent in December 2022 (Chart 15a). The labour force participation rate (LFPR), however, moderated to 39.8 per cent in January from 40.5 per cent in the previous month, with the employment rate (ER) stayed largely flat (Chart 15b). 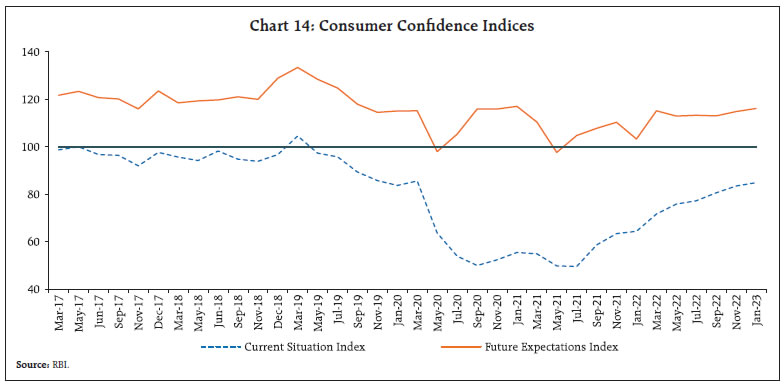 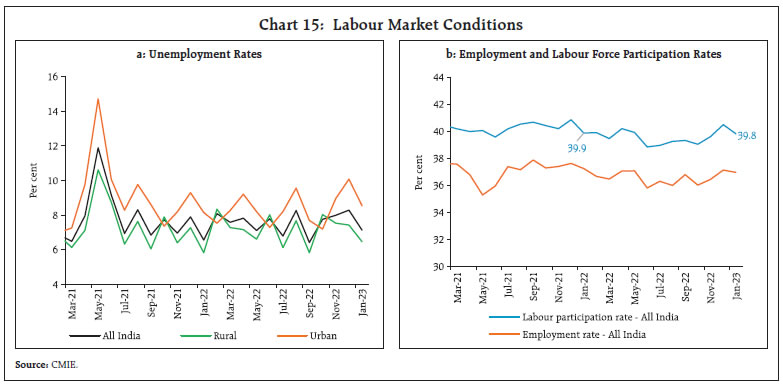 PMI Employment Index remained broadly unchanged in January 2023 (Chart 16). Demand for work under the Mahatma Gandhi National Rural Employment Guarantee Scheme (MGNREGS) declined on a y-o-y basis reflecting pick-up in labour demand in other activities especially Rabi sowing (Chart 17). India’s merchandise exports at US$ 32.9 billion in January 2023, recorded a contraction of 6.6 per cent y-o-y and 13.5 per cent on a sequential basis (Chart 18). During April-January 2022-23, cumulative merchandise exports grew by 8.5 per cent to reach US$ 369.3 billion. 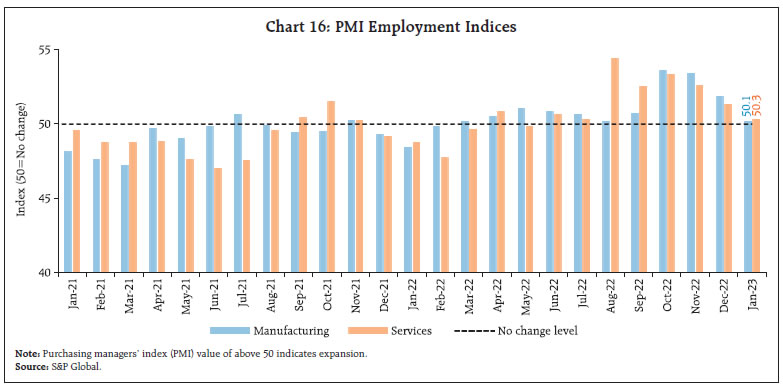 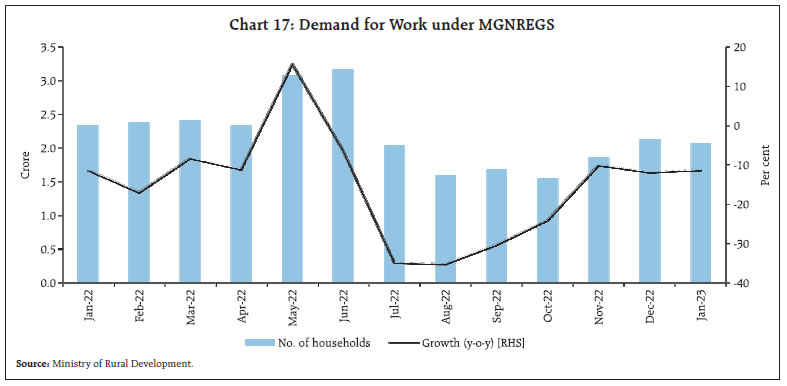 Non-oil exports contracted by 8.7 per cent on y-o-y basis in January 2023, with engineering goods, gems and jewellery, and cotton yarn and fabrics accentuating the decline (Chart 19). On the other hand, petroleum products, electronic goods and rice contributed positively to overall exports. India’s services exports at US$ 31.3 billion expanded robustly at 20.4 per cent in December 2022 (US$ 26.0 billion in December 2021) on the back of earnings from software and travel services. Merchandise imports at US$ 50.7 billion contracted by 3.6 per cent (y-o-y) in January 2023, partly reflecting the fall in prices of crude oil, certain fertilisers and vegetable oils. On a sequential basis, the decline in imports was even sharper at 15.8 per cent (Chart 20). Gold, electronic goods and pearls and precious stones were the main items that dragged the imports down while petroleum, oil and lubricants (POL), iron and steel and project goods were the commodities that contributed positively (Chart 21). 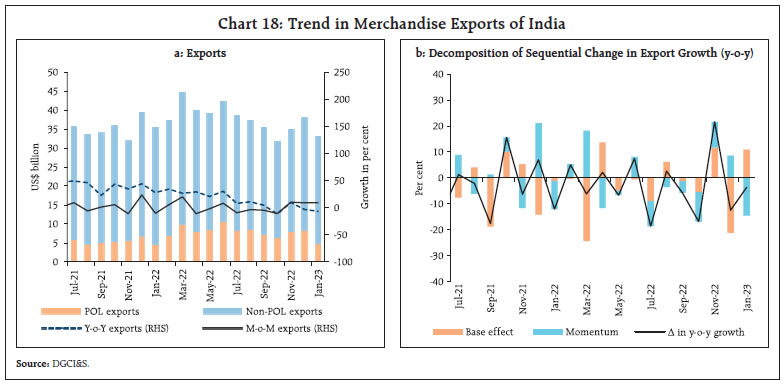 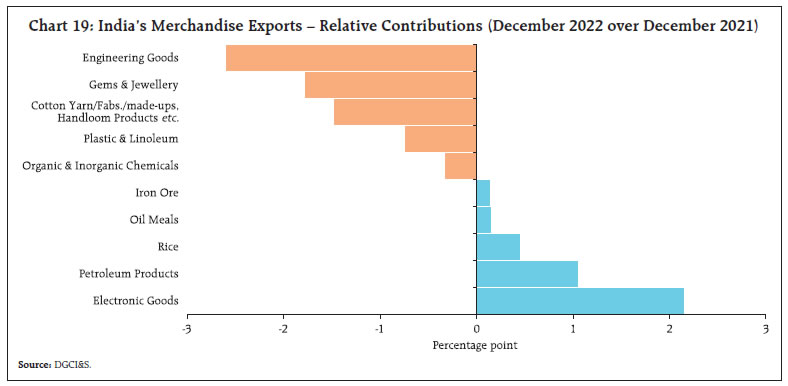 With international gold prices reaching a 9-month high in January 2023, India’s gold imports fell to a 20-month low of US$ 697 million declining by 70.8 per cent (y-o-y). After remaining in expansionary zone for 25 consecutive months, non-oil non-gold (NONG) imports contracted by 6.7 per cent in January 2023. 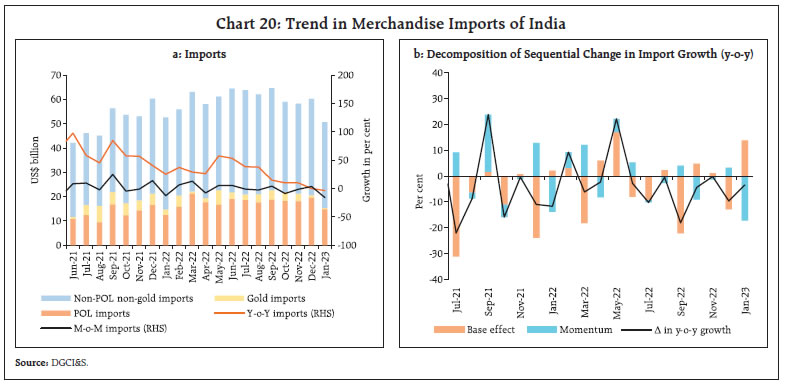 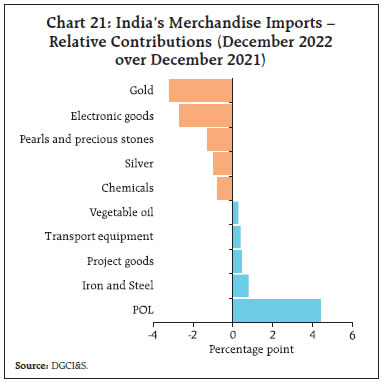 Edible oils – for which India is heavily dependent on import10 – recorded 28 per cent y-o-y growth in volume to reach 15.6 lakh metric tonnes (MT) in December 2022.11 While palm oil constituted 71 per cent of edible oil imports, sunflower and soybean oil constituted the rest (Chart 22). International palm oil prices, however, jumped sharply in the second week of February after Indonesia, the world’s largest exporter, indicated that some export permits will be suspended.12 During November-December 2022, Indonesia was India’s major supplier of refined bleached deodorised (RBD) palmolein and crude palm oil.13 On a positive note, mustard seed production is likely to hit a record in the 2022-23 crop year due to highest-ever sowing coverage of 9.8 million hectare and conducive weather conditions in key growing regions. As mustard oil has the largest share in domestic edible oil production, a bumper output of the crop could help reduce imports of other edible oils.14 Also, the Government’s ‘National Mission on Edible Oils – Oil Palm’, introduced in 2021, is aimed at reducing import dependence on palm oil by increasing domestic crude palm oil production to 11.20 lakh MT by 2025-26 from 0.27 lakh MT in 2019-20. Due to a sharper decline in imports viz-a-viz exports, the merchandise trade deficit fell to a 12-month low of US$ 17.7 billion in January 2023. 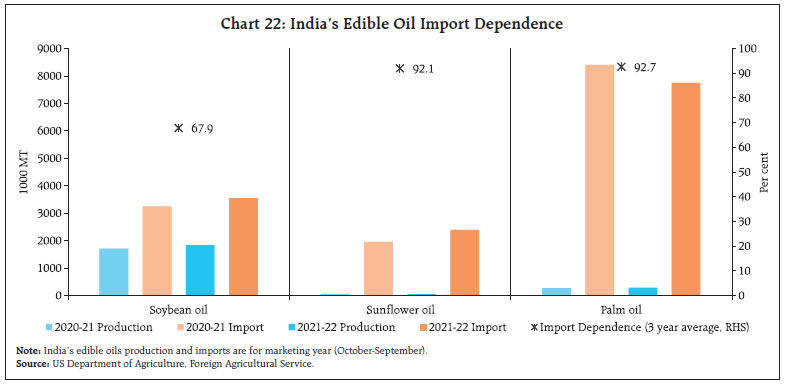 Service imports at US$ 15.8 billion moderated on account of high base and a decline in transport services. Accordingly, net services earnings are estimated at US$ 15.5 billion for December 2022 (Chart 23). The gross fiscal deficit (GFD) of the central government at 56.6 per cent of revised estimates (RE) during April-December 2022 was higher than in the corresponding period last year (47.7 per cent) due to a pickup in expenditure. Capital outlay grew by 17.6 per cent (y-o-y) while revenue expenditure recorded a modest growth of 9.3 per cent, leading to a marked improvement in the quality of spending (Chart 24). Gross tax revenue grew by 12.5 per cent during April-December, with collections improving across the board except for excise duty (due to the cut in excise duty on petrol and diesel in May 2022). Direct and indirect taxes increased by 17.6 per cent and 7.2 per cent (y-oy), respectively (Chart 25). Non-tax revenues, however, contracted by 17.4 per cent. Non-debt capital receipts increased by 93.6 per cent (y-o-y), led by the successful initial public offer (IPO) of Life Insurance Corporation (LIC). 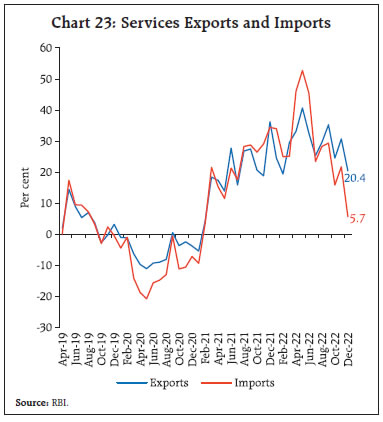 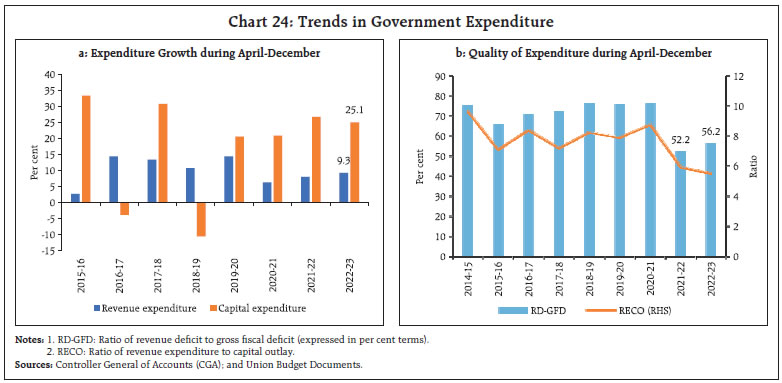 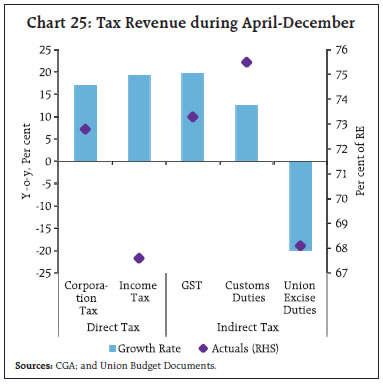 The GST collections (Centre plus States) grew by 10.6 per cent (y-o-y) in January 2023 to ₹1.55 lakh crore, highest since April 2022 (Chart 26). The finances of the States have continued to improve, as reflected by the decline in budgetary deficits during April-November 2022 (Chart 27).15 Growth in revenue receipts remained robust, driven by the high growth in SGST collections and tax devolution from the Centre. The pace in the revenue expenditure has also been maintained. Capital expenditure picked up with a growth of 9.3 per cent (y-o-y) in the concerned period (Chart 28). This momentum in capex is expected to sustain in Q4:2022-23 with growth in tax devolution and increased offtake under the Special Assistance to States for Capital Investment 2022-23. The Union Budget 2023-24 laid emphasis on infrastructure development focusing on capital expenditure which is expected to crowd-in private investment and strengthen job creation and demand. The government adhered to the budgeted fiscal target of 6.4 per cent of GDP in 2022-23 (as per revised estimate, RE). In absolute terms, however, the GFD surpassed budget estimates (BE) by ₹94,123 crore as the increase in revenue expenditure outweighed the increase in receipts. In 2023-24 (BE), the GFD is budgeted at 5.9 per cent of GDP, in line with the medium-term target of bringing GFD below 4.5 per cent by 2025-26. 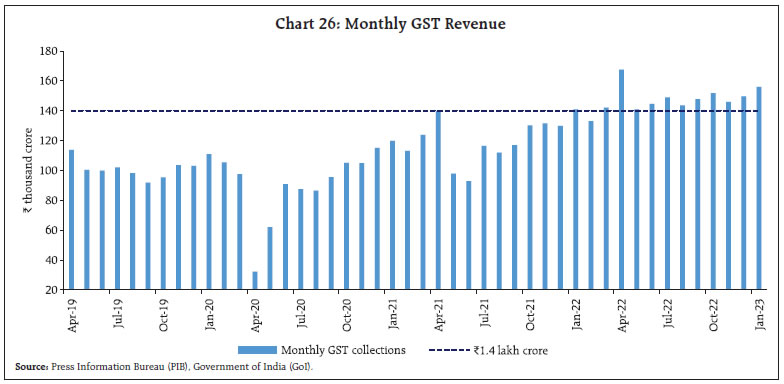 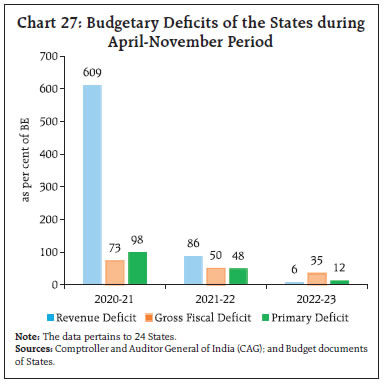 In 2023-24, capital expenditure is budgeted at ₹10 lakh crore which constitute 3.3 per cent of GDP. Effective capital expenditure, which includes capital expenditure of the Centre plus grants-in-aid to States for creation of capital assets, is budgeted at 4.5 per cent of GDP in 2023-24 (BE). By contrast, revenue expenditure is projected to grow by 1.2 per cent. Gross market borrowing through dated securities for 2023-24 is budgeted to increase by 8.6 per cent to ₹15.4 lakh crore while the net market borrowings at ₹11.8 lakh crore is budgeted to increase by 6.6 per cent during 2023-24. The Union Budget 2023-24 fixed the States’ gross fiscal deficit (GFD) limit at 3.5 per cent of gross state domestic product (GSDP), of which 0.5 will be tied to power sector reforms. The Centre has also decided to continue providing interest-free 50-year loans to the States with the enhanced allocation of ₹1.3 trillion during 2023-24 to augment their capital expenditure. Aggregate Supply As per the second Advance Estimates (AE) of the agriculture crop production, total foodgrains production in India is projected to reach 323.6 million tonnes in 2022-23, representing a 2.5 per cent increase over the final estimates for 2021-22. The growth of rabi crops at 6.2 per cent has more than offset the decline of 1.2 per cent in kharif foodgrains production, resulting in a record production. Fresh production records are estimated for wheat (a rabi staple), maize, and pulses in the food crop category, as well as oilseeds and sugarcane among commercial crops. Cotton production has recorded the highest growth rate according to the AEs (Chart 29). 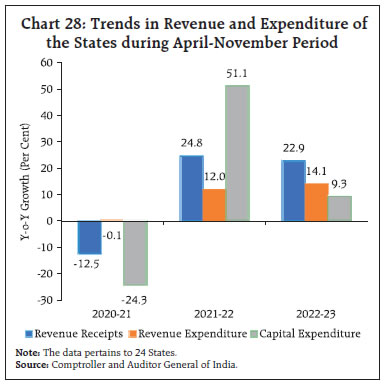 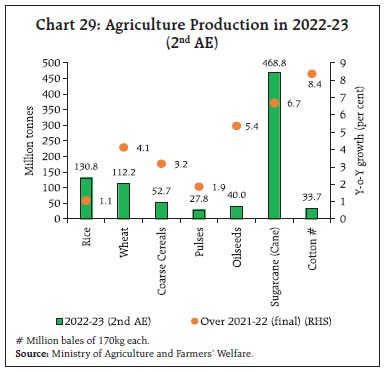 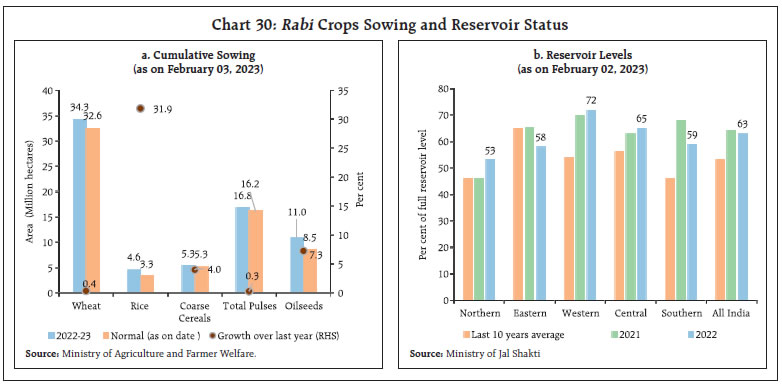 The Rabi crop sowing season ended with a record acreage of 72.1 million hectares, with substantial increase under all the crops (Chart 30a). Reservoir levels remained comfortable (Chart 30b). As on February 09, 2023 the cumulative rice procurement (including unmilled paddy) was marginally lower than a year ago, but mandi arrivals of paddy in the ongoing Kharif marketing season have been higher by 36.9 per cent y-o-y (as on February 09, 2023). As on February 01, 2023 public stocks of rice and wheat remained comfortable at 6.2 and 1.1 times of the buffer norms, respectively. On January 25, 2023 the Government announced the open market sale of 3 million tonnes of wheat through various channels from the central pool. Firstly, as on February 16, 2023. It has already sold 1.3 million metric tonnes of wheat through two e-auctions. Secondly, the Government has also allocated 3 lakh metric tonnes of wheat at a concessional rate to the PSUs/ cooperatives/ Federations, Kendriya Bhandar and NCCF/NAFED. The Union Budget 2023-24 focused on wide-ranging reforms and policies in the agriculture and rural sectors including: (i) an increase in the production and consumption of millets; (ii) diversification and promotion of allied sectors; (iii) boosting logistics infrastructure for last-mile connectivity; (iv) thrust on agricultural exports; (v) cooperative-based development and growth; and (vi) strengthening agricultural extension through digital public infrastructure. The Government also intends to nurture an agri-tech start-up ecosystem through the Agriculture Accelerator Fund to promote innovation and entrepreneurship. The headline PMI for manufacturing and services at 55.4 and 57.2, respectively, remained in expansionary zone in January 2023 despite a sequential blip (Chart 31a and 31b). The outlook for manufacturing and services remains buoyant, and above the historical average. A cross-country comparison shows that India had the highest PMI readings among major economies (Chart 31c). Capacity utilisation in the manufacturing sector surpassed its long-term average in Q2:2022-23. Manufacturers expect further improvements in subsequent quarters. Firms in manufacturing, infrastructure and services sectors exude high optimism on demand conditions up to H1:2023-24, as reflected in the Reserve Bank’s outlook surveys (Annex 1). 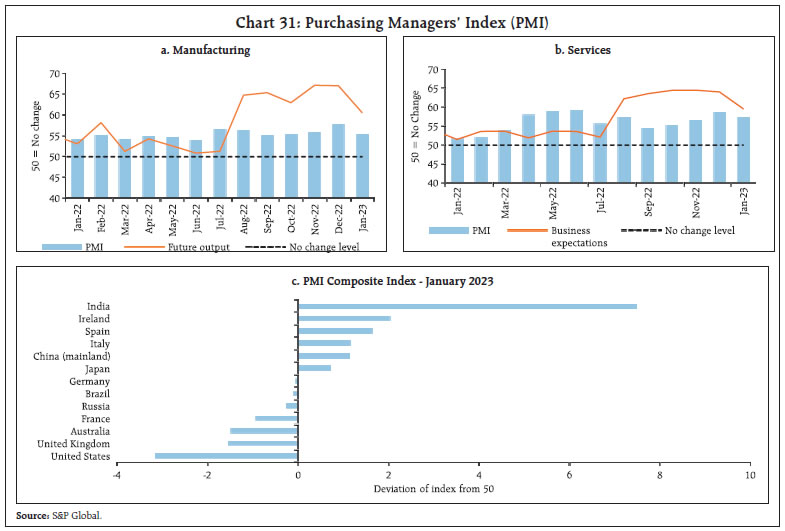 In the services sector, transport indicators recorded expansion, with railway freight earnings growing on both month-on-month (m-o-m) and y-o-y basis in January 2023 enabled by the Indian Railways’ Hunger for Cargo initiative (Chart 32a). Cargo traffic at major ports gathered momentum in January due to an upturn in cargo of coking coal and containerised cargo (Chart 32b). In the construction sector, steel consumption recorded y-o-y growth of 2.7 per cent in January 2023 as compared to 0.5 per cent a year ago. Growth in cement production decelerated over a high base (Chart 33). High frequency indicators in the service sector point towards positive momentum continuing generally, except for international passenger movement and air cargo traffic (Table 2). In terms of key policy initiatives at the State level, Tamil Nadu launched the Tamil Nadu Emerging Sector Seed Fund (TNESSF) aimed at providing investments for start-ups in emerging/sunrise sectors. West Bengal introduced a scheme offering various fiscal incentives to the textile sector. Odisha floated a global tender to disinvest 49 per cent of its stake in the Odisha Power Generation Corporation (OPGC). The Uttar Pradesh Government has approved a new scheme to facilitate development of private industrial parks in the State. 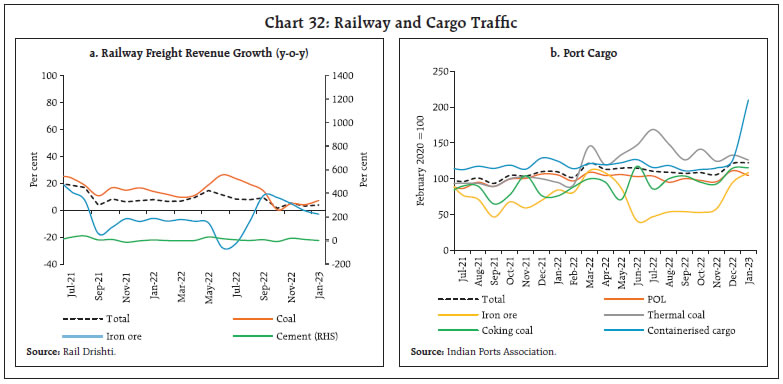 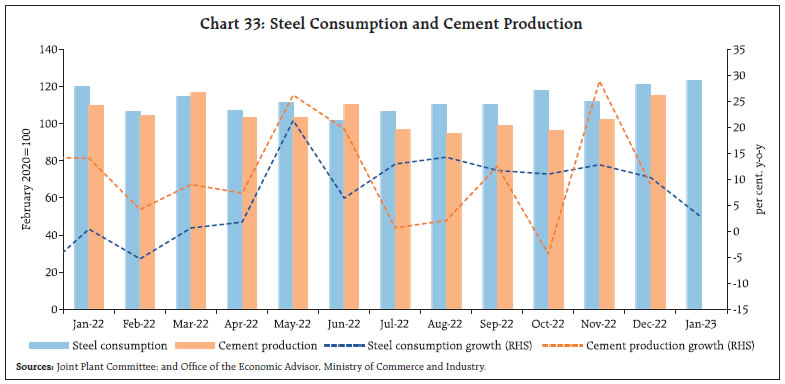 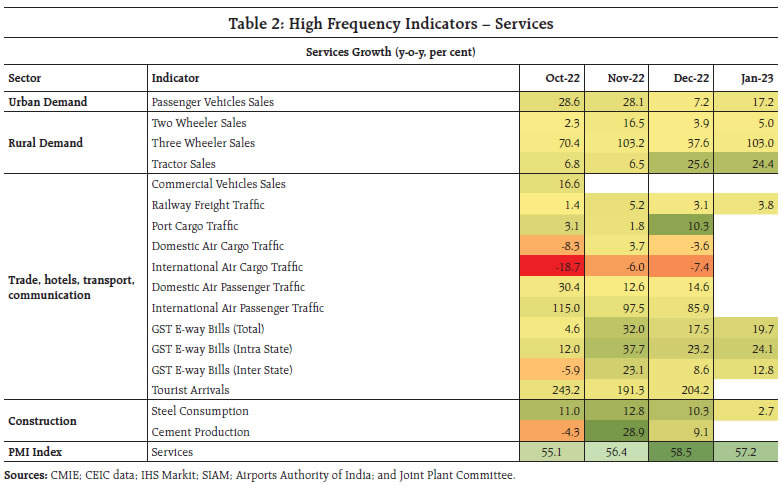 Inflation As per the provisional data released by the National Statistical Office (NSO) inflation – as measured by y-o-y changes in the all-India consumer price index (CPI) – increased sharply to 6.5 per cent in January 2023 from 5.7 per cent in December 2022 (Chart 34a). The index increased by 46 bps m-o-m, which along with an unfavourable base effect (m-o-m change in prices a year ago) of 30 bps, resulted in a rise in headline inflation by around 80 bps between December and January. 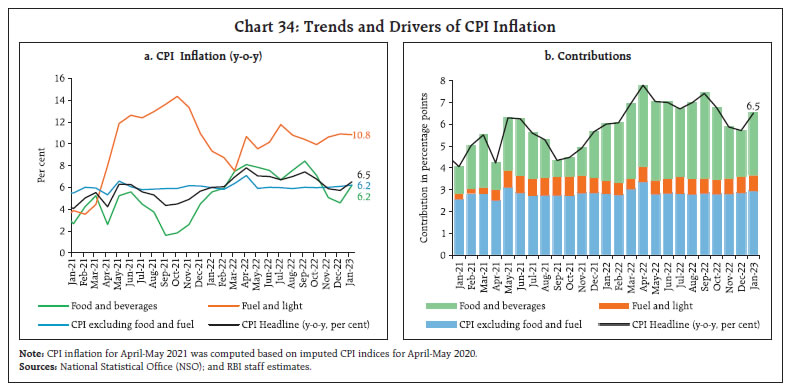 Price pressures mainly emanated from m-o-m increases in the food and beverages group (45 bps) and in the ‘core’ (CPI excluding food and fuel) group (52 bps). The index for fuel group, however, remained unchanged during the month. CPI food inflation rose sharply to 6.2 per cent in January from 4.6 per cent a month ago (Chart 34b). Within the food group, inflation rose significantly in cereals to 16.1 per cent - the highest since June 2013 - and in spices, to 21.1 per cent - the highest in the current CPI series (Chart 35). Other sub-groups such as fruits, edible oils, sugar, protein-based food (pulses, eggs, meat, fish and milk), and non-alcoholic beverages posted increases in inflation during the month. Vegetables registered lower deflation in January 2023 vis-à-vis December 2022 (Chart 36). Inflation in the fuel and light group softened marginally to 10.8 per cent in January from 10.9 per cent in December. While inflation in kerosene-PDS and electricity registered some moderation, liquefied petroleum gas (LPG) posted a higher order of price increase than a month ago. The fuel group with a weight of 6.8 per cent in the CPI basket contributed 11.3 per cent of headline inflation in January. CPI core inflation increased to 6.2 per cent in January from 6.1 per cent in December driven by pick-up in inflation under sub-groups such as pan, tobacco and intoxicants, housing, health, and personal care and effects. On the other hand, clothing and footwear, household goods and services, transport and communication and education sub-groups witnessed a softening of inflation in January. 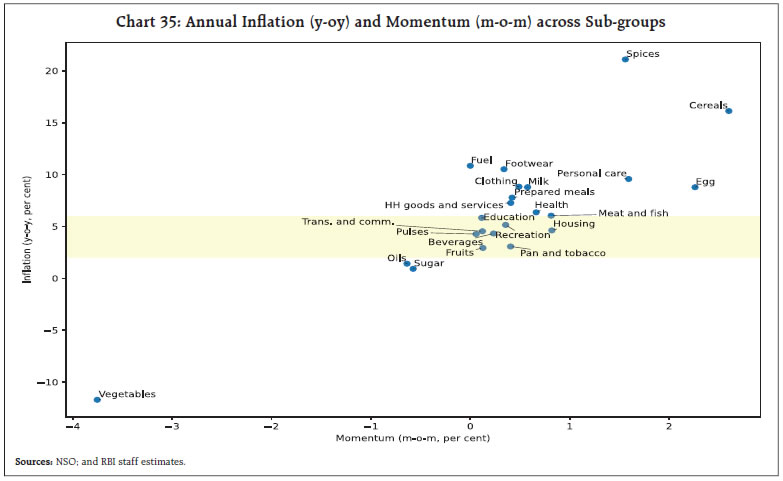 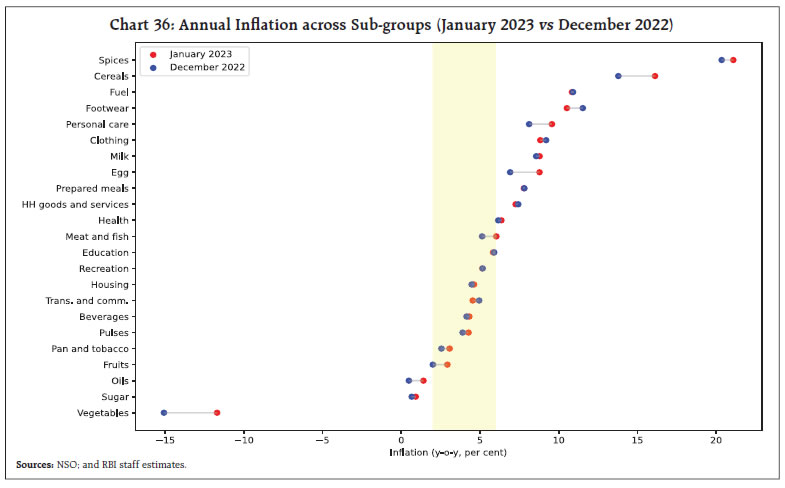 Rural inflation at 6.85 per cent continued to outpace urban inflation (6.00 per cent) in January 2023. While inflation in cereals, fruits, clothing were higher in rural areas, milk, eggs, meat, and fuel and light registered higher inflation in urban centres (Chart 37). Among States, Andhra Pradesh, Madhya Pradesh and Telangana experienced inflation in excess of 8 per cent whereas Chhattisgarh, Daman and Diu, Delhi, Goa, Himachal Pradesh, Manipur and Meghalaya recorded inflation below 4 per cent (Chart 38). High frequency data on food prices for February 2023 (up to February 13) show that prices continued to increase for rice and wheat. Barring for moong, pulses prices edged down. Edible oil and vegetable prices continued to witness a decline in February (Chart 39). 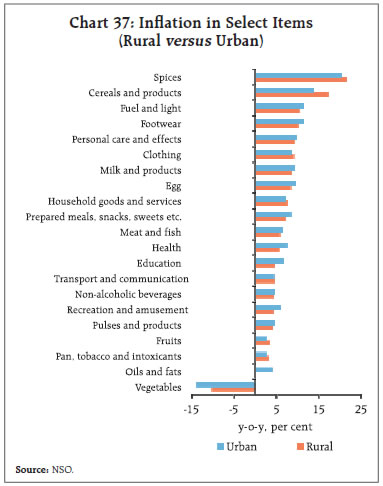 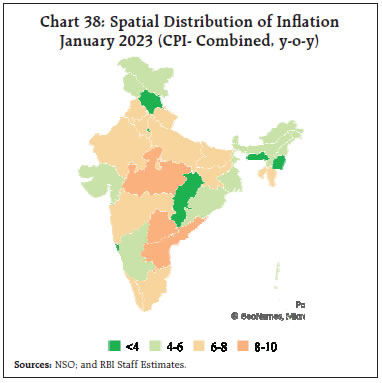 Retail selling prices of petrol and diesel in the four major metros remained steady in February so far. While LPG prices were kept unchanged, kerosene prices increased after declining sharply in January (Table 3). 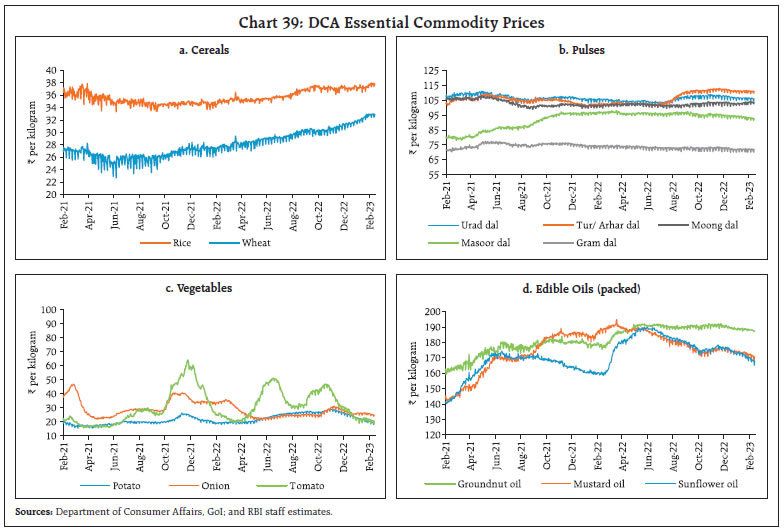 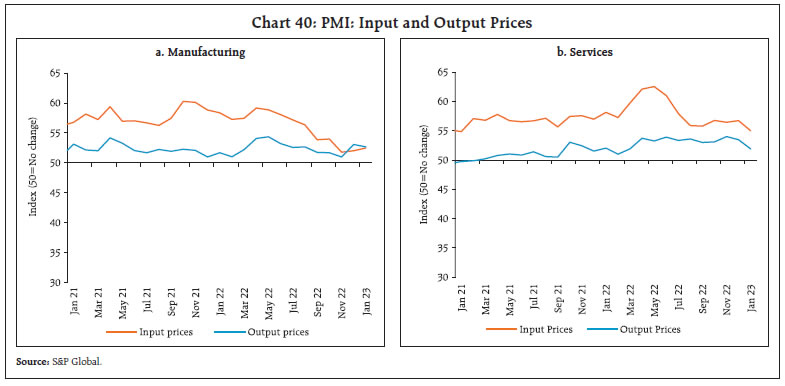 Input costs and selling prices, as reflected in the PMIs, remained in expansionary mode for both manufacturing and services (Chart 40), with the latter witnessing a sequential moderation in the pace of increase. Surplus liquidity moderated in the second half of January 2023 due to outlflows on account of GST collections16, but government spending at the beginning of February expanded system liquidity again. Overall, average daily absorptions under the liquidity adjustment facility (LAF) narrowed to ₹1.3 lakh crore during January 16 through February 8, 2023 from ₹1.5 lakh crore during mid-December through January 15, 2023 (Chart 41). Of the daily average surplus liquidity during this period, ₹0.4 lakh crore was absorbed through the overnight standing deposit facility (SDF), while the remaining was mopped up through variable rate reverse repo (VRRR) auctions. Declining surplus liquidity prompted some banks to access the marginal standing facility (MSF), which averaged ₹0.06 lakh crore during the same period. Banks resorting to the MSF in the backdrop of large placement of surplus funds under the SDF is reflective of skewed liquidity distribution in the system. On a net basis (adjusted for injections through repo and MSF), average absorption declined to ₹0.34 lakh crore during the period under review from ₹0.51 lakh crore in the preceding period with net LAF slipping intermittently into deficit mode. The amount parked under the fortnightly VRRR auctions was also lower at ₹0.35 lakh crore for the fortnight beginning January 27, 2023 (₹0.52 lakh crore during the previous auction). 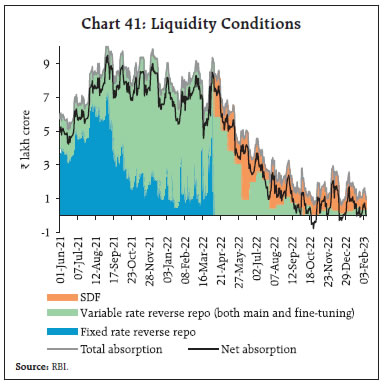 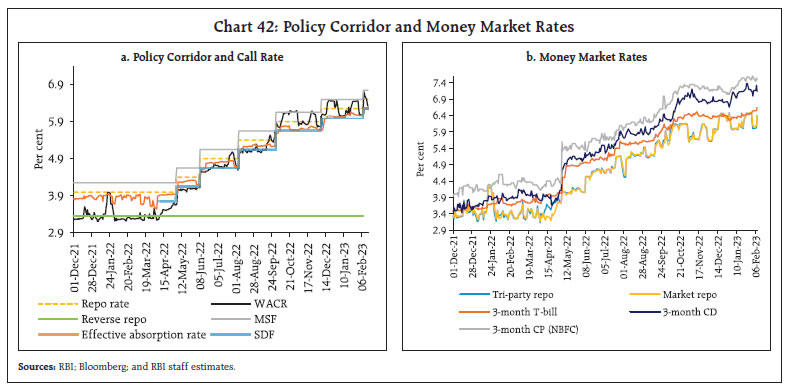 Amidst moderating surplus liquidity conditions and upcoming maturity of long term repo operations, the Reserve Bank, for the first time under the revised liquidity framework, conducted 14-day variable rate repo (VRR) operation on February 10, 2023 for which bids received amounted to ₹1.34 lakh crore, as agianst the notified amount of ₹0.50 lakh crore. Going ahead, the likely increase in government spending as evident from the revised estimates for 2022-23 presented in Union Budget 2023-24 would help offset the expected liquidity drainage from the usual expansion in currency in circulation during February -March and the maturity of LTRO and TLTRO (partially) during March-April 2023.17 The weighted average call rate (WACR) briefly touched the upper bound of the LAF corridor towards the end of January 2023, but softened thereafter. During the period under review, the WACR averaged 6.28 per cent, trading (on an average) close to the policy repo rate (Chart 42a). Activity in the call market picked up, with average daily volume at ₹14,420 crores during January 16 through February 8, 2023, up from ₹11,343 crore during December 13, 2022 to January 15, 2023. Concomitantly, rates in the collateralised segment also firmed up – while the triparty repo rate traded 4 bps below the policy repo rate, market repo rates traded close to the policy repo rate. Across the term money segment, the rate on 3-month treasury bill (T-bill) traded 7 bps below the MSF rate while the 3-month rates for certificates of deposit (CDs) and commercial papers (CPs) for NBFCs ruled 67 bps and 102 bps, respectively, above the MSF rate (Chart 42b). In the primary market, fund mobilisation through CD issuances was robust at ₹5.2 lakh crore during the year so far (up to January 13), higher than ₹1.3 lakh crore for the corresponding period last year, reflecting banks’ additional demand for funds on account of buoyant credit offtake. CP issuances declined to ₹10.9 lakh crore during the year so far (up to January 15) from ₹17.2 lakh crore in the corresponding period last year, with recourse to bank credit emerging as the preferred mode of funds mobilisation. The average risk premia in the money market (3-month CP minus 91-day treasury bill) remained elevated at 110 bps during this period, reflecting the moderation in surplus liquidity. 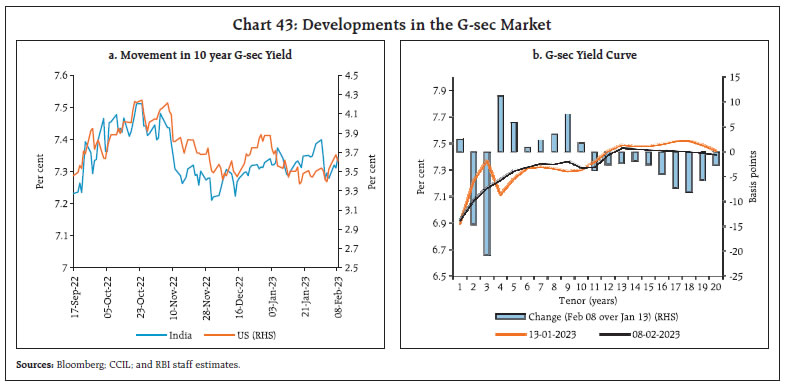 The 10-year benchmark g-sec yield eased in response to the commitment to fiscal consolidation in the Union Budget 2023-24 and the announcement of lower than anticipated gross market borrowings (Chart 43a). After peaking at an intra-day high of 7.40 per cent, the benchmark yield eased to 7.28 per cent by the end of the trading session on the budget announcement day, i.e., February 1, 2023. Subsequently, the G-sec yield exhibited a hardening bias in tandem with US treasury yields and closed at 7.34 per cent. Across the term structure, g-sec yields moderated sharply at the short end of the yield curve, which is indicative of lower rate hike expectations, going forward (Chart 43b). Corporate bond yields and spreads hardened across rating categories, particularly for 3-5 years maturities where issuances are mostly concentrated (Table 4). Funds mobilised through corporate bond issuances increased to ₹1.37 lakh crore during December from ₹0.77 lakh crore in November 2022. The average risk premia in the bond market (5 year AAA minus 5 year g-sec) firmed up to 52 bps during January 16 through February 8, 2023 from 40 bps during December 13, 2022 to January 15, 2023. Reserve money (RM) excluding the first-round impact of change in cash reserve ratio (CRR) grew by 8.8 per cent (y-o-y) as on February 10, 2023 (7.7 per cent a year ago) [Chart 44a]. Currency in circulation (CiC), the largest component of RM, grew by 8.15 per cent (8.2 per cent last year). Money supply (M3) grew by 9.8 per cent as on January 27, 2023 (8.4 per cent last year), primarily driven by its largest component - aggregate deposits with banks - which grew by 10.0 per cent. Scheduled commercial banks’ (SCBs’) credit growth remained resilient at 16.3 per cent as on January 27, 2023 (8.2 per cent last year). With the pick-up in deposit mobilisation, the incremental C-D ratio has moderated since mid-December 2022 (Chart 44b). Banks have revised their external benchmark-based lending rates (EBLRs) upwards by a magnitude of 225 bps during May 2022 to January 2023. The 1-year median marginal cost of funds-based lending rate (MCLR) of SCBs has increased by 120 bps. Consequently, the weighted average lending rates (WALR) on fresh and outstanding rupee loans of SCBs increased to 137 bps and 80 bps, respectively, during May-December 2022. The weighted average domestic term deposit rate (WADTDR) on outstanding deposits of SCBs increased by 75 bps during the same period (Table 5). The Government of India revised the rates on various small savings schemes for Q4:2022-23 in the range of 20 to 110 bps on December 30, 2022, with the highest increase in time deposits (Chart 45). The interest rates on post office term deposits of up to 3-year tenor are now closely aligned with formula-based rates. A new scheme, i.e., Mahila Samman Savings Certificate, was announced in the Union Budget 2023-24 which would offer a deposit facility up to ₹2 lakh for a tenor of 2 years at a fixed interest rate of 7.5 per cent for female depositors. The term deposit rates offered by banks are, in general, lower than those on small savings deposits of similar maturity for up to 3-year tenor. 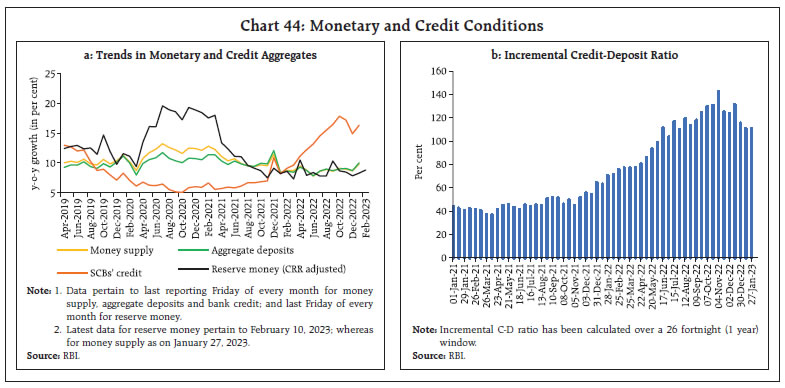 After remaining rangebound in the first half of January 2023, domestic equity markets initially moved higher in the second half, tracking the reduction in windfall tax on crude oil. Sentiments turned negative towards the end of the month, following the unusual price movement in the stocks of a business conglomerate. Overall, with FPIs turning net sellers, the BSE Sensex declined by 2.1 per cent during January 2023 (Chart 46). Nevertheless, the Union Budget 2023-24 announcements relating to increase in capital expenditure and select direct tax reliefs18, statements by financial sector regulators re-affirming soundness of domestic financial and macroeconomic conditions helped boost market sentiments. The BSE Sensex gained 2.9 per cent during February 2023 (up to February 15, 2023). 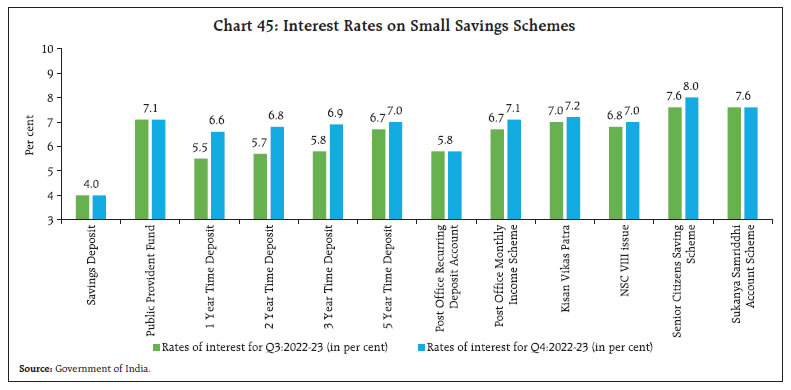 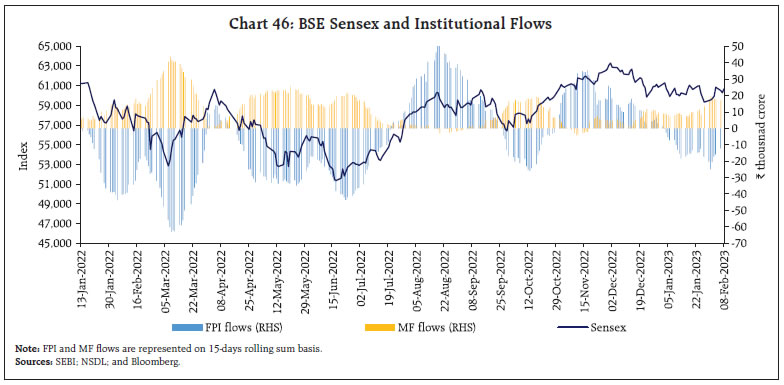 The Indian equity market completed its transition to a faster settlement mechanism on January 27, 2023, with all securities in the equity segment moving to T+1 settlement. This marks the culmination of a process that began in September 2021, making India one of the global leaders with the shortest settlement cycles that will help reduce risks associated with settlement, counterparty and operations and also have a positive impact on trading volumes. Corporate earnings results declared by 1,109 non-financial sector companies19 for Q3:2022-23 showed that revenue growth of companies witnessed moderation (Chart 47a). Despite growth in expenditure out-pacing revenue, operating profit improved marginally on a y-o-y basis supported by other income. Operating profit margin showed an improvement on a sequential basis as input cost pressures eased. Other income, which includes the income from treasury management activities of the corporates, exhibited growth. Overall, net profit growth (y-o-y) of non-financial corporates remained negative for the second consecutive quarter. Services sector reported robust growth in sales and operating profit. Higher interest costs and other expenses, primarily in the iron and steel industry, led to a fall in net profits of manufacturing companies by 18.0 per cent (y-o-y) [Chart 47b]. Earnings of banks and other financial sector companies20 remained robust with strong double-digit expansion in revenues (y-o-y) aided by credit growth (Chart 48). Other income, which inter alia includes profit/loss from security transactions, fees and commissions, also registered a sharp increase. With expenditure rising slower than the top-line, operating profits increased. Provisioning costs remained flat on y-o-y basis and in turn aggregate net profits of banks and financial sector companies registered a strong growth. 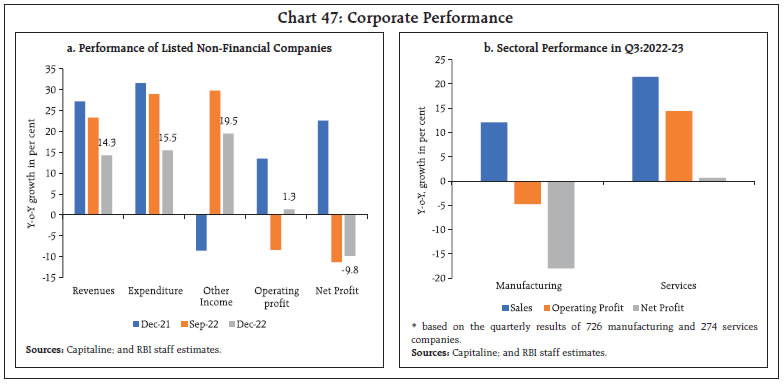 Gross inward foreign direct investment (FDI) moderated to US$ 55.3 billion during April-December 2022 from US$ 61.6 billion a year ago (Chart 49). Net FDI worked out to US$ 22.3 billion during this period compared to US$ 24.8 billion a year ago, mainly reflecting a decline in equity inflows. The bulk of FDI equity inflows were received by manufacturing, financial services, computer services, retail and wholesale trade, and communication services during April-December 2022. The US, Singapore, and Mauritius were the major source countries of FDI during this period. 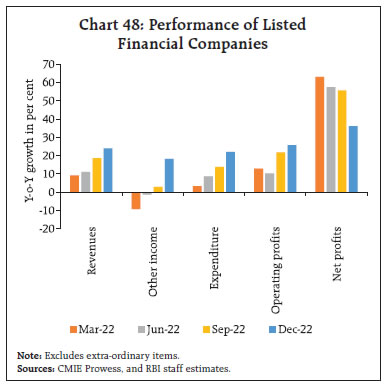 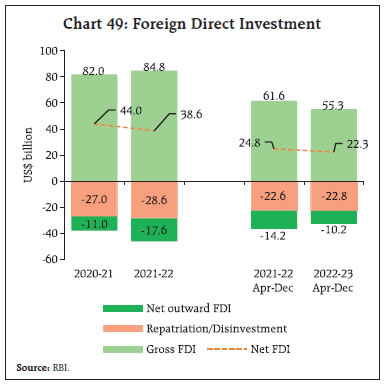 The theme of ‘Infrastructure and Investment’ and ‘Green Growth’ of the Union Budget augurs well for the FDI outlook in 2023-24. India ranks second in the ‘FDI Standout Watchlist’ which assesses the FDI trajectory of the world’s top 50 FDI destinations.21 FPIs turned net sellers in domestic capital markets in January 2023 (Chart 50). Net FPI outflows from India were to the tune of US$ 3.1 billion in January 2023, led by the equity segment. However, the debt segment witnessed inflows of US$ 0.6 billion during January 2023. Financial services, automobile and auto components, and metals and mining sectors attracted the bulk of portfolio investment in the equity market. On the other hand, disinvestment was reported in information technology, consumable fuels and capital goods stocks. External commercial borrowing (ECB) registration amounts22 stood at US$ 20.4 billion during April-December 2022 as against US$ 24.5 billion in the corresponding period last year. Intra-year movements show that after a dip in Q1:2022-23, registration amounts picked up, partly supported by the liberalising measures announced by the Reserve Bank on July 6, 2022. Although gross disbursements of ECBs to India were at US$ 15.6 billion during April-December 2022, net ECB turned negative due to higher repayments, and a significant portion of the recent ECB registrations being earmarked to be drawn later (Chart 51). 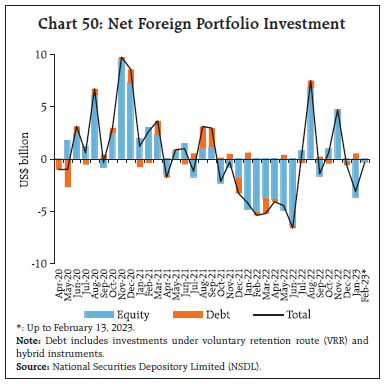 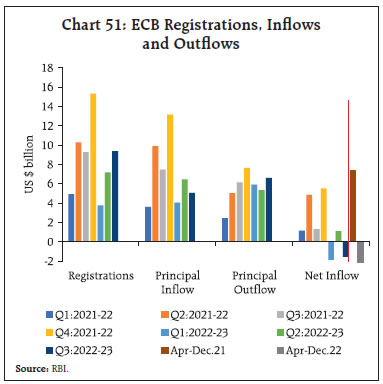 Over three-fourths of the ECB agreement amount during April-December 2022 remained effectively hedged and the remainder included loans with natural hedges (i.e., borrowers’ earnings are in foreign currency) [Chart 52]. India’s foreign exchange reserves increased by US$ 42.6 billion since end-September 2022 and stood at US$ 575.3 billion as on February 3, 2023, covering more than nine months of imports projected for 2022- 23 (Chart 53). 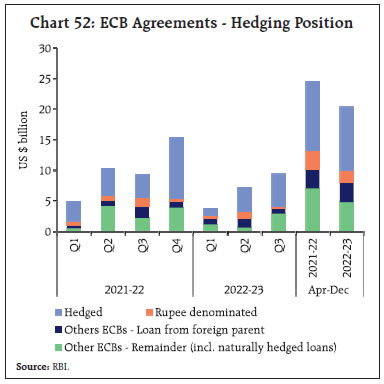 In the foreign exchange market, the Indian rupee (INR) appreciated by 0.7 per cent vis-à-vis the US dollar (m-o-m) in January 2023, as the US Fed adopted a less hawkish stance and the US dollar depreciated by 1.7 per cent (Chart 54). The performance of the rupee was in line with many other EMEs and reserve currencies. 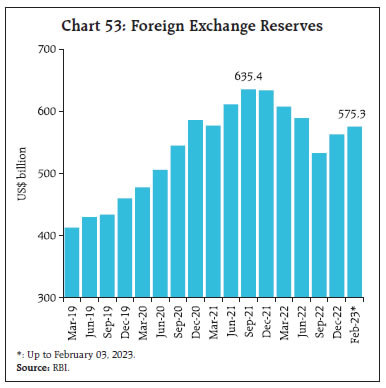 In terms of the 40-currency real effective exchange rate (REER), the INR depreciated by 0.4 per cent in January 2023 (m-o-m) (Chart 55). 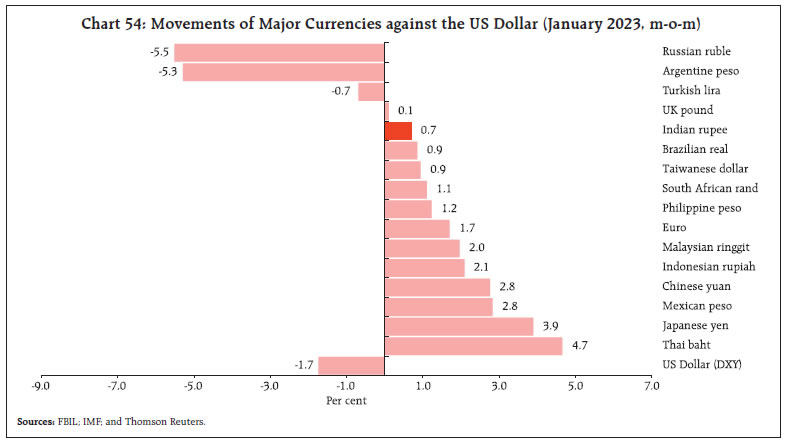 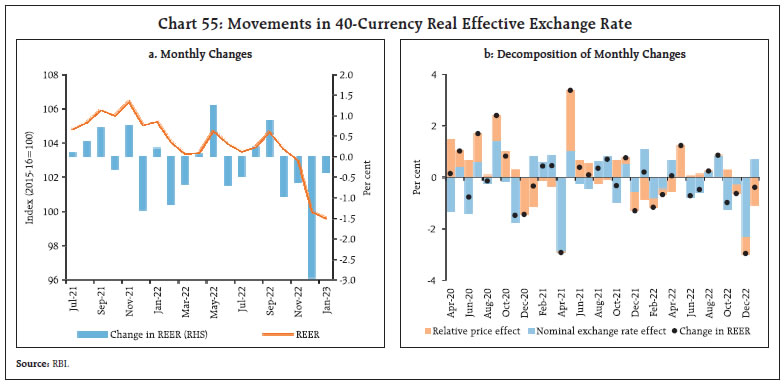 Payment Systems Digital transactions advanced across various modes and the retail segment continued to gain strong traction, led by the Unified Payments Interface (UPI) [Table 6]. On the supply side, the number of payment acceptance devices deployed under the Payment Infrastructure Development Fund (PIDF) Scheme expanded by 59 per cent during April-December 2022. The Statement on Developmental and Regulatory Policies of February 8, 2023 proposed measures to expand the scope of activity on the Trade Receivables Discounting System (TReDS) by allowing participation of insurance companies and agencies undertaking factoring business, and the enabling of secondary market operations on the TReDS platforms. It also proposed extension of the UPI (for merchant payments) for all inbound travellers to India while they are in the country. Additionally, the National Payments Corporation of India (NPCI) has enabled onboarding of non-resident Indians from 10 countries on the UPI platform.23 As a testament to growing digital adoption, the recently released Reserve Bank’s Digital Payments Index (RBI-DPI) showed a growth (y-o-y) of 24.1 per cent in September 2022. Going ahead in 2023, the user penetration rate of digital payments in India is expected to exceed that of the world.24 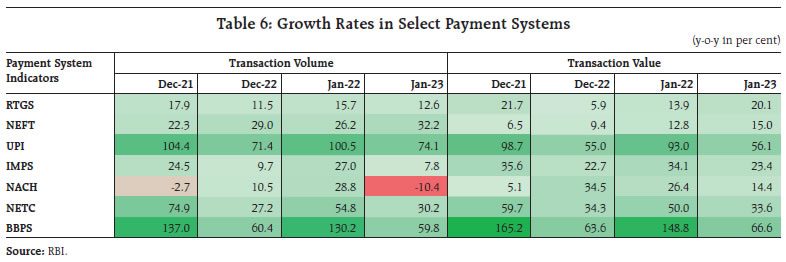 The Union Budget 2023-24 also announced various measures to build robust digital public infrastructure. They include continuing fiscal support of ₹1500 crore to incentivise adoption of digital payment modes, establishing an agriculture accelerator fund, enabling safer access to anonymised data through a National Data Governance Policy, expanding the scope of documents available through DigiLocker25, creating an ‘Entity DigiLocker’ for storing and sharing information by businesses, training MSMEs for developing digital capabilities, establishing centres of excellence to promote development of Artificial Intelligence (AI) startups, setting up of 100 labs for developing applications using 5G services and simplifying the know your customer (KYC) process. Conclusion We believe that India will decouple from macroeconomic projections of current vintage and also from the rest of the world. In our view, the instrument of decoupling will be the Union Budget by (a) raising India’s growth prospects over the period 2023-27; and (b) raising India’s potential growth. Turning to the immediate growth prospects, the Union Budget has won appreciation from all quarters on several counts. Besides the promises kept on consolidation and capital expenditure, the tax changes proposed in the Budget will put at least ₹35,000 crore in the hands of households. The implications of these three aspects on the outlook for growth are profound. First, the saving on taxes will boost spending by households on consumption. With India’s marginal propensity to consume (MPC) estimated at 0.54, the tax multiplier works out to be 1.16. Hence, India’s real GDP growth would get a boost of 15 basis points in 2023-24 from tax reductions alone. Second, the increase in the allocation for capital expenditure (including loan assistance to States, railways, logistics and grants-in-aid for creation of capital assets which are excluded under the effective revenue deficit and hence added to the capital account) works out to ₹3.2 lakh crore in 2023-24.26 This increased capital spending will generate additional output of ₹10.3 lakh crore during 2023-27 - unlike the tax multiplier which has a short-run impact, the dynamic capital expenditure multiplier rises from 1 in the first year to 2.45 in the second year, 3.14 in the third year and peaks at 3.25 in 2026-27. Capex on railways and loan assistance to States will contribute 43 per cent of this increased income while investment in logistics (₹60,000 crore) is expected to generate income of ₹1.95 lakh crore over 2023-27 or 19 per cent of the increased income. Third, fiscal consolidation can free up productive resources for the private sector and also contribute to lowering the cost of capital. In the Union Budget, total expenditure is budgeted to decline by 0.41 per cent of GDP.27 This will free up resources for private investment. In conjunction with the expenditure multiplier28, this can raise the growth rate of the economy in 2023-24 by 10 basis points. Putting all these together and taking the Economic Survey’s growth projection of 6.5 per cent as the base, the Union Budget’s tax, capex and fiscal consolidation proposals can take India’s real GDP growth close to 7.0 per cent in 2023-24 if they are effectively implemented. Turning to India’s potential, the Union Budget will expand the productive capacity of the economy by (a) the thrust on capex; (b) the exploitation of new technologies such as digitization and greening the economy; and (c) by seizing the demographic dividend which together can expand the production possibility frontier of the Indian economy. First, besides the sustained emphasis on capex, setting up Skill India Digital Platform, Centers of Excellence for Artificial Intelligence, National Data Governance Policy, and simplification of KYC norms could impart a positive productivity shock and lead to an increase in total factor productivity (TFP) that can raise potential growth by 10 basis points per annum. Second, the Union Budget speech proposes 12 schemes under the green growth priority with a concrete outlay of ₹85 thousand crore already outlined under four schemes.29 This could crowd in ₹1.7 lakh crore of private investment (taking a crowd-in factor of 2)30, bringing the total green investment to ₹2.6 lakh crore and an increase in GDP of ₹3.3 lakh crore or around 100 basis points of potential output up to 2030. Seizing the demographic dividend by skilling youth and teachers alongside setting up physical and digital libraries could raise potential GDP growth by 5 basis points to 15 basis points a year.31 The environment of macroeconomic stability engendered by fiscal consolidation and hence reduction of debt is expected to bring down inflation in the medium run, with a consequent reduction in macroeconomic volatility and country risk premium, ushering in a virtuous cycle. Estimates suggest that on a standalone basis, i.e., without taking into account other factors that influence the inflation trajectory, this could lead to a reduction in inflation by an average of 26 basis points per annum over the next five years32 which, in turn, would push up potential growth by another 10 basis points.33 Taking all these factors into account, potential growth is expected to shift upwards from 6.0 per cent (estimated by the IMF in 2022-2334) to 6.8 per cent.35 With the raising of India’s potential growth due to measures announced in the Budget, there is likely to be a faster consolidation of Union Government debt to 54.3 per cent of GDP by 2027-28. In mythologies across civilisations, the sun is depicted as riding a chariot typically drawn by four horses. This is so, for instance, for Apollo in Greece; Ra in Egypt; Sol in Rome. In Indian mythology, however, the sun’s chariot is drawn by seven horses. Many interpretations are available as to what the horses signify – various scriptures assign them the seven colours of the rainbow; the seven vedic meters or prosodies; and the like. The seventh horse represents dreams, aspirations and the future. It is said that even if the other six horses are injured or exhausted, the seventh horse can take the sun’s chariot to its destination. This is the subject of a celebrated book by Dr. Dharamvir Bharati and also of an eponymous film by Shyam Benegal called Suraj ka Satvan Ghoda (सूरज का सातवाँ घोड़ा). In our view, the Union Budget 2023-24 is the seventh horse of the sun. Annex 1: Major Takeaways from the RBI’s Enterprise Surveys
* This article has been prepared by G. V. Nadhanael, Madhuresh Kumar, Kunal Priyadarshi, Harshita Keshan, Ramesh K Gupta, Pankaj Kumar, Harendra Behera, Arjit Shivhare, Rashika Arora, Anoop K Suresh, Love K Shandilya, Rohan Bansal, Sudhanshu Goyal, Priyanka Sachdeva, Satyam Kumar, Akshara Awasthi, Yuvraj Kashyap, Anshu Kumari, Ashish S Khobragade, Rajesh Kavediya, Supriya Majumdar, Vivek Kumar, Sourajyoti Sardar, Nivedita Banerjee, Bichitrananda Seth, Sujata Kundu, Shesadri Banerjee, Ipsita Padhi, Saksham Sood, Vineet Kumar Srivastava, Samir Ranjan Behera, Deba Prasad Rath and Michael Debabrata Patra. Views expressed in this article are those of the authors and do not represent the views of the Reserve Bank of India. 1 John Kenneth Galbraith, Wall Street Journal, January 22, 1993. 2 The US Federal Reserve; the European Central Bank; the Bank of England. 3 Pierre-Olivier Gourinchas, IMF, World Economic Outlook Update Proceedings, January 31, 2023. https://www.imf.org/en/News/Articles/2023/01/31/tr-13123-world-economic-outlook-update. 4 “Paul Volcker is regarded as the greatest of all time (GOAT) central banker. Less known, however, is the serious policy mistake that he made in 1980. With the unemployment rate rising by more than a percentage point to more than 7 per cent in May after a recession began, the Fed decided to reverse course and sharply lower the federal funds rate by more than 7 percentage points. This action was taken despite the fact that inflation reached a peak of 14.7 per cent in April. The Fed had blinked and Volcker’s credibility as an inflation fighter took a hit. Inflation expectations stayed stubbornly high and actual inflation remained above 12 per cent through to the end of 1980. With the recession ending in July 1980, the Fed got back into the inflation fighting business and started to raise the federal funds rate again. But this time, to re-establish its credibility, the Fed had to raise the federal funds rate to a crushing level of nearly 20 per cent by the middle of 1981. The ensuing recession that started in July 1981 became the most severe downturn since the second world war.” (Frederic Mishkin, Financial Times, September 14, 2022). 5 Kristalina Georgiva, Confronting Fragmentation Where It Matters Most: Trade, Debt, and Climate Action, IMF Blog. January 16, 2023 6 A distinction has been drawn between Odyssean forward guidance, which publicly and explicitly commits the central bank to a future action, and Delphic forward guidance, which forecasts macroeconomic performance with likely monetary policy actions implicit in them (Campbell. J.R., Charles E Evans, Jonas D M Fisher and Alejandro Justiniano, Macroeconomic Effects of Federal Reserve Forward Guidance, Brookings Papers on Economic Activity, Spring 2012) 7 Monetary Policy Statement, 2022-23 Resolution of the Monetary Policy Committee (MPC) February 6-8, 2023. 8 Dani Rodrick, July 5, 2022, Project Syndicate. 9 Sub-indices include cereal, vegetable oil, dairy, meat and sugar price indices. 10 Around 55 per cent of India’s domestic demand for edible oil is met through imports. 11 Solvent Extractors’ Association of India. 12 https://www.reuters.com/markets/commodities/indonesia-suspend-some-palm-oil-export-permits-senior-official-2023-02-06/ 13 Solvent Extractors’ Association of India. 14 https://www.agriwatch.com/newsdetails.php?st=NEWS&commodity_id=11&sid=631435 15 The data pertains to 24 States. 16 The monthly GST collections of January 2023 at ₹1.56 lakh crore was second highest after ₹1.68 lakh crore in April 2022. 17 ₹13,517 crore will mature in February-March 2023 and ₹61,131 crore will mature in April 2023. 18 The Finance Minister proposed several changes in the new personal income tax regime, such as enhancing the income limit for a rebate of income tax from ₹5 lakh to ₹7 lakh, rationalisation of the tax slabs, provision of standard deduction for the salaried class, reduction of highest surcharge rate from 37 per cent to 25 per cent, etc. along with tax benefits for MSMEs, co-operatives, and start-ups. These measures are expected to cost ₹37,000 crore in forgone direct tax revenues. 19 The early results cover 74.3 per cent of total sale size covered in RBI study on ‘Performance of Private Corporate Business Sector during Q3:2021-22’. 20 Based on results of 862 banks and other financial sector companies which represent around 89 per cent of the market capitalisation. 21 FDI outlook 2023, fDi Intelligence. 22 Registration amounts capture the sanctioned borrowing amount through ECB route. 23 NPCI Circular, January 2023. 24 Source: Statista database accessed as on February 03, 2023. 25 DigiLocker is a secure cloud-based platform for storage, sharing and verification of citizens’ documents and certificates. 26 The effective capital expenditure of the Union government is budgeted to increase to ₹13.7 lakh crore in 2023-24 (BE) from ₹10.5 lakh crore in 2022-23 (RE). 27 In 2023-24 (BE) total expenditure is budgeted to decline to 14.92 per cent of GDP from 15.33 per cent of GDP in the previous year, resulting in a decline of 0.41 per cent of GDP. 28 The expenditure multiplier in an expansionary phase of the business cycle is estimated at (-) 0.22 over four quarters, unlike the positive expenditure multiplier in a period of slowdown when the private sector demand for credit generally weakens (Report on Currency and Finance, 2022). 29 The budget outlines 12 proposals including green hydrogen mission, energy transition, energy storage projects, renewable energy evacuation, green credit programme, PM-PRANAM, GOBARdhan scheme, Bhartiya Prakritik Kheti Bio-Input Resource Centres, mangrove initiative for shoreline habitats & tangible incomes (MISHTI), Amrit Dharohar, coastal shipping and vehicle replacement. 30 see IEA (2012), IMF (2021), Inter-American Development Bank (2006), European Commission (2013). 31 Some of the references include Tilak (1989); Tabar et al., (2016); Gemmell et al., (2016); and De Ridder et al., (2020). 32 Internal estimates based on Van Bon, N. (2015). 33 Internal estimates based on Mohaddes and Raissi (2014). 34 Article IV Consultations, December 2022. 35 The higher potential growth assessment is based on estimation of impact of different growth supportive measures in the budget individually which are then aggregated, and not in a dynamic model framework to capture cross effects among all these key measures. The assessed increase in potential growth is also likely to materialise over the next few years and not in 2023-24 as the full impact of some of the measures, as mentioned above, would materialise by 2026-27 and even later by 2030. 36 /en/web/rbi/-/press-releases/rbi-releases-the-results-of-forward-looking-surveys-55184 |

এই পৃষ্ঠাটো শ্বেয়াৰ কৰক:


ভাৰতীয় ৰিজাৰ্ভ বেংক মোবাইল এপ্পলিকেষ্যন ইনষ্টল কৰক আৰু নৱীনতম বাতৰিৰ প্ৰৱেশাধিকাৰ পাওক!
আমাৰ এপটো ইনষ্টল কৰিবলৈ QR ক’ড স্কেন কৰক


পৃষ্ঠাটো শেহতীয়া আপডেট কৰা তাৰিখ:


