 IST,
IST,


State of the Economy
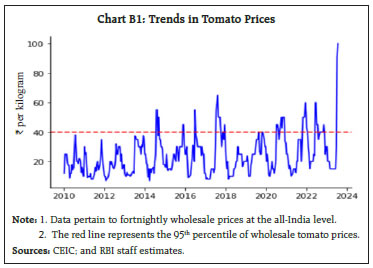
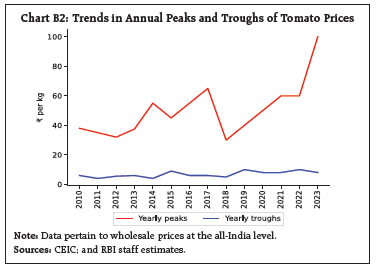
Global growth momentum appears to be stalling, especially manufacturing and investment, amidst moderating headline inflation with a stubborn core. Market expectations of future interest rates have gone up in response to the hawkish policy stance; equity prices have flattened; and bond yields have hardened. In India, the rain deficit is rapidly closing amidst a highly cyclone-skewed distribution. Manufacturing and services activity remains in expansion albeit with some sequential moderation in June. The overall balance of payments surplus improved strongly in Q1:2023-24, indicating that financial flows comfortably exceeded the current account deficit. Introduction As torrential monsoon rains lash north-west India in July, setting off landslides, bringing most rivers to spate and setting off floods, it is sobering to remember that the month just gone by was the hottest June globally on record. Across the world, surface air temperatures crossed the critical 1.5 degrees Celsius threshold committed under the Paris Agreement. Global temperature maps have become dark red as abnormally high temperatures recorded on both land and sea pushed the average atmospheric temperature on July 5 to 62.9 degrees Fahrenheit, breaking all previous records. The World Meteorological Organisation has stated that the beginning of July was the hottest week on record.1 Climate scientists believe that this is the result of accumulating global warming and a powerful El Nino pattern that has developed over the Pacific Ocean.2 It is a stern warning that we are heading into very warm uncharted territory. More than 90 per cent probability has been assigned to El Nino persisting into 2024, fuelling concerns about another year of unprecedented heat. In this context, the pledge in early July by the International Maritime Organisation to achieve net zero emissions by or around 2050 may have missed the boat of achieving the 1.5 degrees Celsius target. In this torridity, global growth momentum appears to be stalling, especially manufacturing and investment. International trade is also showing the knock-on effects of re-engineering of supply chains through muscular industrial and trade policies. Once again, the world’s constituents are set on diverging paths and the fear that a global growth deficit may be festering beneath the headline developments. The US economy is displaying surprising vigour, with fresh signs of labour market strength reflected in an ebbing of the unemployment rate in June and a higher than expected rise in hourly earnings. Interestingly, the surge in the US job quits rate has abated from its pandemic peak and top-line hiring is firming up. On the other side of the Atlantic, output has contracted in several manufacturing-heavy economies of Europe although labour markets remain tight and unemployment rates close to historical lows. China’s re-opening has not triggered the tailwinds for global growth that were widely expected. By contrast, emerging market economies (EMEs) in Latin America and Asia are growing at a solid pace. The update of the World Economic Outlook by the International Monetary Fund (IMF) later this month should shed new light on the state of the world economy. Globally, inflation has been moderating on the back of easing commodity prices. Yet core inflation remains stubborn due to still strong momentum in prices of services that are usually sticky, with output being relatively labour-intensive and susceptible to wage pressures. The narrative about inflation is coalescing around the view that while the disinflation was achieved in about a year as in earlier inflation episodes, the ‘last mile’ in the descent to the target may pose the biggest challenge.3 Although rents and used car prices may offer a downside to core inflation going forward, it is believed that households and firms may first seek to recoup previous and expected future losses through their wage- and price-setting decisions. These effects may play out more strongly in countries where inflation expectations are less anchored and indexation is more prevalent. Moreover, as the Bank for International Settlements (BIS) points out, the share of items in the consumer price index whose prices increased at a fast rate has not come down. Also, price spillovers across consumption categories are slightly larger in the current inflation episode than they were in the recent past. This implies that increases in the price level due to price shocks in one category are propagating to others and sustaining overall inflation pressures. Price changes across categories are becoming increasingly similar, implying that differences in consumption patterns across consumers and input cost pressures across firms matter relatively less and the general price level becomes more relevant for individual decisions. Consequently, policy authorities in advanced economies (AEs) are bracing up for a possible self-sustaining wage-price dynamics and a de-anchoring of inflation expectations upsetting the disinflation that is underway. In EMEs, by contrast, evidence of a wage-spiral building up is weak, but the re-anchoring of inflation expectations remains work in progress in view of the severe erosion of purchasing power. Across the world, businesses that were driving up inflation by flexing pricing power and jacking up output prices more than input costs – or greedflation4- will now face narrowing profit margins as wage pressures rise and drive up prices – ‘wageflation’5. Although many central banks have reduced the pace of interest rate increases, they have signalled their readiness to increase interest rates further and keep them high as long as they see the labour market as the key inflation risk. In response, market expectations of future interest rates have gone up, equity prices have flattened and bond yields have hardened. Corporate bond issuances have stabilised, with those in high-yield segments virtually drying up. Economists warn, however, of the risks of a deep recession and/or a systemic financial crisis6. In particular, they worry that the tightening of financial conditions could set off a rapid repricing of assets and a sharp rise in credit spreads leading up to significant financial stresses. Higher rates can also amplify other vulnerabilities arising from high levels of indebtedness among households and governments. Hence, they believe that financial stresses could generate tensions between central banks’ price and financial stability objectives, especially if fiscal space is inadequate or in consolidation. In such circumstances, it is argued that central banks may actually tolerate a somewhat slower return to the inflation target to avert systemic stress. Another view is that even if further financial stress were to emerge, price stability should not be compromised. In the longer run, the objectives of price and financial stability do not pose a trade-off. If, an inflation psychology takes root, it could heighten the risks of a deeper and systemic financial instability.7 And moreover, central banks are in no mood to give up their hard earned credibility. Should signs of financial stress emerge, they will put on their lender-of-last resort hats – the Bagehot dictum: “to avert panic, lend early and freely to solvent firms against good collateral and at high rates” – and open up the full range of macro-prudential policies rather than give up on driving inflation down to target. In India, the onset of the monsoon is typically a time for a change of gears in the growth trajectory and of sporadic price flares firming up headline inflation as in the reading for June 2023. For the farm sector, the rain deficit is rapidly closing amidst a highly cyclone-skewed distribution that has left the south peninsula and east and north-east India moisture deficient. Yet, reservoir levels are above historical averages and cereal stocks are above July 1 buffer norms by 1.1 times for wheat and by 3.1 times for rice as kharif sowing gathers pace. An insightful documentation of the ‘Odyssey’ of agricultural development in the past 75 years that witnessed India’s transformation of a food-deficient country into a leading exporter points to the green revolution, massive technological advancements, diversification towards high-value agriculture and trade liberalization in helping the agricultural sector raise its secular growth to 3.5 per cent in the post- 2000 period. Food production increased from 0.81 kg per person per day in 1950-51 to 1.87 kg/person/day. The future of agriculture in India hinges around a sustained increase in farm income stemming from the enhanced role of the private sector, science-led technology transfers, liberalised output markets, and an efficient land lease market. It has been argued that the yardstick for agricultural growth needs to be redefined as ‘productivity’, and the attainment of world-class productivity depends on cost-effective methods of production and the use of quality inputs. Green growth, promotion of agri-tech start-ups and digital initiatives, direct subsidies, more regulated use of chemicals, location-based suitable production techniques, and productive employment creation need to be expedited to reach the goals of Amrit Kaal.8 Manufacturing and services activity remains in expansion albeit with some sequential moderation in June in composite terms from a near 13-year high in April and May. Coincident indicators for the construction sector grew robustly, with cement production at a six-month high on the back of public spending on infrastructure and strong demand for both residential and commercial real estate. Domestic and international air travel is scaling new records across the nation’s 136 operational airports and airstrips. Consumption expenditure continues to be hamstrung by lingering memories of elevated price pressures. This is reflected in lower levels of spending on discretionary items such as personal care and confectionary. Spending on beverages has been held back by unseasonal rains. Progressively, the urban rural divide in sales of fast-moving consumer goods – urban spending strong; rural spending muted – narrowed within the overall moderation. Consumers are optimistic that the onset of the festival season from August and down trending food inflation will revive spends in the second quarter of 2023-24. Brokerages expect listed companies to have recorded double digit growth in their earnings in the first quarter of 2023-24, driven by banks, the automobile industry and oil and gas companies. Banks are expected to have recorded bullish loan growth although net interest margins may have compressed as deposits got repriced at a faster pace than loans. Corporate earnings are, however, expected to be led by margin expansions enabled by lower input costs rather than higher volumes and revenues. While this expected improvement in profitability for the second consecutive quarter provides congenial conditions for investment, the expectations of continuing slowdown in sales growth raises concerns about the sustainability of the current pace of growth of corporate profitability. Purchasing managers polled moderation in export orders for both manufacturing and services firms in June relative to the preceding month, but an improvement has been gradually forming in relation to the preceding quarter. With domestic demand gaining traction and import demand picking up even as exports remained weak, the current account deficit is expected to have expanded modestly in April-June 2023 from a near-balance in the preceding quarter. The overall balance of payments improved from a surplus of US$ 5.6 billion in January-March 2023 to US$ 24.4 billion in April-June 2023, indicating that financial flows comfortably exceeded the current account again on a quarterly basis. The World Investment Report 2023 of the United Nations Conference on Trade and Development (UNCTAD) expects India to remain a bright spot in a challenging global environment in which global foreign direct investment (FDI) may continue to face downward pressure. Greenfield investments provide a positive counterweight, with India and ASEAN being the most buoyant recipients right up to the first quarter of 2023. Of the number of international project finance deals, the most significant rise was in India, where project numbers increased by 64 per cent, making it the recipient of the second largest number of international project finance deals. For portfolio flows, India is clearly the flavour of the season: net portfolio investment inflows at US$ 7.2 billion scaled a ten-month high in June 2023, with cumulative net inflows during the April-June 2023 quarter at US$ 14.8 billion after net outflows of US$ 2.2 billion in the preceding quarter. In the first ten days of July 2023 alone, net inflows have crossed US$ 1 billion. The equity segment accounted for most of the inflows in June, with India attracting the maximum inflows among emerging market peers. India’s external debt remained broadly stable at US$ 625 billion at the end of March 2023, declining to 18.9 per cent of GDP from 20.0 per cent a year ago, as per the data released by the RBI at the end of June 2023. The ratio of short-term debt in the total and in relation to the level of reserves has, however, recorded an uptick in relation to the position in March 2022. Taking a broader measure of India’s total international assets and liabilities, net claims of non-residents on India [i.e., net international investment position (IIP)] declined to (-)11.2 per cent of GDP in March 2023 from (-)11.7 per cent a year ago and (-)13.2 per cent two years ago. Set against this backdrop, the remainder of the article is structured into four sections. Section II sketches the rapidly evolving developments in the global economy. The evolution of the domestic economy is laid out in Section III. Section IV evaluates the domestic financial conditions, while the last Section sets out concluding remarks. Global growth remains supported by the rebound in services, but sluggish manufacturing and trade activity are operating as drags. Although consumption demand remains resilient, risks stem from a wage-price spiral taking hold against the backdrop of tight labour markets. Meanwhile, financial conditions continue to tighten amidst high debt and volatile asset prices. Factoring in these developments, our model-based nowcast for global GDP points towards flattening of global growth momentum in Q2:2023 (Chart 1). Among high frequency indicators, the global composite purchasing managers’ index (PMI) moderated to 52.7 in June 2023 from 54.4 in the previous month. While the global services PMI remained in the expansionary zone despite a sequential moderation, the global manufacturing PMI contracted to a 6-month low of 48.8 in June 2023 following a decrease in new orders (Chart 2a). 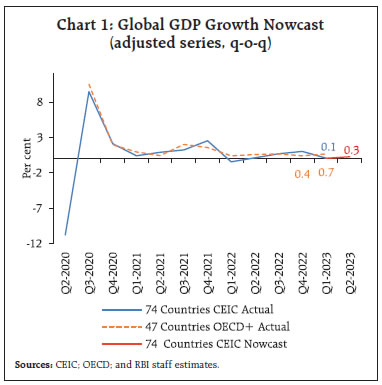 Global supply chain pressures registered some uptick in June, as reflected in the marginal pick up of global supply chain pressure index (GSCPI) after five consecutive months of decline (Chart 2b). Weakening global manufacturing also drove a decline in world trade (Chart 3). Nowcasts of the United Nations Conference on Trade and Development (UNCTAD) that were released on July 11, 2023 show world merchandise trade growth barely edging up into positive territory at 0.86 per cent in Q3:2023 from (-)0.43 per cent in Q2:2023 while the nowcasts for growth in services trade were placed at 1.55 per cent for Q2, and 0.26 per cent in Q3. Global commodity prices recorded an uptick in the first half of June 2023, followed by a correction thereafter (Chart 4a). The food price index of the Food and Agriculture Organization (FAO) declined by 1.4 per cent (m-o-m) in June 2023 to sink 23.4 per cent below its peak recorded in March 2022 as prices of vegetable oils, cereals, sugar and dairy moderated (Chart 4b). Despite a decline by 3.2 per cent in June enabled by a better than expected harvest in Brazil and a slowdown in global demand, sugar prices recorded an annual inflation of 30 per cent in June. Crude oil prices remained range bound around US$ 75 per barrel in June and US$77 per barrel in the first half of July (up to 12th), weighed down by slowing demand. Saudi Arabia’s decision to extend its supply cut through August added volatility to the market (Chart 4c). The US Energy Information Administration (EIA) lowered its forecast of global oil production through 2024, following the recent production cut announcements from OPEC+, with expectations that inventory drawdowns could trigger higher prices.9 Gold prices witnessed their third consecutive month of decline in June as central banks’ purchases slowed and retail demand for gold slumped reflecting the effect of high prices on demand as well as seasonal factors (Chart 4d). 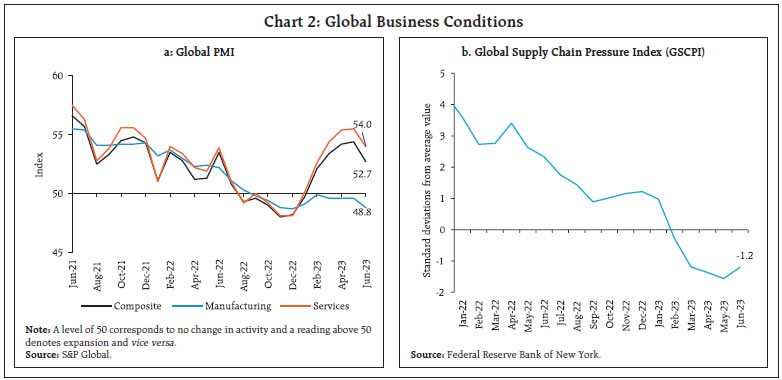  Headline inflation moderated across most economies although core inflation remained stubbornly high. As per the flash estimates, inflation in the Euro area moderated to 5.5 per cent in June 2023, its lowest level since January 2022 (Chart 5a). Annual CPI inflation in the US moderated sharply to 3.0 per cent in June 2023 from 4.0 per cent in May marking its lowest reading since March 2021. Inflation based on the US personal consumption expenditure (PCE) index slowed to 3.8 per cent in May 2023, the lowest reading since April 2021. In the UK, CPI inflation remained steady at 8.7 per cent in May 2023 while Japan’s CPI (all items minus fresh food) inflation declined to 3.2 per cent in May from 3.4 per cent in April. Among the EMEs, inflation has moderated across the board (Chart 5b). Except South Africa, all the BRICS countries recorded inflation below 5 per cent. Early signs of cooling core and services inflation are emerging in most countries except in the UK and the European Union (EU) [Chart 5c and 5d]. 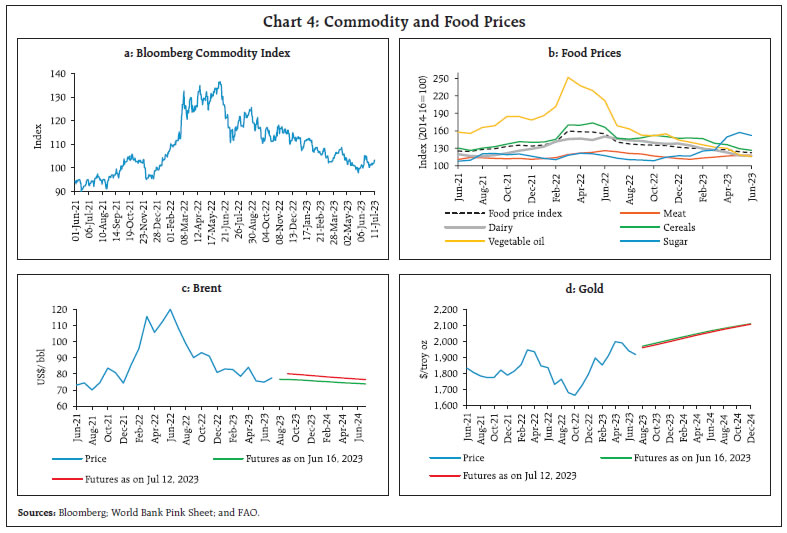 Global financial markets, especially those in AEs, gathered momentum in the first half of June but remained rangebound after hawkish policy talk by some central banks (Chart 6a). Markets, however, responded positively to lower than expected inflation in the US. Bond yields generally hardened, especially for shorter-duration bonds but fell by over 10 basis points (bps) following the inflation data release. Yield curve inversion in the US has persisted with the spread hovering around -96 bps in July 2023 (up to 12th) [Chart 6b]. In the currency markets, the US dollar depreciated in June by one per cent in response to the Federal Reserve’s pivot towards a pause in its June meeting. Although the US dollar recouped some of its losses in early July after hawkish Fed minutes reinforced rate hike expectations, it again depreciated following the larger than expected decline in CPI inflation. The Morgan Stanley Capital International (MSCI) currency index for EMEs gained marginally in June due to capital inflows (Chart 6c and 6d). 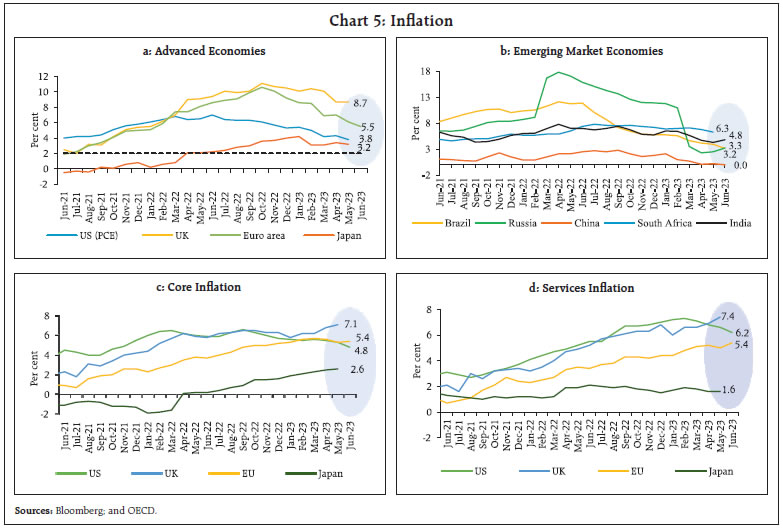 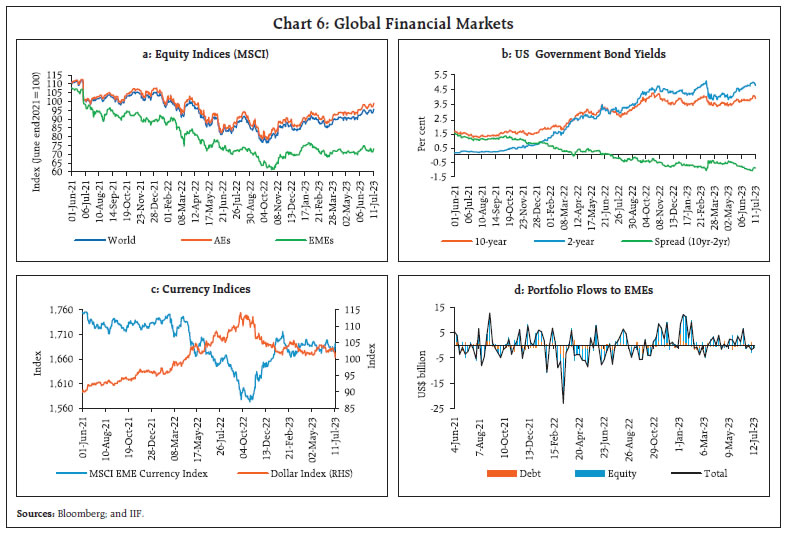 Financial conditions remain tight across jurisdictions. Restrictive credit conditions, which followed the global banking turmoil, along with declines in business investment intentions and weak corporate loan demand contributed to the tightening of financial conditions (Chart 7). Most central banks in AEs have either paused or moderated the magnitude of rate hikes (Chart 8a). The US Federal Open Market Committee (FOMC) held its target range of the federal funds rate steady (at 5.0 - 5.25 per cent) in its June 2023 meeting following a cumulative increase of 500 bps since March 2022. Australia, New Zealand and Israel also paused in their July meetings. The European Central Bank (ECB), Swiss National Bank and the Sveriges Riksbank raised their policy rates by 25 bps each in their June meetings, while Canada hiked further by 25 bps in its July meeting. The UK and Norway, however, accelerated their pace of rate hikes in their latest meetings to 50 bps from 25 bps in the previous meeting. 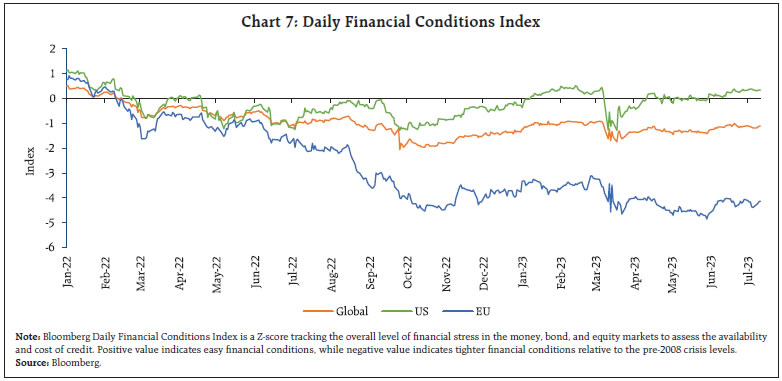 EME central banks have generally kept their policy rates constant in Q3:2023 so far (Chart 8b). The Central Bank of the Republic of Turkey, however, raised its key rate by 650 basis points to 15 per cent in June - the first hike since 2021. The Indian economy is poised to be the fastest growing major economy in the world10 despite some sequential moderation in economic activity in June. 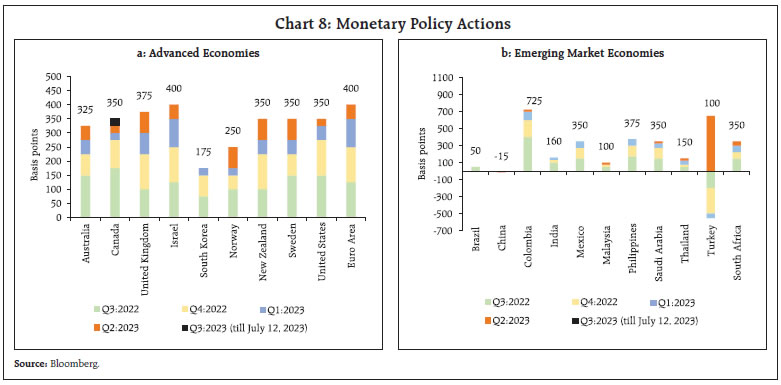 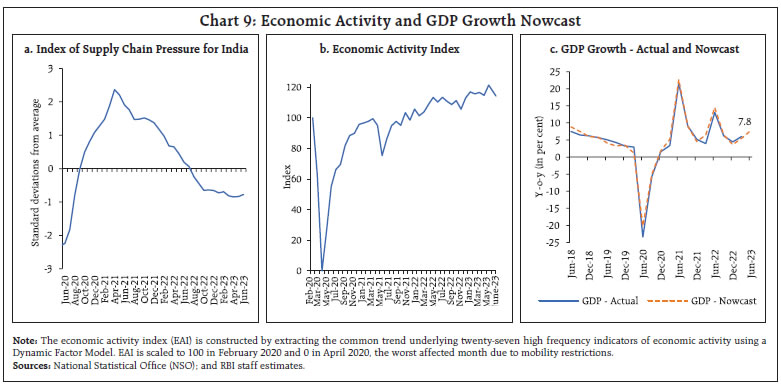 The index of supply chain pressure for India (ISPI) remains below its historical average, supporting growth impulses (Chart 9a). Our economic activity index (EAI) nowcasts GDP growth for Q1:2023-24 at 7.8 per cent (Chart 9b and 9c). Aggregate Demand Among lead indicators of demand conditions, E-way bill volumes marked double-digit y-o-y growth, pointing towards strong trade and transportation activity (Chart 10a). Despite a sequential moderation, toll collections in June 2023 recorded the highest-ever value of transactions for the month of June (Chart 10b). 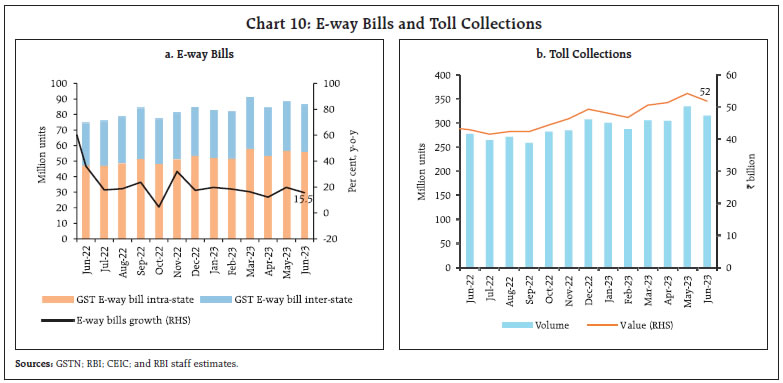 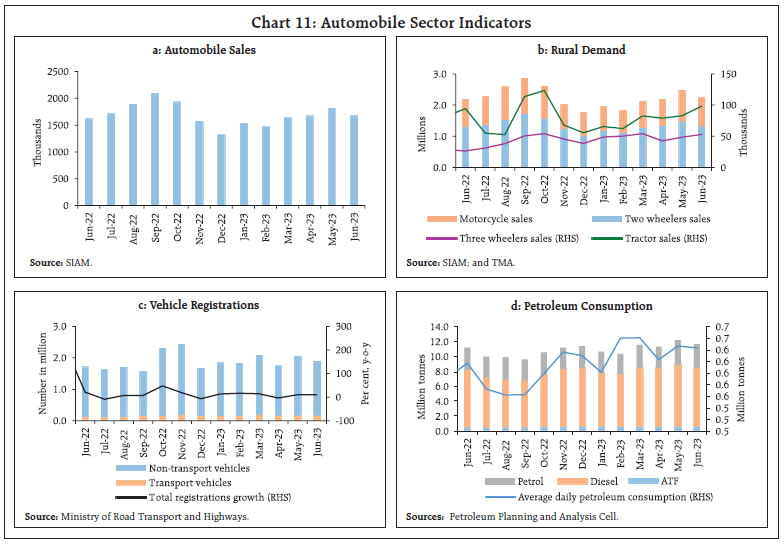 Automobile sales (wholesale) recorded a y-o-y growth of 3.3 per cent in June 2023 with multi-utility vehicle segment driving the demand for passenger vehicles (Chart 11a). Three-wheeler sales in June 2023 almost doubled over last year and tractor sales were at an eight-month high (Chart 11b). Retail sales, as reflected in vehicle registrations increased by 9.5 per cent (y-o-y) in June (Chart 11c). Two-wheeler sales also registered a growth despite the Electronic Vehicles (EV) segment recording a decline, following the reduction of subsidy under the FAME-II scheme. The daily average consumption of petroleum products decreased by 0.5 per cent m-o-m in June, led by lower demand for transportation fuels as monsoon reduced mobility (Chart 11d). The all-India unemployment rate (UR)11 edged up to 8.5 per cent in June 2023 on account of higher UR in rural areas (Chart 12a). While the labour force participation rate (LFPR) improved sequentially, the employment rate (ER) recorded a marginal decline (Chart 12b). The employment outlook in the organised sector, as polled by the purchasing managers’ index (PMI) for manufacturing and services, remained in expansionary zone (Chart 13). 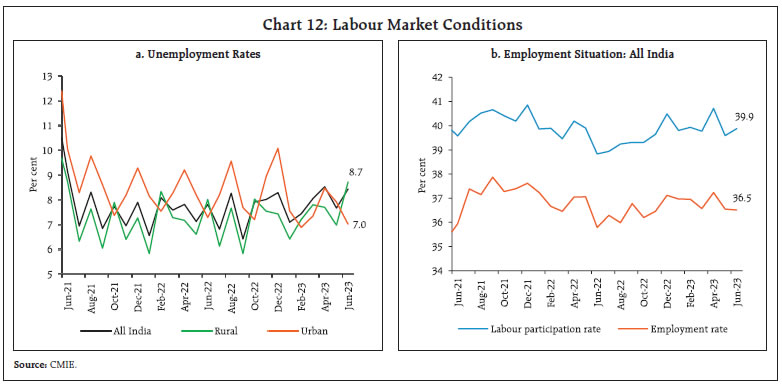 The demand for work under the Mahatma Gandhi National Rural Employment Guarantee Scheme (MGNREGS) showed an uptick in June, reflecting the sluggish progress of kharif sowing on account of the late arrival and uneven spread of the south-west monsoon (SWM) [Chart 14]. 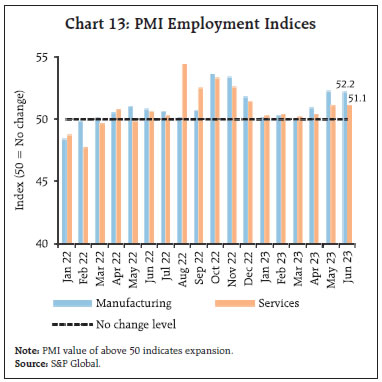 India’s merchandise exports registered contraction for the fifth consecutive month in June 2023, declining by 22.0 per cent (y-o-y) as a sharp negative momentum of (-) 5.8 per cent interacted with an adverse base (Chart 15). The contraction in exports was broad-based, with 77.5 per cent of the export basket (21 out of 30 major commodities) registering a decline on a y-o-y basis 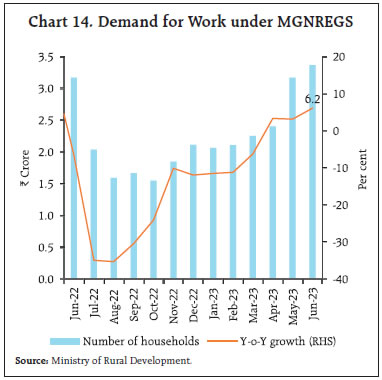 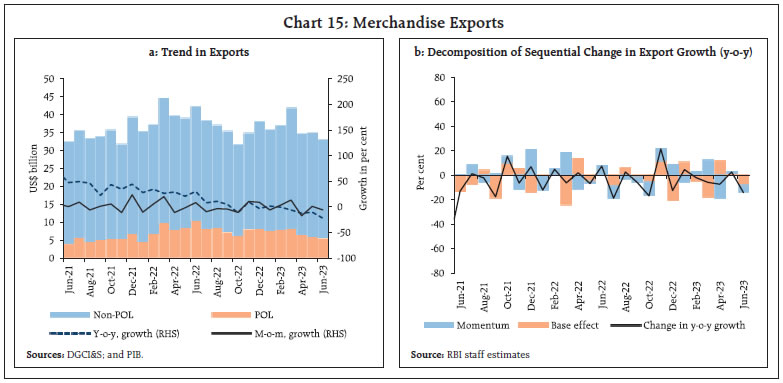 The largest drag on growth was from petroleum products, followed by gems and jewellery. Amidst the overall decline, electronic goods, which account for 7.4 per cent of total merchandise exports, remained positive contributors to export growth (Chart 16). 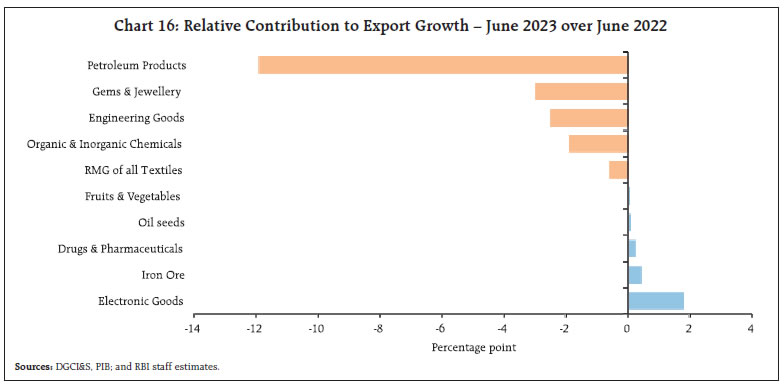 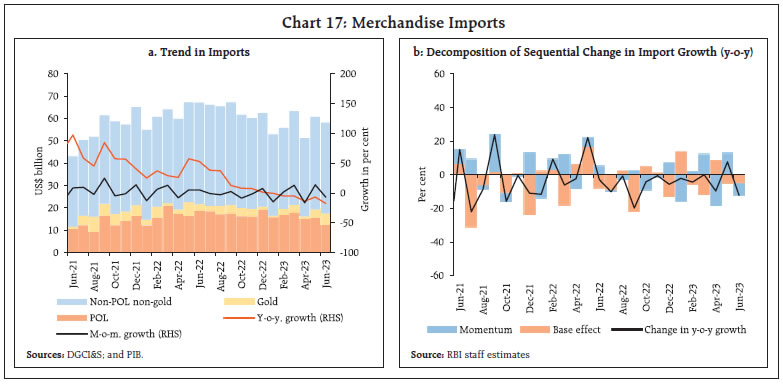 Merchandise imports declined for the sixth consecutive month to US$ 53.1 billion in June 2023, registering a decline of 17.5 per cent (y-o-y) [Chart 17]. The contraction was broad-based, with nearly 66.2 per cent of the import basket (21 out of 30 major commodities) registering a decline on a y-o-y basis. Petroleum, oil, and lubricants (POL), coal, and chemicals dragged down import growth; gold, electronic goods, and pulses, however, contributed positively to import growth (Chart 18). The deficit on account of oil trade decreased by US$ 2.7 billion due to POL imports witnessing higher sequential contraction relative to exports. The share of oil in the total trade deficit fell to 34.7 per cent in June 2023 due to a sharper decline in non-oil exports relative to non-oil imports (Chart 19). 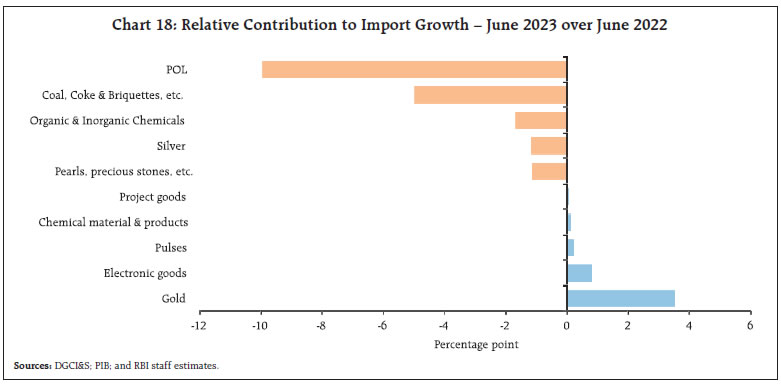 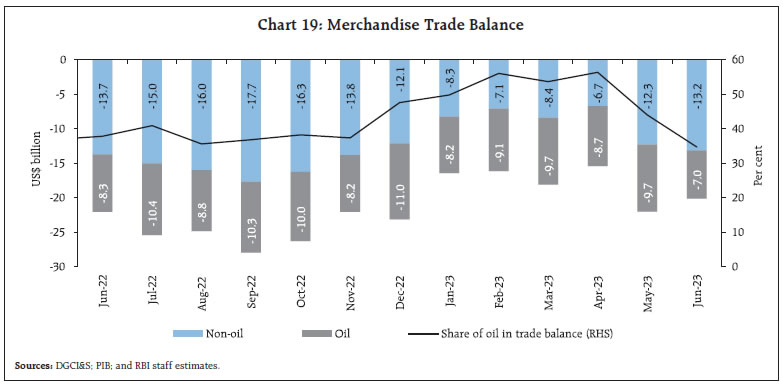 The India-UAE Comprehensive Economic Partnership Agreement (CEPA) came into effect on May 1, 2022. In the year since the agreement came into force (between May 2022 and April 2023), the bilateral trade in goods between the two countries increased to US$ 82.6 billion from US$ 75.2 billion in the corresponding period a year ago (Chart 20). Exports to the UAE grew by 6.5 per cent during this period, as against India’s overall merchandise export growth of 3.5 per cent. Imports from the UAE, however, grew by 12.2 per cent, lower than India’s overall merchandise import growth of 13.0 per cent. 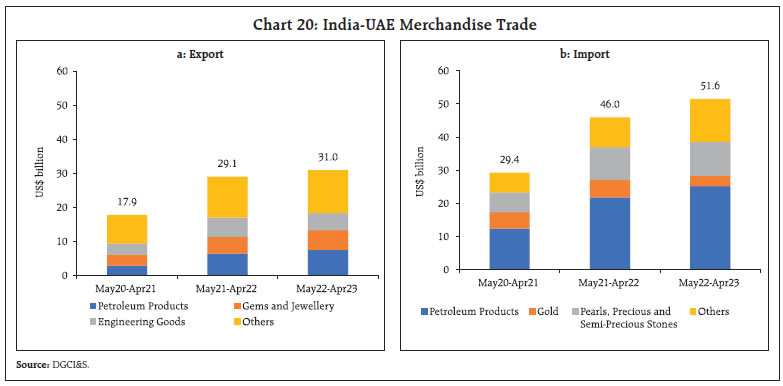 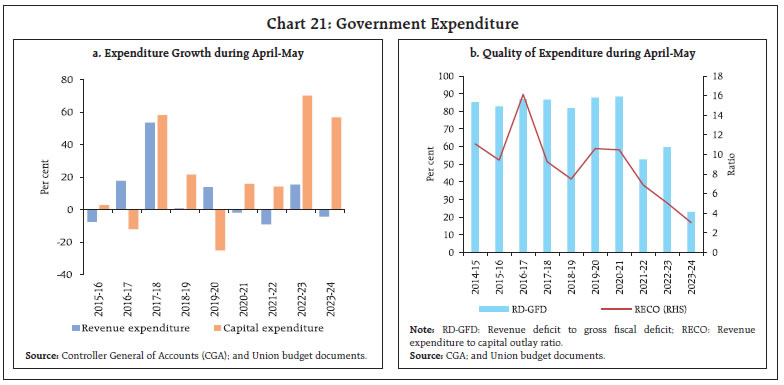 As per the latest data released by the Controller General of Accounts (CGA), the gross fiscal deficit (GFD) of the central government during April-May 2023 stood at 11.8 per cent of the budget estimates (BE) for 2023-24, which was lower than in the corresponding period of the previous year. This improvement is attributable to higher collections under non-tax receipts. On the other hand, the total expenditure of the central government increased by 6.9 per cent on a y-o-y basis. A noteworthy feature is the continued thrust on capital outlay with a y-o-y growth of 58.8 per cent. On the other hand, revenue expenditure contracted by 4.3 per cent. This led to a marked improvement in the quality of spending of the central government (Chart 21a and 21b). On the receipts side, direct tax collections contracted by 5.0 per cent, owing to a decline in corporate tax receipts by 28 per cent. Indirect taxes recorded a moderation in growth to 1.6 per cent, attributable to a reduction in excise duty collections by 16.3 per cent12. Net tax collections contracted by 9.6 per cent over their level a year ago (Chart 22). 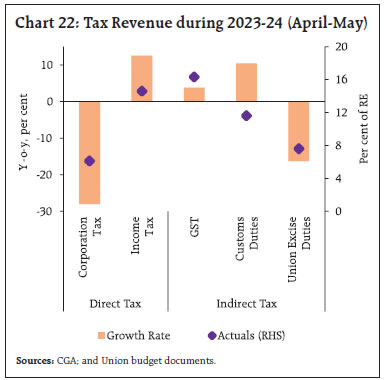 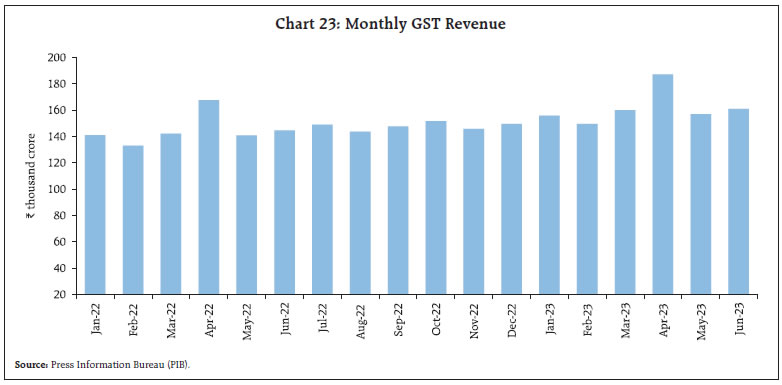 Conversely, non-tax revenue collections of the central government recorded a y-o-y growth of 173.4 per cent on the back of higher surplus transfer by the Reserve Bank. Non-debt capital receipts contracted by 88.0 per cent vis-à-vis the corresponding period of the previous year on account of slower pace of disinvestment.13 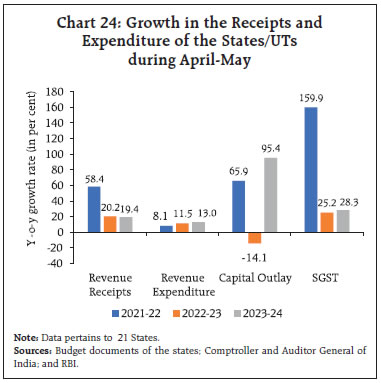 GST collections (Centre plus States) stood at ₹1.6 lakh crore in June 2023, registering a year-on-year growth of 11.7 per cent. The consistent rise in GST collections in the recent past is indicative of the improvement in the GST compliance rate, increasing momentum of underlying economic activity as well as the stabilisation of the GST regime (Chart 23). As per the data available for 21 States, the growth in their revenue receipts remained robust during April-May 2023, driven by buoyant growth in SGST collections. States have accelerated spending on capital outlay (Chart 24). In the month of June, the Union Government released an additional instalment of tax devolution to states. Apart from front-loading its own capital spending14 in 2023-24, the central government has also approved ₹56,415 crore (accounting for 43.4 per cent of the ₹1.3 lakh crore budgeted for 2023-24) to 16 States for capital investment under the scheme of Special Assistance to States for Capital Investment 2023-24 with the objective of providing a boost to their capital spending. 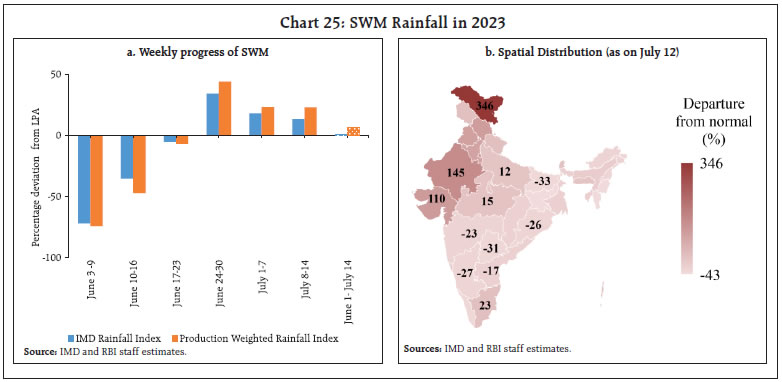 Aggregate Supply The South-west monsoon (SWM) covered the entire country on July 02, 2023 six days before the normal date, even though its onset was delayed by eight days – SWM touched the Kerala coast on June 08 as against June 04 predicted by the India Meteorological Department (IMD). The progress of SWM has, however, been uneven partly on account of the impact of cyclone Biparjoy. Precipitation picked up in recent weeks and as per the latest data as of July 14, 2023 the cumulative monsoon was one per cent above the long period average (LPA) [Chart 25a]. The spatial distribution of rainfall remains skewed (Chart 25b). As on July 09, 2023 the total kharif sown area was 5.4 per cent lower than the previous year’s level across all major crop categories, except sugarcane and coarse cereals (Chart 26). The current reservoir storage levels are much above long period averages, which augurs well for ongoing sowing activity (Chart 27). 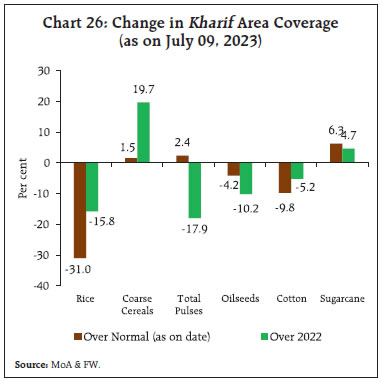 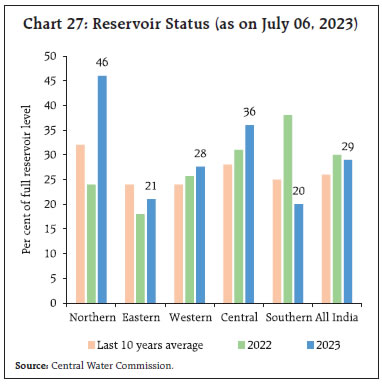 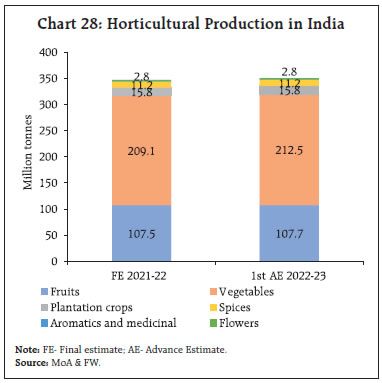 The horticulture sector, accounting for about 33 per cent of total agriculture gross value added (GVA) in India, continued to register record production as per the first advance estimates (1st AE) for 2022-23. Total horticultural production surpassed last year’s final production estimate by 1.1 per cent, driven by vegetables (Chart 28). Rice procurement in the Kharif Marketing Season (KMS) 2022-23 and wheat procurement in the Rabi Marketing Season (RMS) 2023-24 touched 56.8 million tonnes and 26.2 million tonnes, respectively on July 11, 2023. In order to alleviate retail price pressures, the Food Corporation of India (FCI) has been conducting e-auctions for rice and wheat under the Open Market Sale Scheme (Domestic); and the third weekly e-auctions for rice and wheat commenced on July 12, 2023.15 The headline PMI for the manufacturing sector moderated to 57.8 in June 2023 from 58.7 in May due to a deceleration in new orders, output, and stocks of purchases. Index of future output expanded to a six-month high of 65.8 in June 2023 (Chart 29a). The PMI services in expansionary zone, despite a sequential moderation, with a strong momentum in business expectations (Chart 29b). 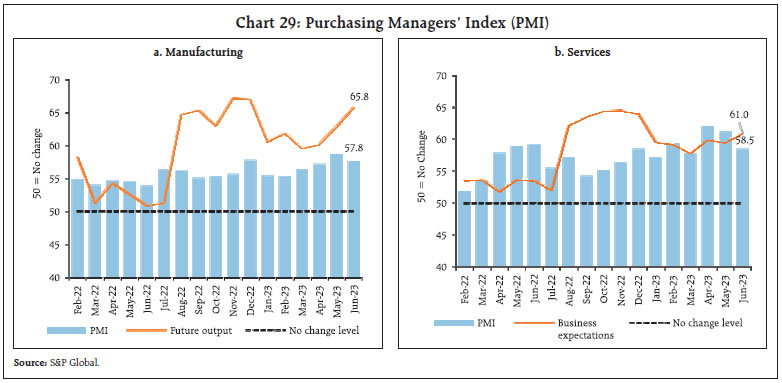 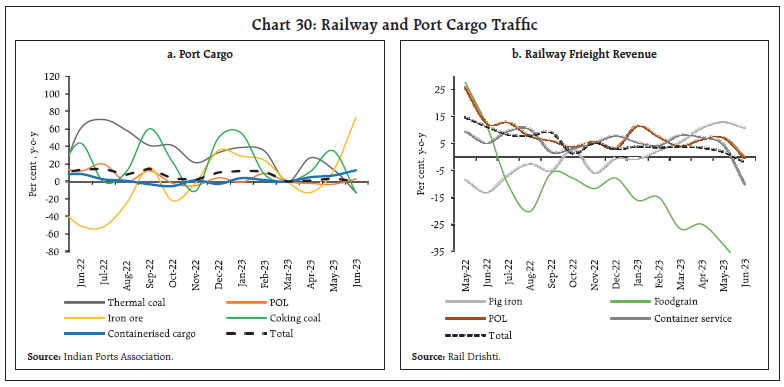 Transport indicators indicated a mixed picture. Cargo traffic at major ports recorded a marginal uptick in June driven by surge in iron ore and raw fertiliser (Chart 30a). However, railway freight traffic fell in June due to a decrease in freight of food grains and containerised cargo (Chart 30b). 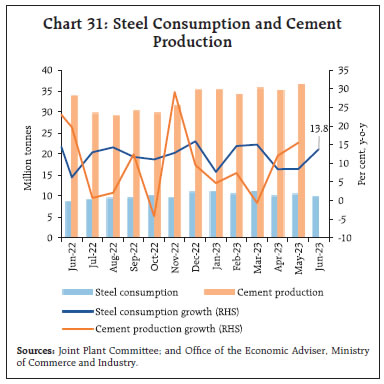 Coincident indicators of the construction sector remained buoyant (Chart 31). High-frequency services sector indicators for June 2023 attest to the resilience of overall economic activity. Notably, both domestic and international aviation passenger traffic recorded growth in excess of 20 per cent (Table 1). In terms of regional policy initiatives, Odisha has approved a novel ‘Odisha Rural-Urban Transition Policy’, which aims to bridge the rural-urban gap by providing essential urban infrastructure, amenities and services to all citizens residing in the fast-growing rural areas adjoining cities. Tamil Nadu has launched a web portal named ‘Tamil Man Valam’ that aims to serve as a facilitator for farmers to assess the soil fertility status, obtain soil health cards and also access various schemes designed to augment foodgrain production. Maharashtra became the first state to launch a “Green Hydrogen Policy” to promote renewable energy and green hydrogen projects. Haryana has taken a noteworthy stride to foster accountability and ensure timely completion of infrastructure projects. The ‘Haryana Project Monitoring System (HPMS)’ portal serves as a platform for uploading progress of projects on an interactive dashboard within the initial weeks of each month. 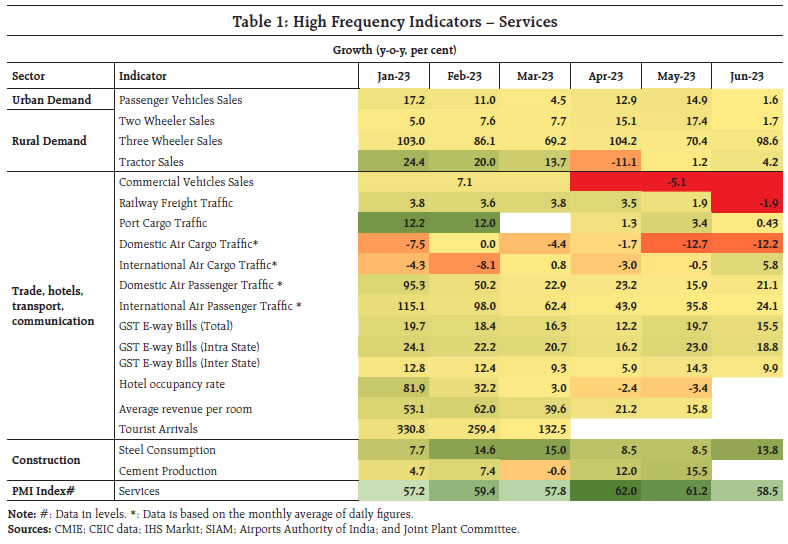 Inflation Headline inflation, as measured by y-o-y changes in the all-India consumer price index (CPI)16, increased to 4.8 per cent in June 2023 from 4.3 per cent in May primarily on account of an increase in food inflation (Chart 32). Between May and June, the CPI recorded a possitive momentum of 100 bps, which was partially offset by a favourable base effect of around 50 bps, resulting in a rise in headline inflation by 50 bps. The m-o-m increase in food and fuel prices were around 220 bps and 5 bps, respectively. Core group (excluding food and fuel) prices remained broadly unchanged. Food inflation increased to 4.6 per cent in June from 3.3 per cent in May as inflation in sub-groups such as spices and pulses witnessed a spike. Despite a m-o-m increase in prices by 12.2 per cent, y-o-y inflation in vegetables remained in negative territory. Deflation in edible oils also deepened. Inflation in cereals remained elevated (Chart 33). 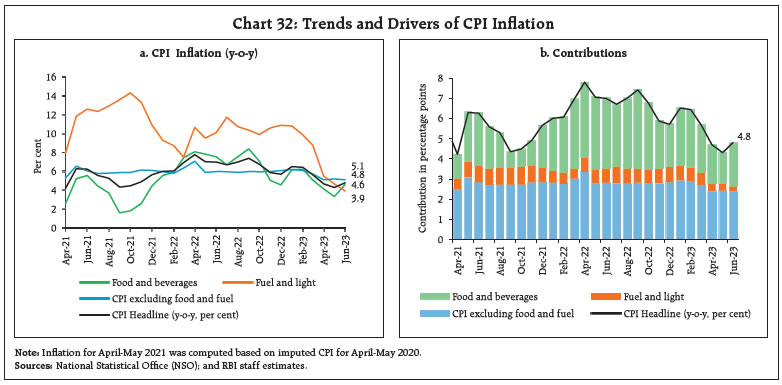 Inflation in the fuel and light group softened to 3.9 per cent in June from 4.6 per cent in May, mainly driven by steep deflation in kerosene (PDS) prices. Inflation in LPG moderated further. Electricity prices, however, increased sharply (206 bps m-o-m).  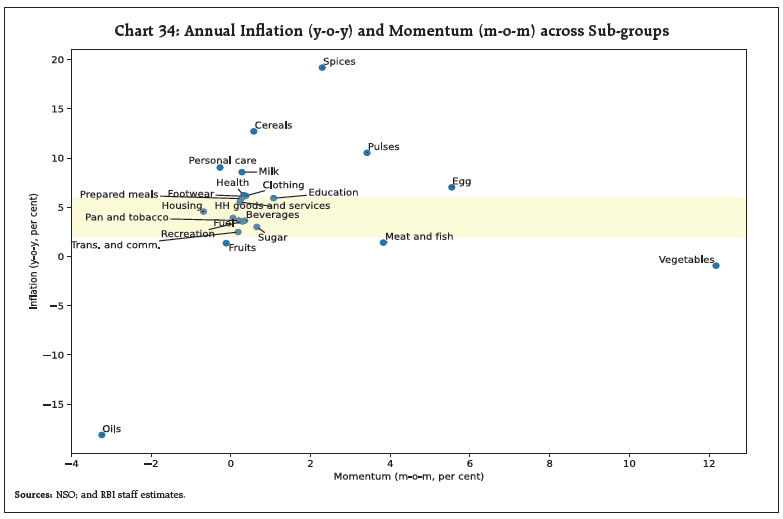 Core inflation declined marginally to 5.1 per cent in June from 5.2 per cent in May. While inflation in most of the constituents of the core group softened, it remained steady for health and increased in the case of transport and communication, and education (Chart 34). In terms of regional distribution, rural inflation at 4.7 per cent was marginally lower than urban inflation (5.0 per cent) in June 2023. Majority of the states registered inflation in the range of 4 to 6 per cent (Chart 35). 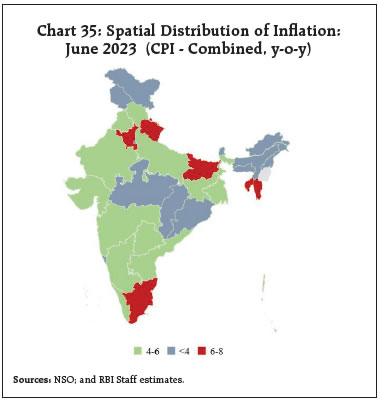 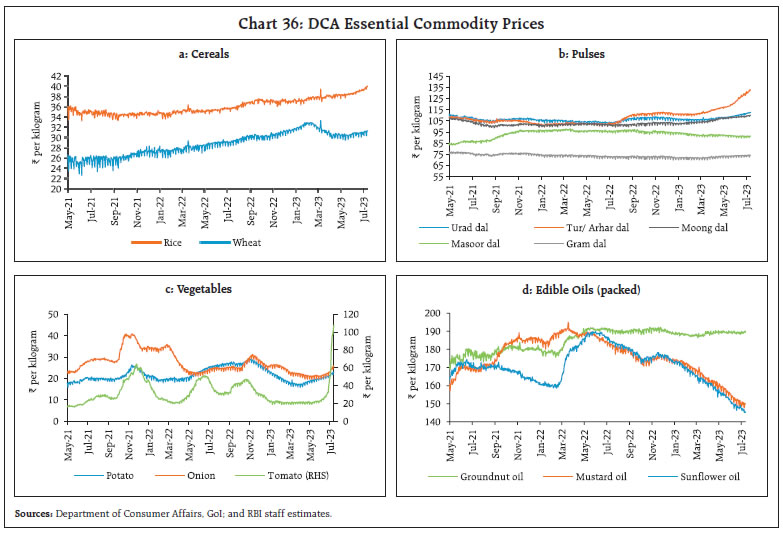 High frequency food price data for July so far (up to 12th) point to a sustained increase in cereal prices (Chart 36). Prices of pulses and vegetables recorded a general uptick with tomato prices registering the maximum increase (Box 1). Edible oil prices continued to slide down in line with the fall in global prices. Retail selling prices of petrol and diesel in the four major metros remained steady in July so far (up to 12th). While kerosene prices increased slightly, LPG prices remained unchanged (Table 2). The PMIs for June 2023 indicated an increase in input costs in the manufacturing sector while they moderated for services sector. Selling prices, however, edged up further (Chart 37). 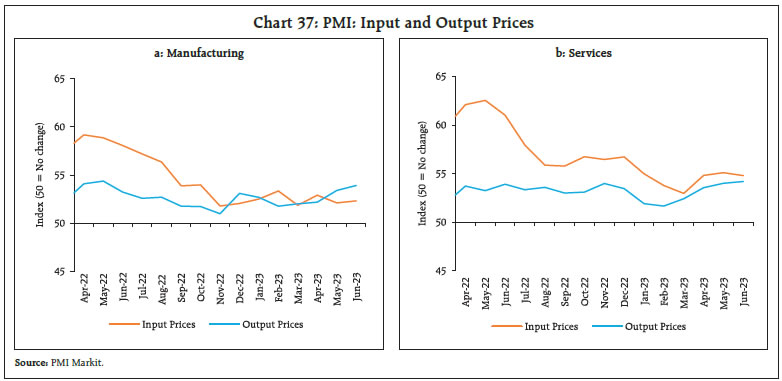
During the second half of June 2023 and early July (up to July 12, 2023), developments in liquidity conditions largely mirrored Government spending – a key driver of frictional liquidity. Advance tax payments and GST related outflows moderated surplus liquidity in the second half of June, though the seasonal return of currency to the banking system ameliorated some of the pressure. The Reserve Bank also conducted one variable rate repo (VRR) fine tuning operation on June 19 to inject liquidity amounting to ₹75,004 crore to the banking system (offers received were ₹75,695 crore). Subsequently, Government spending in the beginning of July augmented surplus liquidity in the banking system. Volatile liquidity conditions have induced some aversion among banks to park surplus funds for longer tenors. Illustratively, while the response to the 14-day variable rate reverse repo (VRRR) (main operation) conducted on June 30 was tepid, with offers received amounting to a mere ₹11,789 crore (notified amount of ₹1.0 lakh crore), six-fine tuning VRRR operations of 1-4 days maturity conducted in July evoked more interest. The liquidity absorbed through these operations amounted to ₹63,843 crore (July 3), ₹67,295 crore (July 4), ₹87,870 crore (July 5), ₹39,000 crore (July 6), ₹1.06 lakh crore (July 7) and ₹40,291 crore (July 11).18 Overall, the average total absorption under the liquidity adjustment facility (LAF) narrowed to ₹1.6 lakh crore during June 16-July 12 (from ₹1.8 lakh crore during May 16 to June 15). Of the total average surplus liquidity, placement of funds under the standing deposit facility (SDF) averaged ₹1.1 lakh crore during June 16 to July 12, 2023, down from ₹1.4 lakh crore during the previous period (May 16 to June 15, 2023). Amidst tapering of surplus liquidity and its skewed distribution, recourse to the marginal standing facility (MSF) averaged ₹17000 crore during June 16 to July 12, 2023 (₹2000 crore during the previous period) and the daily MSF reached ₹85,821 crore on June 29, 2023 – the highest since April 1, 2019. Consequently, net absorptions under the LAF declined to ₹1.19 lakh crore during June 16 to July 12, 2023 as compared with ₹1.45 lakh crore during May 16 to June 15, 2023 (Chart 38). 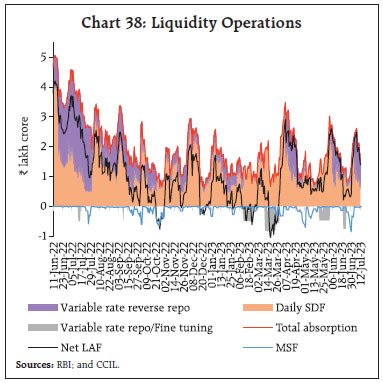 Reflecting the shifting liquidity dynamics, the weighted average call rate (WACR) gradually trended towards the upper band of the LAF corridor during the second half of June before easing sharply in the first week of July. On an average basis, the WACR traded 6 bps above the policy repo rate while the triparty repo rate and the market repo rate traded 2 bps and 5 bps, respectively, below the policy repo rate during June 16 to July 12, 2023 (Chart 39a). Across the term money segment, yields on 3-month certificates of deposit (CDs) and commercial paper (CP) for non-banking financial companies (NBFCs) remained above the upper band of the corridor, but largely stable. The yield on 3-month treasury bills (T-bills) was broadly aligned with the MSF rate (Chart 39b). In the primary market, fund mobilisation through issuances of CDs at ₹1.45 lakh crore during 2023-24 (up to June 30) was lower than ₹1.54 lakh crore in the corresponding period of the previous year. CP issuances at ₹3.80 lakh crore (up to June 30), however, was higher than ₹3.48 lakh crore in the corresponding period of the previous year. 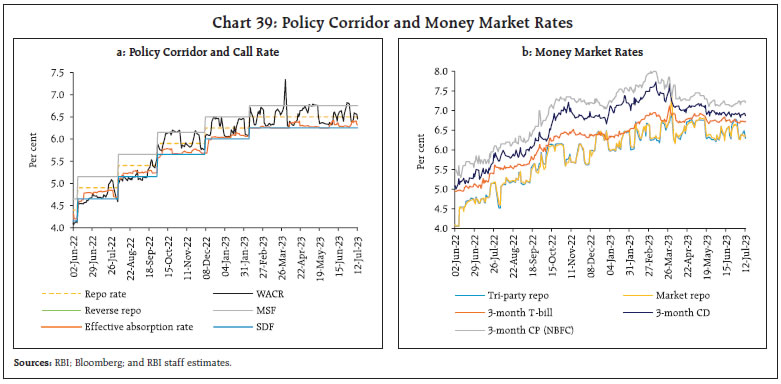 Domestic bond yields traded with a hardening bias and the yield on the 10-year benchmark Government securities (G-sec) (7.26 per cent GS 2033) closed at 7.12 per cent on July 12, 2023 as compared with 7.04 per cent on June 15 (Chart 40a). Stronger than expected US GDP data and a sharp rise in US treasury yields imparted pressure on domestic bond yields across the term structure (Chart 40b). Corporate bond yields also hardened during this period, though the risk premia exhibited a mixed trend. The average risk premia in the bond market (5-year AAA minus 5 year G-sec) declined by 7 bps (Table 3). Funds mobilised through corporate bond issuances amounted to ₹0.84 lakh crore during May 2023, significantly higher than ₹0.18 lakh crore for the same period in the preceding year. Reserve money (RM), excluding the first-round impact of change in cash reserve ratio (CRR), grew by 6.6 per cent on a y-o-y basis as on July 07, 2023 (8.8 per cent a year ago) [Chart 41a]. Currency in circulation (CiC), the largest component of RM, decelerated to 4.4 per cent from 8.0 per cent a year ago. The withdrawal of ₹2000 banknotes from circulation announced on May 19, 2023 (20th week) resulted in a decline in CiC between 20th (May 19) and 26th week (June 30) in 2023 when compared with the corresponding period of previous years. About 87 per cent of the notes received back from circulation as on June 30 has been deposited with the banks (Chart 41b). 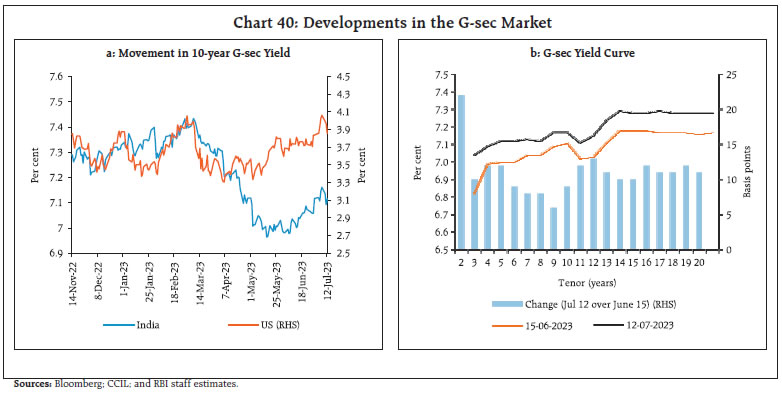 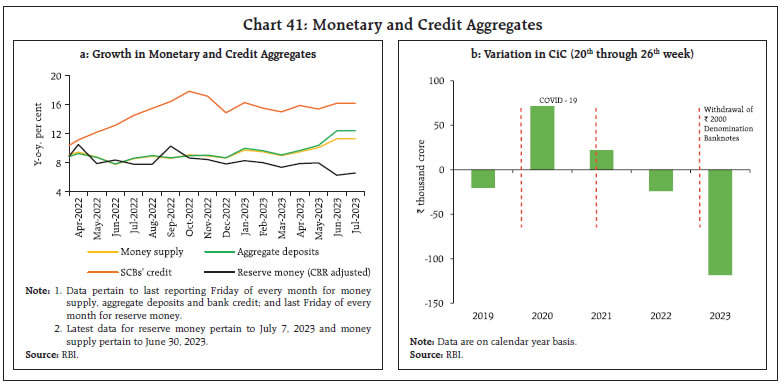 As on June 30, 2023 money supply (M3) growth was higher at 11.3 per cent (y-o-y) than 8.9 per cent in the corresponding period of last year. Aggregate deposits with banks increased by 12.4 per cent (9.2 per cent a year ago). Reflecting the return of ₹2,000 banknotes, the currency to aggregate deposit ratio declined and correspondingly, the money multiplier increased (Chart 42). Scheduled commercial banks’ (SCBs’) credit growth remained strong at 16.2 per cent as on June 30, 2023. The rapid pace of personal loan growth (both housing and non-housing) has been supporting overall credit expansion (Chart 43). Accordingly, the share of personal loans in total bank credit has surged to 28 per cent in 2022-23 from 21 per cent in 2017-18. 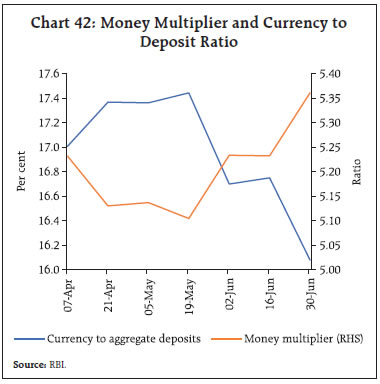 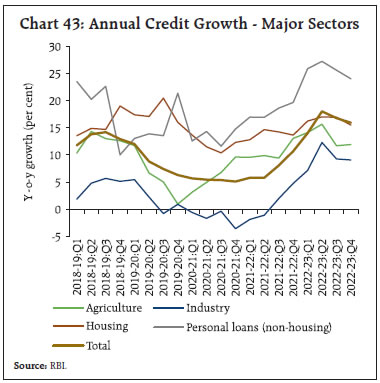 The decomposition of y-o-y deposit growth of SCBs shows that strong momentum offset unfavourable base effects in recent months (Chart 44). 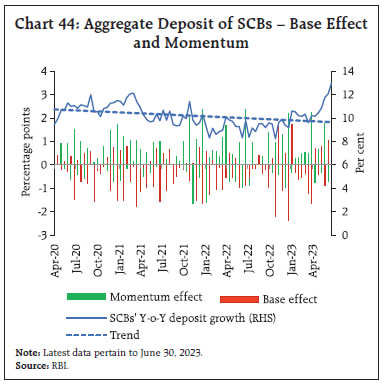 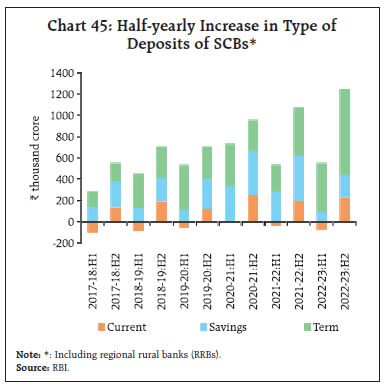 Term deposit growth far exceeded growth in saving deposits (Chart 45), atypical of the patterns observed during 2020-21 and 2021-22. In response to the 250 bps hike in the policy repo rate since May 2022, banks have revised their repo-linked external benchmark-based lending rates (EBLRs) upwards by a similar magnitude. The 1-year median MCLR of SCBs increased by 142 bps during May 2022-May 2023. Consequently, the weighted average lending rate (WALR) on fresh and outstanding rupee loans increased by 176 bps and 106 bps, respectively, during the same period. On the deposit side, the weighted average domestic term deposit rates (WADTDR) on fresh and outstanding rupee deposits increased to 229 bps and 134 bps, respectively (Table 4). The share of EBLR-linked loans in total outstanding floating rate rupee loans of SCBs was 49.6 per cent at end-March 2023 while that of MCLR-linked loans was 45.5 per cent. The increases in the WADTDR on fresh rupee deposits and WALR on fresh rupee loans were higher in the case of public sector banks, while the WADTDR on outstanding deposits and WALR on outstanding loans were higher for private banks (Chart 46). In March 2023, over two-thirds of the bank loans were priced below 10 per cent of which 46 per cent were priced between 8 and 10 per cent and another 21 were priced below 8 per cent (Chart 47). The improvement in transmission is starkly visible in loans priced at 8 per cent or above since March 2022. On June 30, 2023 the Government of India revised rates on select small savings instruments, namely, post office term deposits of 1 and 2-year tenor and recurring deposits, upwards by 10-30 bps for Q2:2023-24 (Chart 48). 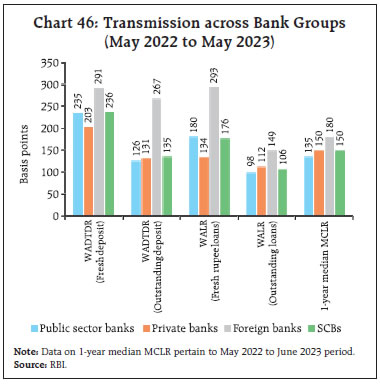 Equity markets remained ebullient, scaling an all-time peak towards end-June (Chart 49). Strong macroeconomic data releases, a pause in the policy repo rate hike cycle as well as the merger of a major Indian private sector bank helped boost market sentiments. The exuberance of the secondary markets also translated into increased resource mobilisation in the primary markets. Initial public offering (IPO) listings increased from ₹1558.5 crore in Q4:2022-23 to ₹6880.6 crore in Q1:2023-24. The positive momentum continued in July with strong GST collections and optimism surrounding corporate earnings for Q1:2023-24 leading to market gains. The BSE Sensex gained 3,439 points (5.49 per cent) since end-May 2023 to close at 66,061 points on July 14, 2023. 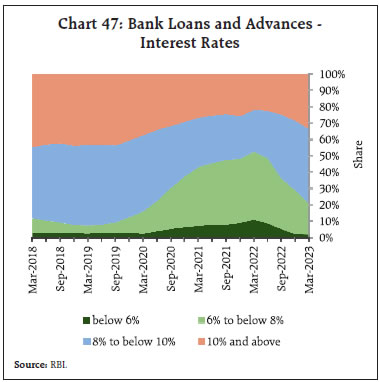 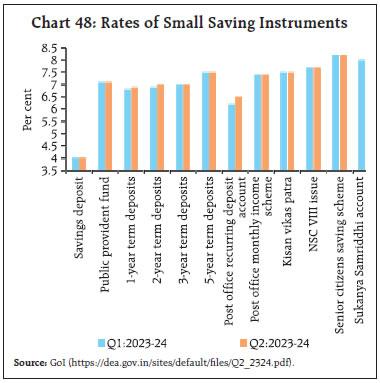 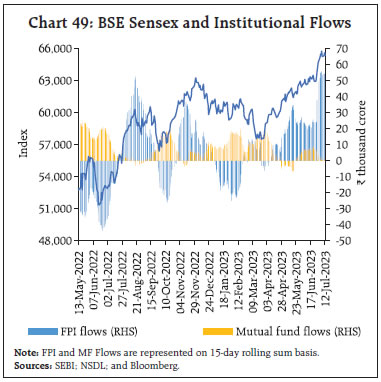 The shifting of trade from the Singapore Exchange (SGX) to the NSE International Exchange (NSE IX) and the rebranding of SGX Nifty as Gift Nifty have opened Indian capital markets to higher international exposure by creating a financial corridor. The deal between the exchanges led to a US$ 9.1 billion open interest in NSE futures and options combined on the first day in the Gift city with NSE handling the trades and SGX clearing and settling the trades. 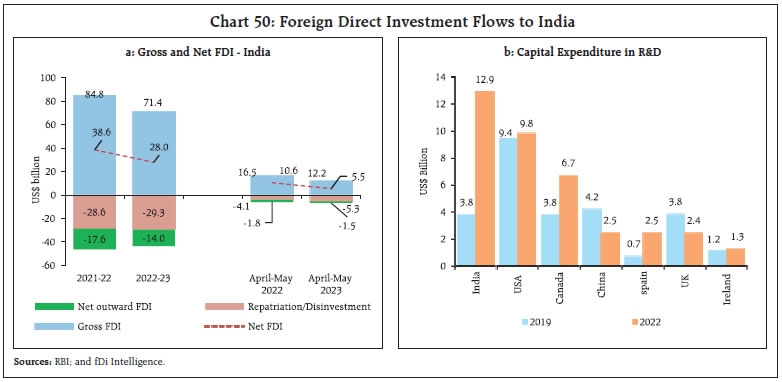 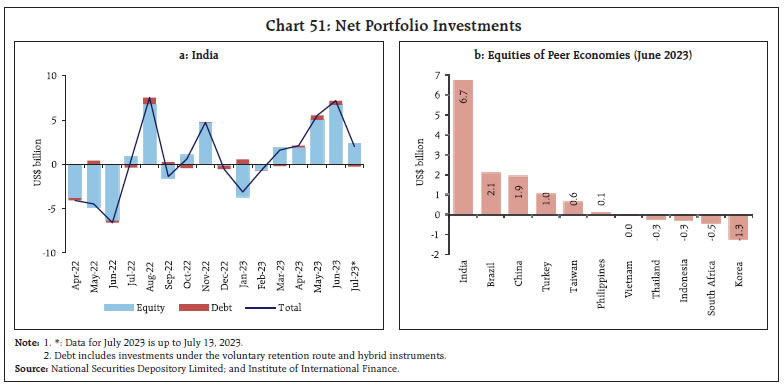 Gross inward foreign direct investment (FDI) flows, albeit strong, moderated to US$ 12.2 billion in April-May 2023, from US$ 16.5 billion in April-May 2022 (Chart 50a). Net FDI declined to US$ 5.5 billion in April-May 2023 from US$ 10.6 billion a year ago. Manufacturing, business services and financial services attracted the majority of FDI inflows in April-May 2023, while Singapore, the Netherlands and the US were major source countries for FDI during the month. According to a report released by the fDi Intelligence19, India recorded US$ 12.9 billion of estimated capital expenditure in research and development (R&D) in 2022, as compared with an investment of US$ 3.8 billion during 2019 (Chart 50b). FPI flows recorded a ten-month high in June 2023 with India attracting the maximum FPI equity inflows among emerging market peers (Chart 51). The surge in external commercial borrowing (ECB) registrations during Q1:2023-24 reflects the momentum in import demand for capital goods. The loan agreement amount stood at nearly 80 per cent of the level registered in 2022-23 as a whole (Chart 52). Nearly two-third of new ECBs were earmarked for modernisation / new projects / infrastructure development and import / local sourcing of capital goods (Chart 53). 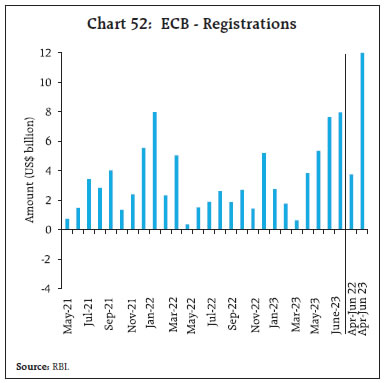 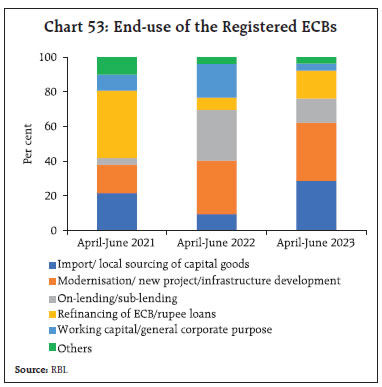 The foreign exchange reserves increased by US$ 71.8 billion since October 21, 2022 and stood at US$ 596.3 billion on July 7, 2023 sufficient to cover 9.7 months of projected imports for 2023-24 or 95 per cent of total external debt outstanding at end-March 2023 (Chart 54a). India recorded the second highest accretion to foreign exchange reserves among major holding countries during 2023 (Chart 54b). The Indian rupee (INR) appreciated by 0.1 per cent (m-o-m) vis-à-vis the US dollar in June 2023, as against depreciation undergone by most major currencies (Chart 55). The INR appreciated by 2.3 per cent (m-o-m) in terms of the 40-currency real effective exchange rate (REER) in June 2023 (Chart 56). Net claims of non-residents on India [i.e., net international investment position (IIP)] declined by US$ 5.7 billion during Q4:2022-23 and stood at US$ 367.8 billion in March 2023 (Chart 57). Reserve assets accounted for 64.1 per cent of Indian residents’ overseas financial assets and its ratio to external debt improved for the second successive quarter to 92.5 per cent in March 2023. 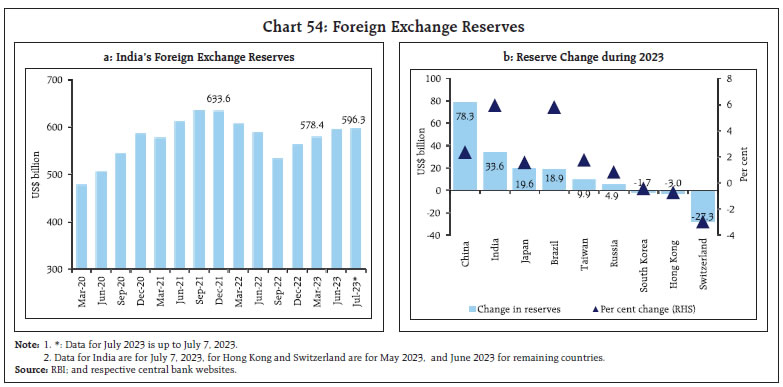 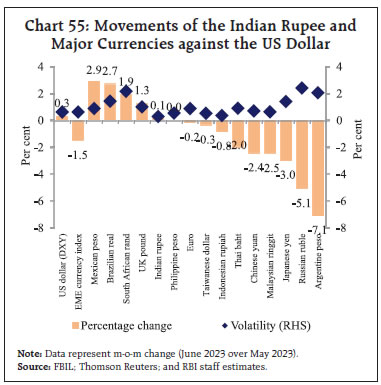 As pointed out in the intro section, key indicators of external sector vulnerability remained at sustainable levels at end-March 2023 (Chart 58a). These indicators also suggest that India’s external sector is more resilient than most other comparable economies (Chart 58b). Payment Systems Digital transactions exhibited consistent growth (y-o-y) across various payment modes in June (Table 5). The volume of transactions through the National Automated Clearing House (NACH) recovered, owing to an increase in direct benefit transfers using Aadhaar Payment Bridge System (APBS). Among prepaid payment instruments, wallets continue to gain in share over cards. The growing spread of online spending beyond tier-1 centres in the country is expected to further bolster the adoption of digital payments.20 On July 06, 2023 the Reserve Bank issued a draft circular that mandates card issuers (banks/non-banks) to issue cards on more than one card network, along with providing customers the facility to choose any one among multiple card networks. 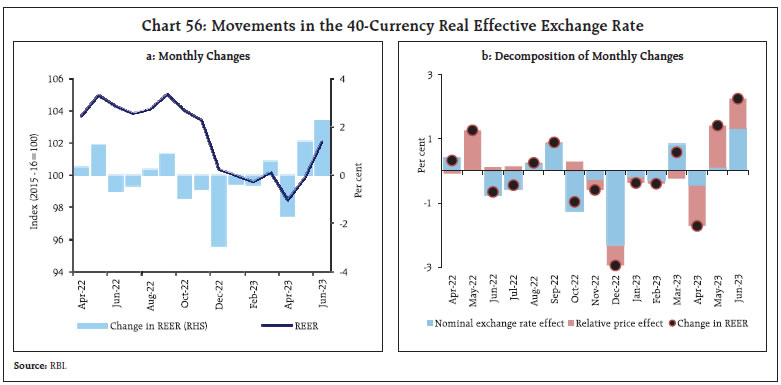 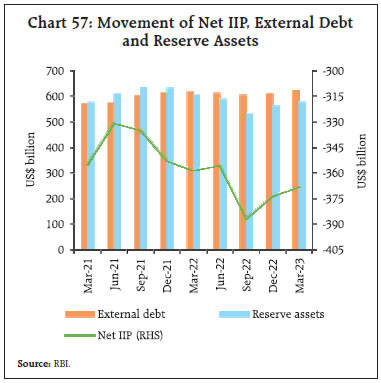 Driven by the success of India’s digital public infrastructure (DPI) – India Stack – the digitalisation of financial services is on the rise. The account aggregator ecosystem, which enables secure and convenient data exchange facilitating further access to financial products and services, exhibited strong growth in its adoption and usage. The number of newly linked accounts and consent requests received grew more than ten-fold in June 2023 compared with June 2022. Additionally, the number of successful e-KYC authentications through Aadhar grew by 38 per cent (y-o-y) in June. India has also entered into Memorandums of Understanding (MoU) with four countries – Armenia; Sierra Leone; Suriname; and Antigua and Barbuda; for the purpose of sharing the India Stack.21 As macroeconomic prospects steadily improve, India is dynamically seeking fuller expression of its full potential and a transformative change in its global position. Being the most populous and aspirational nation, and an eminently influential diaspora that is the world’s biggest are regarded as powerful resources today rather than a Malthusian drag.22 India’s labour force is expected to account for a full percentage point of annual GDP growth over the next five years23. 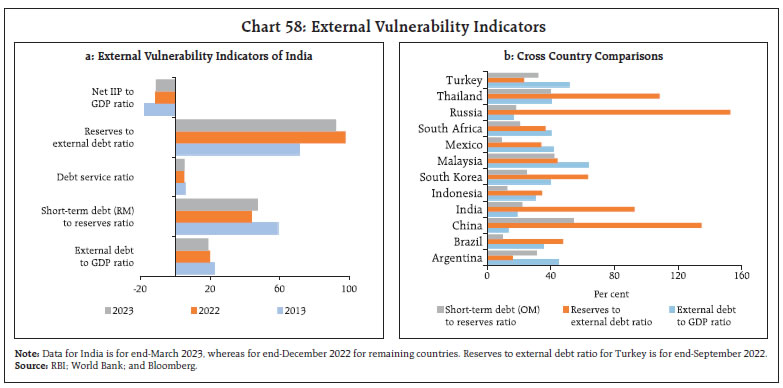 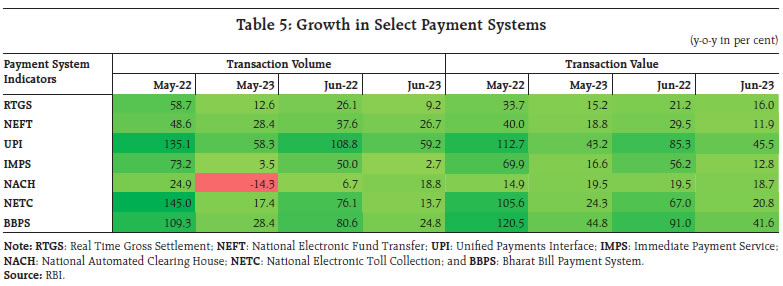 It is believed that ‘India is at a tipping point’24 in the fulfilment of its aspirations. Set to become the second largest economy of the world within this century even at current growth rates25 and even perhaps to match the dominant position in the world economy that it enjoyed in 1700 AD before the colonial invasions, India is rapidly upgrading its infrastructure to global standards. Its road network has expanded above 6 million kilometres, with some of the best airports in the world, a digital public infrastructure gaining global recognition that fosters both inclusion and innovation, accretions to solar generating capacity planned in 2023 that may rival world leaders in the field. India is already the seventh largest exporter of services in the world and is rapidly diversifying beyond IT into new fields, with global capability centres providing a leading edge. A giant leap of digitalisation that is already opening up exciting new opportunities for enhancing productivity. Some aspects of manufacturing such as machinery, electronics and vehicles and parts are gaining international competitiveness, accounting for a fifth of merchandise exports. With focused industrial policy initiatives, India is striving to raise the share of manufacturing from 17 per cent of GDP to at least 25 per cent over a decade. Given favourable demographics, this will empower the labour force with jobs and livelihood, although boosting labour participation will require providing training and skills. Increasing worker productivity is going to be the most important lever of growth. Investment will also benefit from this demographic advantage as India’s savings rate is likely to increase with rising employment and deepening financial development. The transition to green energy is opening up large investment avenues. A window is opening up for the private sector to scale up on creating capacities in both manufacturing and services, and this opportunity must be grasped. Food price spikes typical of the onset of the monsoon drove up headline inflation in June, corroborating the monetary policy committee’s (MPC) view26 that the fight against inflation is far from over and monetary policy has to stay the course on the arduous last leg of the journey to align inflation with the target. * This article has been prepared by G. V. Nadhanael, Rajni Dahiya, Shashi Kant, Kunal Priyadarshi, Harshita Keshan, Ramesh Kumar Gupta, Pankaj Kumar, Harendra Behera, Arjit Shivhare, Harshita Yadav, Akash Kovuri, Jobin Sebastian, Shelja Bhatia, Shivam, Satyendra Kumar, Priyanka Sachdeva, Ashish S Khobragade, Dilpreet Sharma, Jitendra Sokal, Yuvraj Kashyap, Supriyo Mondal, Shubham Agnihotri, Aratrika Kundu, Rajendra Raghumanda, Vineet Kumar Srivastava, Samir Ranjan Behera, Deba Prasad Rath and Michael Debabrata Patra. Views expressed in this article are those of the authors and do not represent the views of the Reserve Bank of India. 1 https://public.wmo.int/en/media/news/preliminary-data-shows-hottest-week-record-unprecedented-sea-surface-temperatures-and 2 National Oceanic and Atmospheric Administration (NOAA). 3 Das, Shaktikanta (2023) “Governor’s Statement” Bi-monthly Monetary Policy Statement, 2023-2024, RBI. This view is also echoed in BIS Annual Report, 2023 and in the Wall Street Journal, July 9, 2023. 4,5 https://www.wsj.com/articles/as-greedflation-starts-to-fade-wageflation-creeps-in-1adb7b9c 6 ‘Three Uncomfortable Truths for Monetary Policy’ Remarks by Gita Gopinath at the ECB Forum on Central Banking, Sintra, Portugal, June 26, 2023. 8 Chand, R. and Singh, J. (2023). From Green Revolution to Amrit Kaal: Lessons and Way Forward for Indian Agriculture. NITI Working Paper 02/2023. https://www.niti.gov.in/sites/default/files/2023-07/Aggricultrue_Amritkal.pdf 9 The US Energy Information Administration (EIA), Short-term Energy Outlook, June 2023. 10 World Bank, Global Economic Prospects, June 2023. 11 As per the data compiled by Centre for Monitoring Indian Economy (CMIE). 12 The contraction in growth of excise duty collections during April-May 2023-24 over the corresponding period of the previous year is associated with the cut in excise duties (in case of petrol and diesel) by the union government on May 22, 2022. 13 During April-May 2023-24, the government mobilised ₹49.64 crore in the form of disinvestment receipts as compared with ₹24,046.41 crore during the corresponding period of the previous year. 14 During April-May 2023-24, capital outlay of the central government constituted 18.0 per cent of the 2023-24 (BE) as compared with 15.5 per cent during the corresponding period of the previous year. 15 https://pib.gov.in/PressReleasePage.aspx?PRID=1938040. 16 As per the provisional data released by the NSO on July 12, 2023. 17 Elasticity estimates are derived for Nashik Mandi, during 2016-2023 on account of data availability. 18 Four of these auctions had notified amount of ₹1 lakh crore while the auction of July 7 and July 11, 2023 had a notified amount of ₹2 lakh crore. 19 A specialist division of the Financial Times, that provides a comprehensive offering of services related to foreign direct investment. 20 CyberMedia Research. June 2023. Consumer Aspirations and E-commerce in Bharat: A Primary Survey Report. 21 Press Information Bureau. Press Releases. June 13, 2023. 22 ‘Making it as migrants, The Economist, June 12, 2023. 23 ‘The elephant in a boom’, The Economist, June 13, 2023. 24 Tim Cook, as quoted in ‘The elephant in a boom’, The Economist, June 13, 2023. 25 https://www.goldmansachs.com/intelligence/pages/how-india-could-rise-to-the-worlds-second-biggest-economy.html 26 Das, Shaktikanta (2023) “Governor’s Statement” Bi-monthly Monetary Policy Statement, 2023-2024, RBI. |

এই পৃষ্ঠাটো শ্বেয়াৰ কৰক:


ভাৰতীয় ৰিজাৰ্ভ বেংক মোবাইল এপ্পলিকেষ্যন ইনষ্টল কৰক আৰু নৱীনতম বাতৰিৰ প্ৰৱেশাধিকাৰ পাওক!
আমাৰ এপটো ইনষ্টল কৰিবলৈ QR ক’ড স্কেন কৰক


পৃষ্ঠাটো শেহতীয়া আপডেট কৰা তাৰিখ:


