
VI. Price Situation - আৰবিআই - Reserve Bank of India


VI. Price Situation
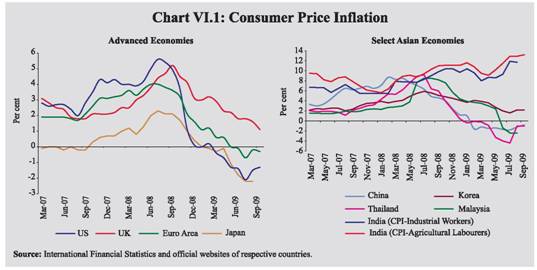
| The decline in WPI inflation from a peak of 12.9 per cent in August 2008 coincided with the moderation in economic growth, thereby creating space for the adoption of an accommodative growth supportive monetary policy stance, which has continued in 2009-10 so far. The emerging inflationary pressures are clearly visible in terms of the increase in WPI by 5.9 per cent over its end-March level as well as high and rigid CPI inflation. The changing inflation environment is being driven by high order of price increases in essential commodities, particularly in items of mass consumption like vegetables, pulses and sugar. The dominance of the food price inflation is evident from the fact that inflation in WPI (y-o-y) excluding the food category remains significantly lower at (-)3.4 per cent, as against the headline inflation of 1.2 per cent as on October 10, 2009. Given the nature of the sources of emerging inflation, sustained policy emphasis on improving both supply conditions and supply chain for distribution would be necessary. VI.1 The significant moderation in global inflation that had started with the onset of the global crisis in 2008-09, continued in 2009-10, with several advanced countries experiencing negative inflation due to sharp fall in commodity prices in the second half of 2008-09 and the sustained recession in aggregate demand. Prices of food, fuel and metal prices had bottomed in December 2008 and have been firming up moderately since then. Sluggish global demand and presence of unutilised capacity have, however, contained the risk of inflation, thereby allowing the central banks around the world to sustain the accommodative monetary policy stance to spur economic growth. VI.2 In India, inflation as measured by year-on-year variations in the wholesale price index (WPI), which had tracked the global inflation in 2008-09, declined sharply from 12.9 per cent in August 2008 to 0.8 per cent by end-March 2009. The gradual moderation, thereafter, yielded negative inflation for 13 consecutive weeks beginning in June 2009, before WPI inflation turned positive again since early September 2009. The emerging inflationary pressure is evident from the increase in WPI inflation during the current financial year over end-March 2009 by 5.9 per cent (up to October 10, 2009) and high CPI inflation in the range of 11.7-13.2 per cent in August/ September 2009. Given the weak demand as well as slowdown in economic activities, it is the supply constraints in a limited number of commodities, led by food, which have been driving the current inflation pressures. Global Inflation VI.3 After registering high levels of inflation during the first half of 2008-09, headline inflation in major advanced economies steeply declined subsequently and turned negative in 2009. Year-on-year consumer price inflation in OECD countries, which had consistently been declining up to July 2009 from its peak of 4.9 per cent in July 2008, moved up marginally in August 2009, but continued to remain negative at (-) 0.3 per cent. The recent decline in inflation in OECD countries was led by a sharp decline in CPI for energy. Amongst the major economies, headline inflation in the US, Japan and Euro Area has turned negative while in the UK, inflation has been steadily declining (Chart VI.1). Core inflation also moderated in major economies. In OECD countries, inflation, excluding food and energy, decelerated to 1.5 per cent in August 2009 from 2.4 per cent in September 2008. Producer Price Index (PPI) inflation declined sharply both in advanced as well as emerging market economies (EMEs). PPI inflation in the euro-area, which firmed up to 9.9 per cent in July 2008, declined steadily during 2009; the maximum decline of 8.4 per cent was registered in July 2009. The rate of decline was lower at (-) 7.5 per cent in August 2009, with the index of euro-area manufacturing posting the highest month-on-month increase in the past 14 months.VI.4 Even though the headline inflation in most of the advanced countries have declined significantly since mid-2008, the earlier concerns over a possible deflationary spiral created by the negative inflation in the US, Japan and the Euro Area during the first half of 2009, have moderated to some extent, due to signs of policy induced recovery in terms of a rebound in manufacturing and a turn in the inventory cycle. Major factors that contributed to the disinflation process include the steep decline in oil prices from the record level in July 2008, large downward corrections in food and metals prices, lower transportation costs and the existence of significant industrial slackness due to sub-optimal capacity utilisation. According to the IMF (October 2009), global inflation is expected to remain subdued and vulnerable to mild deflation. With inflationary expectations remaining generally well-anchored, risks for sustained deflation are, however, perceived to be small. On the other hand, inflation risk may be more in emerging economies where output gaps are smaller and recovery may be stronger. IMF projects the inflation in advanced economies to be close to zero in 2009, with modest increase to 1 per cent in the following year; inflation in emerging economies is expected to hover around 5 per cent in 2009-10. China, a few ASEAN economies and most emerging European economies are likely to experience inflation of less than 5 per cent.
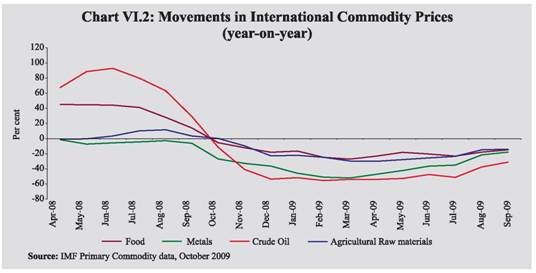
VI.5 Mitigating the adverse impact of the financial crisis continued to be the focus of monetary policy actions of most central banks. Policy rates in advanced economies such as US and Japan, which had reached near zero levels in 2008, were left unchanged during 2009. Policy rate cuts were effected by central banks in other advanced economies such as the U.K., Euro Area and Canada between March-May 2009, with no subsequent changes. Reserve Bank of Australia had reduced its policy rate by 25 basis points on April 8, 2009 but reversed it in October 7, 2009 on signs of economic recovery and improvement in measures of confidence (Table 6.1). Bank of Israel had also reduced its policy rate by 25 basis points effective from April 2009 but raised it back by 25 basis points effective from September 2009. VI.6 In the emerging economies, inflation eased significantly since July 2008, in line with decreases in international commodity prices and general slowdown in economic activity brought about by the global financial crisis. Among the major emerging economies, consumer price inflation in China and Thailand turned negative in early 2009, while it turned negative in Malaysia in June 2009; other major economies also witnessed significant easing in price pressures. Most central banks in emerging economies (except China) reduced their policy rates in 2009 in an effort to arrest the moderation in growth and to counter the spillover effects of the global financial crisis. The central banks of Russia, Thailand, Indonesia and Philippines continued to reduce their policy rates during the July-September quarter of 2009. Global Commodity Prices VI.7 International commodity prices, after sharply declining during the period July to December 2008, witnessed increases in 2009 up to September 2009 on account of crude oil and metal prices. Prices of foodgrains, such as rice, wheat and maize, however, declined both on a year-on-year basis as well as over end-March 2009 (Table 6.2). Most commodity prices, however, remained substantially below the very high levels recorded during the first half of 2008, which contributed to the negative year-on-year changes (Chart VI.2). Expectations of global economic recovery and weak supply prospects in major agricultural products, such as sugar and tea have been the major drivers of the recent increases in international commodity prices. VI.8 After exhibiting the highest intra-year volatility in 2008-09, international crude oil prices have gradually firmed up since March 2009, in response to expected global economic recovery and successive production cuts by Oil Producing and Exporting Countries (OPEC) to support prices. Crude oil prices breached the US $70 per barrel level in June 2009 and again in August 2009. While crude oil prices marginally declined in September 2009, they started firming up in October 2009 and crossed US $ 80 per barrel on October 21, 2009 due to the weakness of the US dollar and expectations of a recovery in global oil consumption in the face of sustained economic growth in China and signs of a turnaround in other Asian countries. According to the US Energy Information Association, the presence of high oil inventories and expectation of increased supplies by both OPEC and non-OPEC members during the second half of 2009 may prevent any sustained increase in oil prices.
VI.9 Metal prices, which had witnessed a declining trend since the second quarter of 2008 due to recessionary conditions prevailing in major economies, registered the sharpest decline in March 2009; prices have rebounded since April 2009, led by copper, lead and nickel. Improvement in global economic prospects has impacted the prices of cyclically sensitive base metals. Supply cutbacks in response to the prolonged decline in prices have impacted on the prices of certain key metals such as aluminium, tin and zinc. Increased demand from China to build up inventories and support domestic industrial revival has lent impetus to the rebound in metal prices. VI.10 Improved supplies, particularly in foodgrains and oilseeds, and unwinding of commodity investments by financial markets participants had eased the pressure on international food prices, which had peaked in 2008. There is, however, wide divergence in prices across various commodities due to commodity-specific factors such as weather conditions and acreage. International sugar prices, which had remained high in 2008, increased further in 2009. Price pressures mainly emanate from reduced global output, with India, the second major producer of sugar, turning a net importer in 2009-10, following a sharp decline in its sugar output in 2008-09. Sugar output in India is expected to decline further during 2009-10 due to drought in some of the major sugarcane growing States and unseasonal rains in others, which are likely to affect sugarcane output and sugar recovery rate from sugarcane, respectively. Wet weather conditions in Brazil, the largest producer of sugar, has also hampered harvest, thereby further reducing global supplies. VI.11 Agricultural raw materials exhibited greater volatility on account of changes in rubber prices, which track the crude oil prices. Strong demand and supply disruptions caused by unfavourable weather conditions exerted pressure on rubber price in recent months. Global cotton prices, which had slumped to a four-year low in March 2009 due to weak demand, firmed up in the subsequent months, particularly in October 2009, on expectations of a supply-demand mismatch due to a possible rebound in consumption from textile manufacturers and a shortfall in production. The International Cotton Advisory Committee (ICAC) expects the world cotton production to fall by 1 per cent in 2009-10 over the previous year. Inflation Conditions in India VI.12 The sharp decline in WPI inflation from the peak of 12.9 per cent in August 2008 had created adequate space for the Reserve Bank to adopt and sustain an accommodative monetary policy stance since mid-September 2008 so as to remove uncertainty about the availability of liquidity in the system and to contain the moderation in growth. VI.13 The Annual Policy Statement (APS) of the Reserve Bank for the year 2009-10, formulated against the backdrop of the slump in global demand and the resultant abatement of global commodity prices and the collapse of WPI inflation to near zero level in March 2009, continued to emphasise on the need to support the revival of economic growth while ensuring price stability and anchoring inflationary expectations. Accordingly, the policy rates were further reduced by 25 basis points as part of the monetary stimulus measures (Table 6.3). The APS projected WPI inflation at around 4.0 per cent by end-March 2010, keeping in view the global trends in commodity prices and domestic demand-supply balance.
VI.14 The First Quarter Review of Monetary Policy 2009-10 (FQR) (July 2009) noted that the negative WPI inflation in June 2009 was due to the base effect and was not indicative of a contraction of demand. It also observed that the sharp decline in WPI had not brought about a commensurate decline in inflationary expectations. The FQR, therefore, revised the WPI inflation projection upward to 5.0 per cent. VI.15 The WPI inflation, which had turned negative by the first week of June 2009, remained so for 13 consecutive weeks before moving up to above zero in September 2009. Unlike the volatile pattern in WPI inflation, CPI inflation continues to remain high in the range of 11.7 per cent to 13.2 per cent during August/September 2009. The divergence between the WPI and CPI inflation was highlighted both in the APS and the FQR. The FQR stated that the immediate challenge for the Reserve Bank was to manage the balance between the short-term compulsions of providing ample liquidity and the potential build-up of inflationary pressure on the way forward. The inflationary pressures have increased since the presentation of FQR, as evident from the recent trends in WPI, CPIs and inflation expectations. Wholesale Price Inflation VI.16 WPI inflation in India declined steadily since August 2008 and reached near zero levels by end-March 2009, driven by the reduction in the administered prices of petroleum products and electricity as well as decline in prices of freely priced minerals oil items, iron and steel, oilseeds, edible oils, oil cakes and raw cotton. Significant part of the decline in WPI inflation during this period was also on account of the base effect. VI.17 Year-on-year WPI inflation declined further during 2009-10 and turned negative on June 6, 2009. WPI inflation turned positive on September 5, 2009 and has remained marginally above zero since then (1.2 per cent as on October 10, 2009), with the petering out of the strong base effect of the significant increase in administered prices of petroleum products in June 2008. Freely priced products such as iron and steel, non-ferrous metals, chemicals and edible oils also recorded year-on-year declines during this period. VI.18 During the current financial year so far, WPI has already increased by 5.9 per cent in October 10, 2009 over the end-March-2009 level. The recent increase in the WPI was largely on account of the upward revision of prices of petrol and diesel (effective July 2, 2009), increase in prices of freely priced products under the fuel group in line with hardening of international crude oil prices, and higher prices of sugar, vegetables and drugs and medicines. Most non-food commodity prices moved in line with the international commodity prices (Table 6.4).
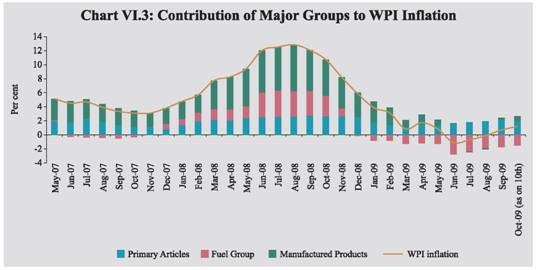
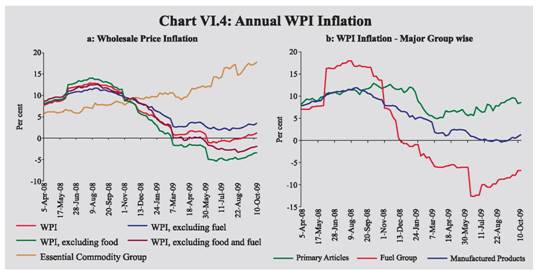
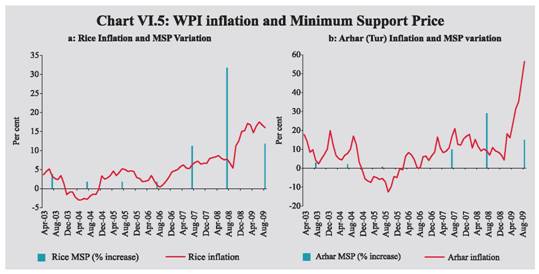
VI.19 In terms of contribution to overall inflation by the major groups, the contribution of the fuel group declined sharply and is negative at present (Chart VI.3). The contribution of manufactured products group which had turned negative, coincidental to the negative phase of WPI inflation during June-August 2009, moved up subsequently and is marginally above zero. The contribution of primary article group continues to remain positive and strong. VI.20 At a disaggregated level, the y-o-y WPI inflation excluding fuel was lower at 3.5 per cent as on October 10, 2009 as compared with 10.4 per cent a year ago. This was on account of the substantially high WPI fuel group inflation during the period June-October 2008. WPI inflation excluding food and fuel was, however, negative at (-) 1.9 per cent as on October 10, 2009. The annual average WPI inflation rate (average of 52 weeks) also declined to 2.5 per cent as on October 10, 2009 from 8.3 per cent at end-March 2009. Essential commodities group increased by 17.8 per cent, y-o-y, as on October 10, 2009, driven mainly by prices of sugar (45.1 per cent), pulses (22.8 per cent) and vegetables (19.6 per cent) (Chart VI.4a). VI.21 Amongst the major groups, primary articles inflation, y-o-y, was higher at 8.6 per cent as on October 10, 2009 from 5.2 per cent at end-March 2009, mainly on account of food articles which registered double-digit inflation (Table 6.5 and Chart VI.4b). The sharp upward revision in the minimum support prices (MSP) for most of the agricultural crops during the 2008-09 crop season partly accounts for the increase in the prices of foodgrain prices, particularly for rice and pulses (Chart VI.5). Rice price increase, y-o-y, has been in double digits since mid-October 2008, despite a record harvest and increase in public stocks. Supply constraints and increases in MSP affected the prices of pulses. Tea prices which had increased sharply in 2008-09, moderated to some extent in April 2009, only to rise steeply again since May 2009, with global tea production forecast to decline. Estimated production of tea up to August 2009 by the Tea Board of India showed a decline over the previous year. Price increases, though, have significantly decelerated since June 2009, largely on account of the base effect.
VI.22 Among the non-food articles, y-o-y inflation in raw cotton declined steadily since end-May 2009 although there has been some moderation in the decline in recent weeks. With the acreage under cotton increasing in the current financial year so far, cotton output is estimated to be higher than the previous year. Oilseed prices which had declined since June 2009, marginally increased since September 2009 with output likely to fall due to delayed and deficient monsoon. VI.23 Year-on-year fuel group inflation, which turned negative in December 2008 in line with the international crude oil prices, continued to decline during the current financial year, dragging down the overall WPI inflation. Despite the increase in international crude prices to around US$ 70 per barrel by end-June 2009 and the corresponding increase in freely priced products, the disinflation in the fuel group moved to double digit level in June 2009, weighed by the base effect of upward revision of administered prices in June 2008. With the Government announcing hikes in administered prices of petrol and diesel effective from July 2, 2009 to partially offset the under recoveries of oil companies arising from increase in international crude prices, fuel price disinflation moderated. VI.24 Manufactured products inflation, year-on-year, has also decelerated since March 2009, reflecting the base effect, and turned negative in July 2009. It, however, reversed on September 12, 2009 and remained marginally positive since then. The movement in manufactured products inflation was largely driven by the year-on-year decline in prices of iron and steel, edible oils, fertilisers, man-made fibre and machinery and machine tools. Manufactured food articles inflation was mainly driven by sugar prices, which rose sharply due to falling stocks and weak and sporadic monsoon. The other major contributor to manufactured food inflation was dairy products, the prices of which were affected by reduced supplies in the wake of the recent weak monsoon and its impact on animal fodder.
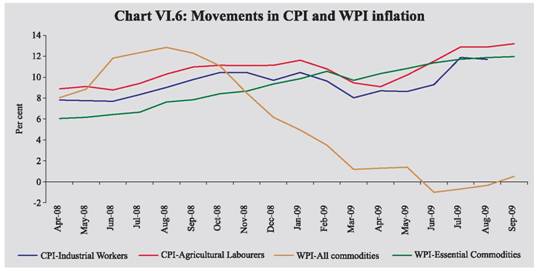
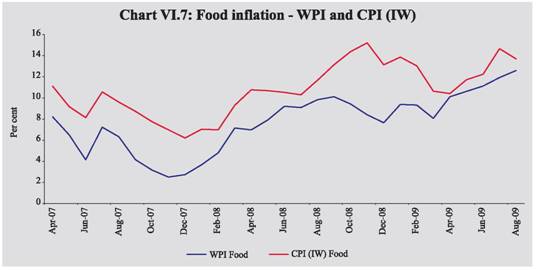
VI.25 ‘Basic metals, alloys and products’ sub-group of manufactured products registered negative inflation y-o-y, as on October 10, 2009, mainly on account of a decline in the prices of iron and steel which could be attributed to decline in global prices and sluggish domestic and external demand. VI.26 Primary articles prices have increased by 9.8 per cent over the end-March 2009 level of the index. Vegetable prices recorded an increase of around 59.3 per cent over end-March 2009. This was mainly on account of a steep increase of over 100 per cent in the price of potatoes, the second highest weighted commodity amongst the vegetables, due to a decline in output in the current season following a slump in potato prices during the previous year. Pulses prices moved into double digit during the second quarter of 2009-10. Although increase in rice prices over end-March 2009 were moderate, at less than 3 per cent up to October 3, 2009, prospects of a decline in output during 2009-10 due to the shortfall in acreage under paddy as well as the damage caused by floods in rice growing States has led to the firming up of prices to around 6 per cent as on October 10, 2009. VI.27 During the current financial year (up to October 10, 2009), prices of various freely priced petroleum products increased over their levels in end-March 2009 in line with international prices. While increase in the prices of furnace oil was the highest, at 55.7 per cent, that of bitumen was the least at 5.4 per cent. Price increases in other products were 39.9 per cent for avian turbine fuel, 30.1 per cent for light diesel oil, 28.1 per cent for naphtha and 6.5 per cent for high speed diesel. VI.28 Manufactured product inflation for the financial year (up to October 10, 2009) was driven by the increase in manufactured food products and drugs and medicines. A sharp increase in the volume of edible oil imports in the face of low international prices exerted downward pressure on edible oils which declined over the end-March level. With the revival in automobile sales and the unwinding of stocks, both in the domestic and international markets, major steel companies have raised their prices of flat steel during the current financial year. This has resulted in a marginal increase in the price of steel sheets within the iron and steel sub-group over end-March 2009 level. VI.29 Overall, the year-on-year deceleration in WPI inflation has been on account of the sharp decline in fuel group. While prices of primary articles continue to remain high, manufactured products posted modest price increases. Consumer Price Inflation VI.30 Inflation based on y-o-y variation in consumer price indices (CPIs) has increased since June 2008, mainly due to increase in the prices of food, fuel and services (represented by the ‘miscellaneous’ group). The various measures of consumer price inflation remained high in the range of 11.7-13.2 per cent during August/ September 2009 as compared with 8.5-12.4 per cent in August/September 2008 and 8.0-9.7 per cent in March 2009 (Table 6.6). VI.31 CPI inflation has been significantly different from the WPI inflation in the recent period and the divergence has also been increasing (Chart VI.6). VI.32 The greater divergence between WPI and CPI inflation could be attributed to the higher weight in CPIs of food articles, which have displayed higher inflation in recent months. When there is an upward pressure on food prices, CPI (IW) food inflation in general appears to increase at a faster rate and remain at the elevated level for a longer period than the WPI inflation. There has, however, been a dip in CPI food inflation in August 2009, bringing it closer to WPI food inflation (Chart VI.7). The higher order of inflation in the same commodities at the retail level (as captured in CPI) could be on account of intermediation costs, higher transportation and labour costs between wholesale and retail markets, as well as better pricing power in the retail market in relation to wholesale markets. Thus, the divergence between WPI and CPI inflation is not only because of differences in weights and coverage, but also because of the actual price differences for similar commodities at the wholesale and retail levels. VI.33 Among the non-common groups in the WPI and CPI, the miscellaneous group under CPIs (with weights ranging from 11.9 per cent to 24 per cent) which includes services, also exhibited significant price pressures. Similarly, metals group (weight of 8.3 per cent), which is only represented in the WPI, has exhibited significant negative inflation, contributing to the widening of the overall difference between inflations as per the CPIs and WPI. There also exists a lag in the movement of CPI inflation in relation to the WPI inflation.
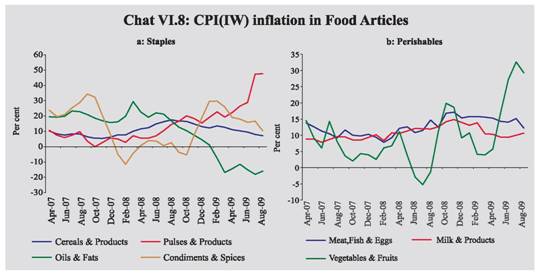
VI.34 Within the food category of the CPI (IW), inflation has been the highest in the pulses sub-group amongst the staples and in the vegetables sub-group amongst the perishables, since April 2009 and May 2009, respectively (Charts VI.8a and b). VI.35 CPI-IW for housing, which is not represented in the CPI-AL and CPI-RL showed a sharp rise of 22.1 per cent in July 2009 on account of revision of imputed rent for rent-free accommodation, reflecting the impact of the Sixth Pay Commission award on CPI inflation. It may be mentioned that housing index in the CPI is compiled once in every six months, viz., January and July. The index would, therefore, remain at the elevated level in the months to come. VI.36 Overall, the emerging price pressures are already visible, even though year-on-year WPI inflation remains low. With the base effect of sharp fuel price increases a year ago petering out, year-on-year WPI inflation has emerged out from the negative zone after 13 weeks. Within the WPI, the essential commodities group, particularly food articles contributed the most to the increase in inflation. Reflecting inflation momentum, WPI has been rising since end-March 2009, spurred both by domestic supply constraints in certain commodities and increases in international commodity prices. Consumer price inflation continues to remain firm and the divergence between CPI and WPI inflation has widened further during the first half of 2009-10. High CPI inflation is a major risk to inclusive growth, since it could potentially lead to erosion in real income of the segments of population for which the CPI indices are prepared. Persistent high CPI inflation could also lead to wage/cost push inflation because of the pressures for price/wage revisions and revisions to minimum support prices, which are linked to CPI indices. More importantly, it could further inflate the inflationary expectations. Given the supply side sources of emerging inflationary pressures, the policy focus needs to be directed at improving both the supply conditions and the supply chain for more efficient distribution. Measures are already afoot to manage the supply side pressure on inflation. These include the proposed release of 30 lakh tonnes of wheat during October 2009-March 2010 under the open market sale scheme; removal of restrictions such as stock holding limits on wheat in order to facilitate purchase by private traders during the harvesting season; restrictions on large consumers of sugar to conserve stock; increased release in sugar quota ahead of the festival season; removal of import duty on rice, wheat and raw sugar; and permission for duty free import of white/refined sugar up to 10 lakh tonnes by Central/State Government agencies and private traders in addition to designated agencies. Sustained high CPI and essential commodities inflation could pose a challenge to the Reserve Bank’s objective of firmly anchoring inflation expectations.
|
|||||||||||||||||||||||||||||||||||||||||||||||||||||||||||||||||||||||||||||||||||||||||||||||||||||||||||||||||||||||||||||||||||||||||||||||||||||||||||||||||||||||||||||||||||||||||||||||||||||||||||||||||||||||||||||||||||||||||||||||||||||||||||||||||||||||||||||||||||||||||||||||||||||||||||||||||||||||||||||||||||||||||||||||||||||||||||||||||||||||||||||||||||||||||||||||||||||||||||||||||||||||||||||||||||||||||||||||||||||||||||||||||||||||||||||||||||||||||||||||||||||||||||||||||||||||||||||||||||||||||||||||||||||||||||||||||||||||||||||||||||||||||||||||||||||||||||||||||||||||||||||||||||||||||||||||||||||||||||||||||||||||||||||||||||||||||||||||||||||||||||||||||||||||||||||||||||||||||||||||||||||||||||||||||||||||||||||||||||||||||||||||||||||||||||||||||||||||||||||||||||||||||||||||||||||||||||||||||||||||||||||||||||||||||||||||||||||||||||||||||||||||||||||||||||||||||||||||||||||||||||||||||||||||||||||||||||||||||||||||||||||||||||||||||||||||||||||||||||||||

এই পৃষ্ঠাটো শ্বেয়াৰ কৰক:


ভাৰতীয় ৰিজাৰ্ভ বেংক মোবাইল এপ্পলিকেষ্যন ইনষ্টল কৰক আৰু নৱীনতম বাতৰিৰ প্ৰৱেশাধিকাৰ পাওক!


