
III. Money, Credit and Prices - আৰবিআই - Reserve Bank of India


III. Money, Credit and Prices
Reserve Money
Monetary Survey
Price Situation
3.1 Monetary conditions closely tracked the evolution of real activity during 2002-03. The growth of non-food bank credit, inclusive of banks’ investments in non-Statutory Liquidity Ratio (non-SLR) instruments, was in consonance with the recovery of industrial output. Credit expansion was facilitated by conditions of ample liquidity in financial markets, engendered by massive capital inflows. Interest rates declined across the spectrum in response to the easy liquidity conditions, and to monetary policy signals for softening that were transmitted through cuts in the Bank Rate, the repo rate and the cash reserve ratio (CRR). The lowering of interest rates was made possible by a benign inflation environment except for a spurt in the last quarter due to the hardening of international oil prices and of some drought related price hike for items such as oilseeds and edible oils. On the other hand, currency and deposit growth slowed down moderately reflecting the adverse impact of the drought on rural incomes and the lowering of deposit rates by banks. Broad money growth reflected these diverse impulses from real activity. Reserve money growth was moderated by the deployment of policy instruments to counter the expansionary effects of large external flows.
3.2 In recent years, reserve money has become the operating target of monetary policy in the endeavour to stabilise the demand for bank reserves and, thereby, to create conditions conducive for adequate credit growth in support of industrial activity. Consequently, the behaviour of reserve money increasingly reflects the impact of active liquidity management as the Reserve Bank alters its own balance sheet in response to market conditions. For most of 2002-03, excess liquidity in the market was absorbed through policy operations which impacted on the monetary base (Chart III.1).
3.3 The behaviour of reserve money in 2002-03 was predominantly influenced by the large inflows from abroad. Excess supply conditions in the foreign exchange market were reflected in continuous purchases of foreign exchange by the Reserve Bank and accretions to the Reserve Bank’s foreign currency assets (Appendix Table III.1). The primary liquidity generated by this substantial accretion to the net foreign assets (NFA) was sterilised through active recourse to open market sales and repos under the liquidity adjustment facility (LAF). As a result, the net domestic assets (NDA) of the Reserve Bank declined to barely 2.9 per cent of reserve money at end-March 2003 (Chart III.2 and Table 3.1).
|
|
||||||||
Note : |
1. Data based on March 31 for Q4 and last reporting Friday for all other quarters. |
|||||||
2. Figures in brackets are percentage variations during the year. |
||||||||
3.4 Given the stock of marketable instruments in the Reserve Bank’s portfolio, the decline in the NDA to near-zero levels as a proportion to reserve money focuses attention on the limits being approached to full sterilisation and, therefore, on the future conduct of monetary policy in the context of large and sustained capital inflows (Box III.1).
3.5 The Reserve Bank’s net credit to the Government – the major constituent of the NDA –contracted over the year with the divestment of government securities from its holdings through open market sales. With the growing market orientation of monetary policy, the Reserve Bank’s net credit to the Centre no longer reflects its financial support to the Centre’s borrowing programme but rather the impact of secondary market operations which cause changes in the ownership of the underlying securities. The Reserve Bank’s primary subscriptions to the Centre’s fresh dated securities during the year were concentrated in the first and the fourth quarters. The fourth quarter primary subscriptions, however, were entirely the counterpart of the pre-payment of external loans owed to multilateral agencies. On the other hand, the Reserve Bank’s secondary operations in the form of open market sales (alongwith repo operations) were carried out throughout the year, intensifying from the second quarter onwards. The higher order of open market operations relative to primary placement is an indication of the pressures imposed by the need to sterilise capital inflows, since the Reserve Bank has been consistently pursuing the strategy of taking primary issuances of government securities on to its own books when market considerations are not favourable and subsequently off-loading them with a view to ensuring the successful completion of the borrowing programme at lower costs and higher maturities. Repo operations under the LAF balanced out over the year (Table 3.2).
3.6 The Centre’s comfortable liquidity position was reflected in lower recourse to loans and advances from the Reserve Bank during 2002-03 (Chart III.3). The loans and advances generally remained well within the stipulated limits (Rs.10,000 crore and Rs.6,000 crore for the first and the second halves of the year, respectively). The second half of the year, in fact, witnessed only a few incidents of recourse to loans and advances as the Centre often had sizeable surplus balances which were invested in its own securities. The comfortable market liquidity conditions also resulted in a reduction in the Reserve Bank’s credit to banks and primary dealers (PDs) during the year (Appendix Table III.2).
Developments during 2003-04
3.7 Reserve money recorded a higher order of year-on-year expansion during 2003-04 so far (as on August 15, 2003) (Table 3.3). The growth in reserve money was entirely on account of sustained external flows driving up the NFA of the Reserve Bank. As a result, the NFA-currency ratio reached the level of 131.7 per cent as on August 15, 2003. The increase in NFA was partly offset by a further decline in the Reserve Bank’s net credit to the Centre. Recourse of commercial banks and PDs to credit from the Reserve Bank also fell reflecting easy liquidity conditions.
(Rupees crore) |
|||||
|
|
|||||
Year-on-year Variations |
|||||
As on |
As on |
||||
August 15, 2003 |
August 16, 2002 |
||||
|
|
|||||
Absolute |
Percent |
Absolute |
Percent |
||
|
|
|||||
1 |
2 |
3 |
4 |
5 |
|
|
|
|||||
Reserve Money |
47,017 |
14.0 |
31,231 |
10.2 |
|
Major Components |
|||||
1. |
Currency in Circulation |
35,024 |
13.3 |
32,049 |
13.9 |
2. |
Bankers’ Deposits with |
11,106 |
15.8 |
-1,030 |
-1.4 |
RBI |
|||||
Major Sources |
|||||
1. |
Net Reserve Bank Credit |
-49,880 |
-36.4 |
-19,842 |
-12.7 |
to Government |
|||||
of which: to Centre |
-50,820 |
-37.9 |
-18,436 |
-12.1 |
|
2. |
Net Foreign Exchange |
97,642 |
33.1 |
84,429 |
40.2 |
Assets (NFEA) of RBI |
(1,04,484) |
(69,291) |
|||
|
|
|||||
Note : Figures in brackets are foreign currency assets net of revaluation. |
|||||
3.8 Broad money slowed down in(M3) consonance with real GDP growth during 2002-03, remaining within the indicative projection of the Monetary and Credit Policy announcement of April 2002. Slower growth of currency as well as aggregate deposits restrained monetary expansion, as deposits turned relatively unattractive at the margin in comparison with competing instruments of financial saving (Chart III.4 and Appendix Table III.3). This switch in preference away from bank deposits for alternative avenues of asset formation was also evident in a robust growth of postal deposits which drove up the principal liquidity measure i.e., L1 relative to M3.
Chart III.4 Components of Money Supply
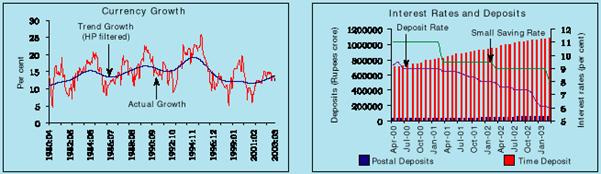
3.9 Currency demand was affected by the contraction of rural activity on account of the drought and remained below its trend growth. There was a generalised slackening of the appetite for deposits. Aggregate deposit growth dropped, driven down by the lagged response of time deposits to the moderation in deposit rates by banks, which also resulted in lower accruals of interest (included under time deposits). Non-resident foreign currency deposit growth fell sharply vis-a-vis domestic deposits, indicative of a shift in favour of relatively high interest bearing non-resident rupee deposits as well as positive exchange rate expectations. As a consequence, money supply excluding foreign currency liabilities i.e., recorded a higher order NM3 of expansion relative to M3 (Appendix Table III.4).Deposits placed with non-bank financial companies were almost unchanged affecting the expansion of the widest measure of liquidity i.e, L3 (Table 3.4 andAppendix Table III.5).
|
|
|||||||||
Variable |
Outstanding as on |
(Variation in per cent) |
|||||||
March 31, 2003 |
|||||||||
(Rupees crore) |
Point to point Basis |
Monthly Average Basis |
|||||||
2002-03 |
2001-02 |
2002-03 |
2001-02 |
||||||
|
|
|||||||||
1 |
2 |
3 |
4 |
5 |
6 |
||||
|
|
|||||||||
I. |
Reserve Money |
3,69,061 |
9.2 |
11.4 |
9.3 |
11.1 |
|||
II. |
Broad Money (M3) |
16,95,551 |
13.2 |
14.1 |
14.0 |
16.1 |
|||
a) |
Currency with the Public |
2,70,983 |
12.5 |
14.9 |
13.8 |
12.7 |
|||
b) |
Aggregate Deposits |
14,21,326 |
13.3 |
14.1 |
14.1 |
16.9 |
|||
i) |
Demand Deposits |
1,98,602 |
10.8 |
7.8 |
9.9 |
10.3 |
|||
ii) |
Time Deposits |
12,22,725 |
13.7 |
15.2 |
14.8 |
18.0 |
|||
of which: Non-Resident Foreign Currency Deposits |
92,240 |
1.5 |
5.5 |
4.3 |
37.0@ |
||||
III. |
NM3 |
16,15,236 |
13.8 |
15.7 |
14.8 |
15.5 |
|||
IV. |
a) |
L1 |
16,70,283 |
14.1 |
16.0 |
15.1 |
15.8 |
||
of which: Postal Deposits |
55,047 |
25.3 |
27.6 |
25.6 |
26.6 |
||||
b) |
L2 |
16,76,490 |
14.1 |
15.2 |
14.8 |
15.5 |
|||
of which: FI Deposits |
6,207 |
20.7 |
-60.2 |
-36.7 |
-15.0 |
||||
c) |
L3 |
16,96,063 |
14.0 |
15.2 |
14.5 |
15.2 |
|||
of which: NBFC Deposits |
19,573 |
0.8 |
10.8 |
6.0 |
0.8 |
||||
V. |
Major Sources of Broad Money |
||||||||
a) |
Net Bank Credit to Government (i+ii) |
6,78,059 |
15.0 |
15.2 |
13.7 |
16.7 |
|||
i) |
Net Reserve Bank Credit to Government |
1,20,679 |
-20.7 |
-1.1 |
-17.4 |
1.5 |
|||
of which: to the Centre |
1,12,985 |
-20.1 |
-3.5 |
-17.9 |
0.6 |
||||
ii) |
Other Banks’ Credit to Government |
5,57,379 |
27.4 |
22.1 |
25.5 |
23.9 |
|||
b) |
Bank Credit to Commercial Sector |
8,62,068 |
13.5 |
11.8 |
12.6 |
12.8 |
|||
of which: Scheduled Commercial Banks’ Non-food Credit |
6,35,192 |
18.6 |
13.6 |
16.5 |
11.8 |
||||
c) |
Net Foreign Exchange Assets of Banking Sector |
3,93,715 |
26.6 |
24.5 |
31.4 |
24.5 |
|||
|
|
|||||||||
Data provisional. |
|||||||||
@ |
Reflects the Indian Millennium Deposits (IMDs) effect. |
||||||||
Note : |
1. M3, NM3, L1, L2, L3 and deposits are adjusted for the full impact of mergers while credit is adjusted for the initial impact of mergers since May 3, 2002. |
||||||||
2. Sharp variations in FI deposits reflect the impact of the mergers. |
|||||||||
3.10 In order to ensure consistency with conceptual and definitional principles adopted in India as in the majority of countries the world over, analysis of monetary aggregates during 2002-03 excludes the effects of mergers which resulted in the integration of non-monetary liabilities in the form of bonds and debentures with the balance sheet of the banking system. While the mergers resulted in ‘re-intermediation’ and an expansion of the banking system’s assets and liabilities, it is important to extract only the monetary liabilities therefrom for the purpose of compilation and analysis of money supply as conventionally understood (Box III.2).
Sources of Money Supply
3.11 Variations in monetary aggregates were driven in 2002-03 by shifts in the asset portfolios of banks in response to movements in relative rates of return as well as a generalised risk sensitivity in an environment characterised by depressed equity markets, an uncertain monsoon outlook and hesitant recovery of aggregate demand. The pick-up in domestic credit during 2002-03 was absorbed by the government and the commercial sectors. Net bank credit to the Government was maintained at around 41.0 per cent of domestic credit, reflecting the persistent appetite for government securities in the banking system. Scheduled commercial banks’ holding of Government securities was around 39.0 per cent of their net demand and time liabilities (NDTL); at end-March 2003, they were higher by Rs.1,95,974 crore than the statutory minimum requirement of 25.0 per cent required for the maintenance of the SLR. In recent years, the progressive market orientation of the Centre’s borrowing programme has minimised the recourse to automatic monetisation and captive financing. Since the 1990s, government securities have emerged as an attractive avenue for investments by banks, particularly in the context of prudential norms imposed under financial sector reforms. Contemporaneously, the Reserve Bank has had to adjust monetary policy to sterilise large inflows of capital. Consequently, the share of the Reserve Bank in outstanding net bank credit to the Government sector which was over 62 per cent in 1990-91 declined to around 20 per cent in 2002-03 (Chart III.5).
3.12 Food credit declined in 2002-03 due to a significant fall in procurement operations. This added to liquidity in the system. Non-food credit extended by scheduled commercial banks accelerated to accommodate the revival of industrial activity (Chart III.6 and Appendix Table III.6).
3.13 The increase in non-food credit demand was well distributed across industries such as infrastructure, housing, cement, cotton textiles, gems and jewellery, iron and steel, electricity, computer software, automobiles, petroleum and fertilisers (Appendix Tables III.8 and III.9). Growth of credit to the housing industry continued to remain high, benefiting from tax incentives as well as the softening of interest rates (Table 3.5). The recovery in export credit reflected high export growth (Appendix Table III.10). Engineering, coal and tobacco industries, however, recorded declines in credit off-take.
3.14 Bank credit flows to the commercial sector include their investments in commercial paper, shares, bonds and debentures, units of mutual funds and other instruments which fall outside the purview of eligible instruments for the purpose of maintaining the SLR. Since 1997-98, the share of such investments in commercial sector credit has doubled, indicative of a shift in portfolio choice for tradable assets as against traditional loans and advances (Table 3.6).
(Rupees crore) |
|||||
|
|
|||||
Variable |
As at end-March |
||||
2003 |
2002 |
1997 |
|||
|
|
|||||
1 |
2 |
3 |
4 |
||
|
|
|||||
1. Commercial Paper |
4,258 |
8,497 |
685 |
||
2. Shares issued by |
9,017 |
5,914 |
1,252 |
||
2.1 |
PSUs |
1,431 |
1,586 |
348 |
|
2.2 |
Private Corporate Sector |
7,586 |
4,327 |
904 |
|
3. Bonds/Debentures issued by |
79,760 |
66,589 |
16,631 |
||
3.1 |
PSUs |
46,633 |
39,520 |
14,277 |
|
3.2 |
Private Corporate Sector |
33,127 |
27,069 |
2,354 |
|
Total Non-SLR Investments (1+2+3) |
93,036 |
81,000 |
18,568 |
||
|
|
|||||
Memo Items |
|||||
|
|
|||||
Conventional Bank Credit |
7,29,216 |
5,89,723 |
2,78,401 |
||
Bank Credit including non-SLR |
|||||
Investments |
8,22,252 |
6,70,723 |
2,96,969 |
||
(64.2) |
(60.8) |
(59.4) |
|||
|
|
|||||
Note: |
Figures in parentheses indicate the ratio of bank credit (including non-SLR investments) to aggregate deposits. |
||||
3.15 Bank portfolio shifts between credit and investments reflect the liberalisation of various segments of the financial market spectrum. They also indicate a diversification of core banking competencies with the objective of diffusing credit risk along with improved capabilities to manage market risk. Similar forces are at work driving banks to seek higher profits from treasury operations (Box III.3).
Box III.3 The portfolio allocation of banks between credit and investments assumes crucial importance on account of two reasons. First, in the tradition of the 'credit view', the existence of market imperfections and information asymmetries make credit and investments in bonds imperfect substitutes. Accordingly, interest rates work through a menu of rates of returns on a host of financial assets and responses of bank portfolios to monetary policy impulses tend to be magnified through a financial accelerator framework. Second, the portfolio choice of banks is strongly influenced by cyclical effects. Typically during an economic slowdown, banks exhibit a pro-cyclical flight to safety preferring risk-free government securities to loans. This is further re-inforced by risk-based capital requirements. In the upturn, banks' portfolio preference shifts to high-returns credit. Underlying these overarching behaviourial characteristics are the fundamental determinants of bank credit and investments which play a decisive role in banks' portfolio selection. Portfolio management approaches study the allocation of available funds to the banks (deposits and capital, adjusted for required reserves) across 'liquid assets', 'investment assets' and 'loans'. The desired size of liquid assets typically varies directly but less than proportionately with the size of deposits A bank's holdings in investment assets are determined by the expected rate of return and its variability. Loans are assets with highest risk and least liquidity, with expected return and risk determined in negotiations between borrower and lender. The combined effect of all the elements in the 'loan terms' vector would determine the expected rate of return and risk on loans. An impulse in the form of deposit inflows would result in portfolio adjustment with immediate expansion of liquid assets like short-term investments and cash in hand, followed by movements towards long-term securities. The movement of funds towards loans is rather slow on account of both lender and borrower inertia. The US experience suggests that shortly after the introduction of Basel I risk-based capital requirements, banks decreased the share of commercial and industrial loans in total bank credit. The introduction of risk-based capital requirements and greater regulatory scrutiny of business loans encouraged banks to hold safer assets such as government securities and disfavoured commercial lending. The downturn in activity and secular shifts towards off-balance sheet items like letters of credit and loan commitments exacerbated the decline in commercial lending due to enforcement of regulatory standards. The Indian experience shows that banks’ investment-credit ratio has shown a steady upward movement over the 1990s (Chart). Empirical investigation suggests that both credit and investment are integrated of the same order i.e., they exhibit strong co-movement in the long-run. Accordingly, if cyclical influences are cleaned out, expansion in bank credit tends to crowd in investment. It is only in phases of overall slowdown that risk aversion produces divergencies. An empirical investigation of the credit dynamics of banks in India showed that the demand for non-food credit is predominantly influenced by the behaviour of industrial activity and is inversely related to the bank lending rate. Supply of bank credit is found to be positively influenced by the lending rate and its past behaviour, indicative of rigidities in the interest structure in India. Banks' investment in government securities is primarily influenced by the state of development of the gilt market and the application of prudential norms. A cross sectional analysis shows that public sector banks tend to be relatively more risk-averse with high share of deposits in their liabilities and higher share of gilt investments in assets. Contrasting behaviour is revealed by foreign banks and new private sector banks. References
|

3.16 As in the past, net foreign assets of the banking system continued to be dominated by large accretions to the Reserve Bank’s foreign currency assets on account of purchases of foreign currency from banks. Scheduled commercial banks’ foreign currency assets declined (Chart III.7). Expectations of a strengthening domestic currency combined with positive differentials between domestic and international interest rates seem to have produced a distinct home bias. This resulted in substantial net inflows of banking capital in the form of reduction in investments in foreign paper, substitution of foreign currency deposits by non-resident rupee deposits and higher overseas borrowings.
3.17 Banks have been steadily building up their capital accounts in the form of statutory capital, investment fluctuation and revaluation reserves, with a relatively small component of fresh equity issuances. During 2002-03, scheduled commercial banks’ capital and reserves increased further, in consonance with their rising investments in government securities and greater freedom in respect of managing foreign assets. New issues of subordinated debt for Tier II capital during the year also augmented the banking system’s capital account.
Developments during 2003-04
3.18 Year-on-year broad money (M3) expansion decelerated during 2003-04 (as on August 8, 2003) mainly on account of slowdown in aggregate deposits. Deceleration in time deposits growth continued in response to lower interest rates and the continuing impact of last year’s drought. Among the sources, growth in net bank credit to the Government decelerated. Bank credit to commercial sector slowed down primarily on account of decline in food credit which, in turn, was due to lower procurement and higher off-take. Commercial banks’ non-food credit remained more or less steady in consonance with industrial growth (Table 3.7). Non-SLR investments declined mainly on account of a decline in banks’ investments in bonds/debentures.
(Rupees crore) |
||||
|
|
||||
Year-on-year Variation |
||||
As on August 8, 2003 |
As on August 9, 2002 |
|||
Absolute |
Per cent |
Absolute |
Per cent |
|
|
|
||||
1 |
2 |
3 |
4 |
5 |
|
|
||||
1,86,673 |
11.4 |
1,99,334 |
14.3 |
|
Broad Money (M3) |
||||
Major Components |
||||
Currency with Public |
31,717 |
12.5 |
30,910 |
13.8 |
Aggregate Deposits |
1,54,071 |
11.2 |
1,68,320 |
14.4 |
Major Sources |
||||
Net Bank Credit to |
||||
Government |
68,822 |
10.6 |
84,465 |
15.0 |
of which: |
||||
by Reserve Bank |
-68,421 |
-44.4 |
-11,921 |
-7.2 |
Bank Credit to |
||||
Commercial Sector |
87,306 |
10.6 |
86,723 |
12.5 |
of which: Scheduled |
||||
Commercial Banks |
||||
non-food Credit |
90,717 |
15.3 |
73,230 |
15.4 |
Net Foreign Exchange |
||||
Assets (NFEA) of the |
||||
Banking Sector |
83,426 |
24.3 |
88,514 |
34.7 |
|
|
||||
Commercial Banking Survey
3.19 Commercial banks continue to be the dominant financial intermediaries in India, especially with the slackening of activity in other segments of the financial system in the downswing of the business cycle. Consequently, movements in the assets and liabilities of the commercial banks have a determining influence on the behaviour of monetary and credit aggregates. The commercial banking survey provides a bird’s eye view of the flow of funds within the financial system between sources and uses during the year which needs to be superimposed upon the annual variations.
3.20 Liquidity in the banking system expanded on the back of the usual first quarter upturn in domestic deposits tapering off over the remaining quarters. The release of resources through the reduction in the CRR helped to augment the liquidity generated in the banking system. Call/ term borrowings from financial institutions decelerated sharply up to the third quarter due to ample liquidity conditions. In the fourth quarter, however, banks’ call borrowings spurted due to relatively tight money market conditions.
3.21 As regards the uses of funds, the off-take of bank credit by the Government was heaviest in the first quarter, reflecting the launch of the market borrowing programme of the Centre. Growth in bank credit to the government dipped in the subsequent quarters. The pick-up in non-food credit occurred steadily from the second quarter of 2002-03. Banks’ investments in non-SLR investments declined sharply in the fourth quarter following reduction in their investments in commercial papers and units of mutual funds. Net foreign assets of banks were drawn down from the second quarter onwards. Foreign currency repatriable deposits declined from the third quarter; overseas borrowings of banks rose, particularly during the second half of the year. With the prevailing easy liquidity conditions and phasing out of the collateralised lending facility (CLF), net bank reserves started increasingly reflecting the movements in the CRR requirements and LAF operations. A large build-up in the capital account occurred in the first quarter of the year reflecting mergers in the banking system and reserve accumulation by the banks (Table 3.8).
3.22 The flow of resources from non-banks by way of capital issues, GDRs/ADRs/FCCBs, CPs and credit from financial institutions (FIs) to the commercial sector continued to be subdued. Credit from FIs shrank for the second consecutive year due to slowdown in their new business while loans extended by them in the past were repaid. Capital issues dwindled under depressed conditions in the primary market and waning of corporates’ interest due mainly to sluggish investment activity (Table 3.9).
3.23 Inflation remained low in India over the first three quarters of 2002-03 in a benign international inflation environment. In the US and the Euro area, inflation was close to two per cent. Output gaps held down inflation in most of the industrial countries. Declining inflation raised the fears of deflation in several countries. The Japanese experience of prolonged decline in prices, bound in a spiral of weak activity and financial stress, is being examined afresh as several Asian countries (China, Hong Kong, Singapore, Taiwan and Thailand) joined Japan in deflation, either intermittently or persistently. Inflation continued to decline across the Commonwealth of Independent States (CIS) region and Africa, aided by progress in fiscal consolidation. Countries in Latin America and Russia faced significant inflation risk. Consumer prices are expected to increase by less than two per cent in 2003 in advanced economies and by just under six per cent in developing countries (World Economic Outlook, IMF, April 2003) (Chart III.8).
3.24 International commodity prices recovered in 2002 after bottoming out in late 2001. Non-fuel commodity prices, however, remained bound by weak demand and inventory drawdown. In 2002, metal prices recovered weakly with stocks of key metals at comfortable levels. International prices of food items, agricultural materials and beverages firmed up in 2002, mostly due to adverse weather conditions in a number of regions. International crude prices rose markedly from early August 2002 up to early 2003 owing to the geo-political situation in Iraq (Chart III.9).
3.25 Headline inflation firmed up in June and July 2002 on the back of two rounds of increases in POL prices, and the impact of drought conditions which drove up prices of oilseeds and edible oils in the first half of the year. Inflation started easing in the second half of September 2002 as supply management strategies - step up in off-take, reduction in issue prices below economic cost, enhanced allocation for targeted employment programmes and imports - were put in place.
3.26 Reflecting the global situation, inflation in India firmed up in the last quarter of 2002-03, driven up by the hardening of international oil prices and supply side pressures on items like oil seeds, edible oils and oil cakes. Between December 14, 2002 and the end of March 2003 inflation rose by 3.3 percentage points, contributed mainly by prices of manufactures and POL prices. Statistical base effects arising out of a declining price level in 2001-02 were embedded in the inflation outturn during this period, tapering off towards the end of the year (Table 3.10).
(Per cent) |
|||||
|
|
|||||
Groups |
Inflation Rate |
Weighted Variation |
|||
|
|
|||||
Mar. 29, |
Feb. 22, |
Dec. 14, |
Feb. 22, |
Mar. 29, |
|
2003 |
2003 |
2002 |
2003 over |
2003 over |
|
Dec. 14, |
Dec. 14, |
||||
2002 |
2002 |
||||
|
|
|||||
1 |
2 |
3 |
4 |
5 |
6 |
|
|
|||||
Fuel Group |
10.8 |
7.5 |
4.4 |
0.5 |
1.6 |
Primary Articles |
6.1 |
6.3 |
3.3 |
0.3 |
0.4 |
Manufactures |
5.1 |
4.4 |
2.8 |
0.9 |
1.2 |
Base Effect |
– |
– |
– |
0.6 |
0.1 |
All Commodities |
6.5 |
5.5 |
3.2 |
2.3 |
3.3 |
|
|
|||||
3.27 Within the overall variation in wholesale price inflation, disaggregated commodity price movements indicate that the inflation record of 2002-03 was dominated by the prices of non-food items; in contrast, it was primary food items which drove inflation in the preceding year. The drought conditions initially affected the prices of oil seeds and sugar cane. Eventually, the prices of primary non-food articles went up substantially in the post-kharif period, reflecting the visceral effects of moisture stress on the production of primary commodities. Prices of agro-based products in the manufacturing category rose contemporaneously (Chart III.10).
3.28 Prices of manufactures rose towards the close of 2002-03 on account of firming up of prices of items like iron and steel and cotton textiles reflecting improvement in the industrial climate. Domestic prices of metals and fertilisers weathered the volatility of international price movements (Table 3.11).
(Per cent) |
|||||||
|
|
|||||||
Group/Item |
Weighted |
Annual Point-to-Point Inflation |
|||||
Weight |
contribution to |
2002-03 |
2001-02 |
2000-01 |
|||
overall Inflation |
|||||||
in 2002-03 |
|||||||
|
|
|||||||
1 |
2 |
3 |
4 |
5 |
6 |
||
|
|
|||||||
All Commodities |
100.0 |
100.0 |
6.5 |
1.6 |
4.9 |
||
I. |
Primary Articles |
22.0 |
21.6 |
6.1 |
3.9 |
-0.4 |
|
a. |
Food Articles |
15.4 |
2.2 |
0.8 |
5.2 |
-2.8 |
|
i) Cereals |
4.4 |
2.9 |
4.0 |
0.8 |
-5.5 |
||
ii) Fruits and Vegetables |
2.9 |
-0.6 |
-1.2 |
14.4 |
-2.9 |
||
b. |
Non-food Articles |
6.1 |
19.3 |
22.1 |
0.6 |
6.0 |
|
i) Fibres |
1.5 |
4.9 |
26.5 |
-17.9 |
7.4 |
||
ii) Oil Seeds |
2.7 |
10.6 |
30.0 |
6.8 |
2.8 |
||
iii) Sugarcane |
1.3 |
2.8 |
11.5 |
6.2 |
10.5 |
||
II. |
Manufactured Products |
63.7 |
44.3 |
5.1 |
0.0 |
3.8 |
|
a. |
Food Products |
11.5 |
14.0 |
8.7 |
0.3 |
-3.1 |
|
i) Sugar |
3.6 |
-7.0 |
-15.0 |
-3.8 |
-0.9 |
||
ii) Edible Oils |
2.7 |
8.5 |
27.4 |
12.5 |
-4.8 |
||
iii) Oil Cakes |
1.4 |
8.8 |
40.3 |
15.0 |
0.4 |
||
b. |
Chemical and Chemical Products |
11.9 |
8.2 |
4.2 |
2.5 |
4.0 |
|
of which: Fertilisers |
3.7 |
1.2 |
2.1 |
3.6 |
3.4 |
||
c. |
Cement |
1.7 |
0.3 |
1.1 |
-4.7 |
20.3 |
|
d. |
Basic Metals, Alloys and Metal Products |
8.3 |
7.3 |
6.6 |
-0.9 |
3.2 |
|
of which: Iron and Steel |
3.6 |
4.4 |
9.2 |
0.0 |
1.3 |
||
e. |
Machinery and Machine Tools |
8.4 |
0.5 |
0.5 |
2.0 |
9.5 |
|
f. |
Transport Equipment and Parts |
4.3 |
-0.6 |
-0.9 |
1.3 |
5.8 |
|
III. |
Fuel Group |
14.2 |
33.9 |
10.8 |
3.9 |
15.0 |
|
a. |
Mineral Oils |
7.0 |
29.7 |
18.4 |
1.2 |
17.0 |
|
b. |
Electricity |
5.5 |
4.2 |
3.4 |
9.2 |
11.5 |
|
Food Items (composite) |
26.9 |
16.2 |
3.9 |
3.3 |
-2.9 |
||
Agro-based Manufactured Products # |
28.3 |
27.4 |
7.4 |
-1.4 |
1.3 |
||
Non-food Items (WPI excluding Food) |
73.1 |
83.8 |
7.5 |
1.0 |
8.0 |
||
WPI excluding Food Items and Mineral Oils |
66.1 |
54.2 |
5.6 |
1.0 |
6.7 |
||
|
|
|||||||
Memo Items |
|||||||
|
|
|||||||
Average WPI Inflation |
3.4 |
3.6 |
7.2 |
||||
GDP Deflator |
2.3 |
3.4 |
4.3 |
||||
Services in CPI-IW @ |
16.4 |
21.5* |
5.3 |
4.9 |
5.6 |
||
Housing in CPI-IW |
8.7 |
13.2* |
5.4 |
12.9 |
6.4 |
||
|
|
|||||||
# |
Includes manufactured food products, beverages, tobacco and tobacco products, textiles, wood and wood products, paper and paper products, leather and leather products and rubber and plastic products. |
||||||
@ |
Miscellaneous Group in the Consumer Price Index for Industrial Workers (CPI-IW). |
||||||
* |
Weighted contribution to CPI-IW Inflation in 2002-03. |
||||||
3.29 Edible oils and oil cakes recorded the highest order of price rises. Shortfalls in the domestic production of oilseeds necessitated imports of edible oils which account for about one-half of domestic demand. Consequently, the domestic prices of edible oils displayed close co-movement with international prices of edible oils, indicative of the import content of domestic inflation (Chart III.11).
3.30 Underlying inflation (measured by average WPI) during 2002-03 was dominated by the behaviour of the manufactured products group (Chart III.12). Within manufactures, edible oils, oil cakes and man-made fibres were the primary sources of inflation.
Consumer Price Inflation
3.31 Consumer price inflation, measured by the annual variation in the average consumer price index for industrial workers (CPI-IW) eased during the year, reflecting lagged adjustments to agricultural supply disturbances (Chart III.13 and Appendix Table III.13). Disaggregated commodity price movements within the CPI-IW basket broadly mirrored the wholesale price inflation. Food prices recorded moderate increase, primarily due to a sharp rise in the prices of oils and fats which edged up from 9.6 per cent at the beginning of the year to 34.9 per cent by March 2003. Housing inflation eased while services inflation (proxied by the broad miscellaneous group) was steady at around 5 per cent. The rise in international oil prices had a significant impact on retail inflation as the major part of domestic consumption is met through imports. During 2003-04 so far (upto June), consumer price inflation on a year-on-year basis was 4.4 per cent, marginally higher than that of 4.2 per cent a year ago.
3.32 The 1990s have been widely regarded as the era of price stability. Beginning in the early part of the decade, developed and developing countries alike experienced a distinct ebbing of inflation. The attainment of sustained price stability is attributed to structural changes in the global economy, productivity gains, favourable supply shocks as well as a credibility bonus to the institutional reform of monetary policy. More than independence, it is legitimacy and accountability that has underpinned the reputational eminence of monetary authorities. Increasingly, monetary authorities have set up internal policy analysis procedures within a precise framework in which inflation expectations are communicated to the public, including a thorough evaluation of the adjustment paths of policy action through which deviations of actual inflation from expectations would be corrected. Understanding the formation of inflation expectations has implications for the efficiency of forward-looking monetary policy. Country practices reveal a wide diversity in the efforts to obtain a reliable gauge on inflation conditions (Box III.4).
Outlook
3.33 Upside risks from international oil prices for domestic inflation began to ebb with fortnightly downward revisions in domestic mineral oils (POL) prices beginning April 16, 2003. Point-to-point WPI inflation which had spurted to 6.9 per cent on May 3, 2003 caused by the one-time upward revision in electricity prices and the transporters' strike edged down below 4.0 per cent by August 2, 2003. Supply side effects on prices of primary articles due to transport disruptions in April 2003 turned out to be transient and impacted mainly on prices of fruits and vegetables. Driving inflation down was the softening of POL prices and manmade fibres. POL prices fell by 7.5 per cent and manmade fibres by 5.2 per cent between end-March 2003 and August 2, 2003. Taken together, their weighted contribution to point-to-point inflation fell sharply from 35.5 per cent at the end of March to 15.6 per cent on August 2, 2003. More information on the progress and spread of rainfall needs to be juxtaposed with the July forecasts of a normal monsoon (98 per cent of the long period average) in the approaching season before a short-term prognosis of the effects on prices of primary articles can be made. Accordingly, prices of manufactures, which account for over two-third of inflation in terms of WPI, hold the key to the short-term inflation outcome.
3.34 International prices of vegetable oils and meals had firmed up in the first half of 2003 as global stocks of oil and fats declined for the third consecutive year on account of production shortfall caused by adverse weather. These have eased somewhat in recent weeks on expectations of higher production. Palm oil imports rose sharply following the reduction in customs duty on refined palm oil from 92 per cent to 70 per cent on April 30, 2003. These imports have restrained edible oil prices to some extent. While cotton prices have firmed up, the recent rationalisation of the duty structure and retention of excise exemptions in the Union Budget 2003-04 is expected to keep cotton textile prices range bound ahead of the dismantling of the quotas. Price competition from man-made textiles is a growing threat to low value addition cotton-based industry. Globally, the steel industry is grappling with over capacity. Nevertheless, with export demand picking up, steel prices in India are expected to remain firm in the short term. India is a price taker in petrochemicals including manmade fibres and the domestic market is closely linked to global developments. Accordingly, petrochemical price movements in India are expected to be capped by imports. Urea, di-ammonium phosphate and single super phosphate are widely used in India as fertiliser. There is an upsurge in the international prices of phosphatic fertilisers though the outlook remains vulnerable to wide price fluctuations. Urea prices continue to be controlled. Based on the evolving international environment, the movement of key international prices and the underlying monetary conditions in India, inflation in India is expected to be in the range of 5.0 to 5.5 per cent as projected in the Monetary and Credit Policy for 2003-04.
3.35 Monetary conditions in 2003-04 are expected to be dominated by external capital flows. During 2003-04 so far (up to August 8), the net foreign assets of the banking sector rose by Rs.32,997 crore. The demand for non-food bank credit is likely to be maintained on the rising trajectory which began in early 2002, given the positive investment climate and the anticipation of a recovery in agricultural activity. Notwithstanding the projected expansion of non-food credit (15.5 to 16.0 per cent) and the size of borrowings of the Government sector, capital inflows, the release of resources through the CRR cut in June 2003 and lower order of food credit growth, monetary and liquidity conditions would facilitate a soft and flexible interest rate regime, consistent with the monetary policy stance.

এই পৃষ্ঠাটো শ্বেয়াৰ কৰক:


ভাৰতীয় ৰিজাৰ্ভ বেংক মোবাইল এপ্পলিকেষ্যন ইনষ্টল কৰক আৰু নৱীনতম বাতৰিৰ প্ৰৱেশাধিকাৰ পাওক!


