 IST,
IST,
Chapter I : Macroeconomic Outlook
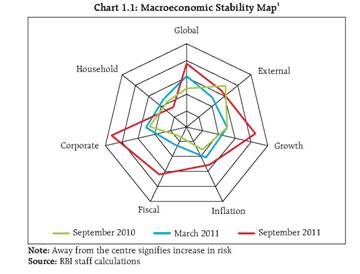
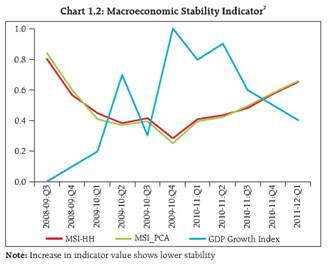
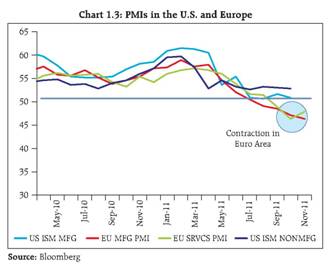
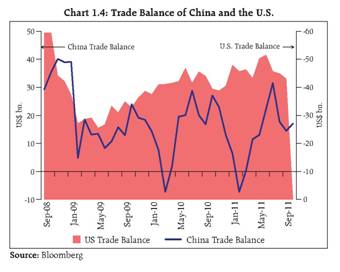
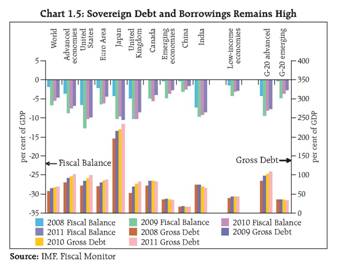
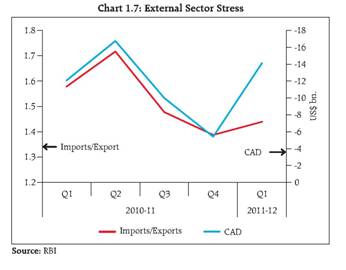
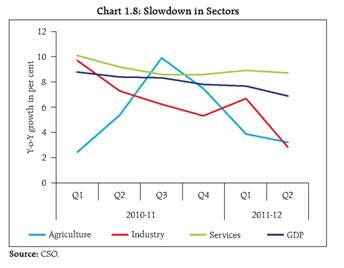
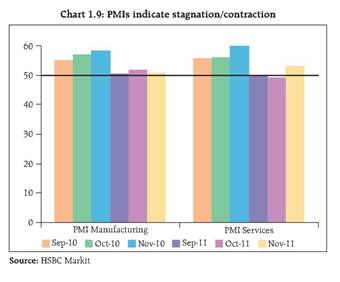
Global risks have increased since the publication of the third FSR in June 2011. Heightened uncertainties arising from the deepening sovereign debt crisis in the Euro Area and slowdown in the US pose downside risks for the global economy and for India through trade and finance channels and, therefore, need to be monitored closely. External sector risks are likely to increase. Elevated oil prices also pose downside risks to global recovery and have significant implications for domestic inflation. The profit margin of the corporate sector has dipped, indicating its reduced pricing power in the face of rising raw material and interest costs, domestic and global. The rise in housing prices, despite some moderation, remains firm. Although some deterioration has been observed in the asset quality, delinquency in the housing sector remains substantially below the peak levels reached after the global crisis. Overall, since the last assessment in June 2011, there has been a rise in risks originating from the macroeconomic environment. Macroeconomic risks have increased since the last assessment 1.1 Since the assessment in June 2011, the risks emanating from the macroeconomic environment have increased (Chart 1.1). The global slowdown and sovereign debt crisis have led to deterioration of global risks and external sector vulnerability. Domestic growth has weakened, while inflation risks have increased due to elevated energy prices at the global level. The fiscal outlook has deteriorated in view of the lower than expected collection of revenue in the first half of the current year. Declining profit margins have increased the stress in the corporate sector. The household sector, however, has recorded some improvement in risks due to lower leveraging. Nevertheless, overall macroeconomic stress has been increasing but remains below the levels reached in the aftermath of the global crisis (Chart 1.2). Global recovery looks more protracted 1.2 Contrary to earlier expectations, recovery in advanced economies may take longer. Since September 2011, different agencies have revised downwards their growth forecasts for the US and the Euro Area. The US economy is struggling with sluggish growth and protracted unemployment. Downside risks have increased with fiscal uncertainty, housing market weakness, renewed financial stress and subdued business and consumer sentiment. High public deficits and debt, lower potential output and rising market tensions are weighing on growth prospects in the Euro Area. Weak household balance sheets, high unemployment and persistent housing market weakness has led to subdued private consumption and easing in activities. The recent European Union (EU) summit has failed to reverse the negative market sentiments. Growth in China is also expected to be lower than what was anticipated earlier. Forward looking indicators like Purchasing Managers' Indexes (PMIs) have been declining, though there was a marginal uptick in case of the manufacturing sector in the US where better prospects of recovery have been further reinforced by early Christmas shopping data and a drop in the unemployment rate. By contrast, the European PMI has slid down to contractionary level providing strong indications of a recession in Europe in 2012, which many forecasters also see. (Chart 1.3). 1.3 There has been some deterioration in the outlook of sovereign ratings. A series of sovereign rating downgrades among Euro Area countries is expected in the near future. Some of them are expected to be further downgraded in the longer term. This is likely to adversely impact the confidence, raise the cost of borrowing for these economies and prolong the economic slowdown. Global imbalances, a major cause of crisis, continue to persist at high levels 1.4 As mentioned in the last Report, the structural causes of global imbalances have not been fully addressed. The trade balance of China remains mostly in high surplus zone. The trade deficit of the US, after some moderation in the aftermath of the crisis, has been increasing and continues to be very large (Chart 1.4). The process of rebalancing has significant implications for the growth of trade and the global economy. '... successful rebalancing of the Chinese economy .. .would generate positive spillovers for the global economy.'3 High sovereign debt persists ... may dampen global recovery further 1.5 Both the sovereign debt as well as the borrowings of several advanced economies continue to rule at high levels (Chart 1.5). The interaction between markets and governments has become more 'complex and more dangerous.'4 At the same time, the resolution of sovereign debt problems appears to be more difficult and may take longer than what was originally envisaged. In view of the prolonged slowdown, reduction of debt levels would entail structural measures which, in some cases, may not be politically expedient. Both the indebted and the 'bailing-out' countries have to overcome some political resistance to take steps towards effective resolution of the problem and prevent credibility from weakening. At the same time, the high debt levels restrict fiscal manoeuvrability in countering the effects of possible slowdown at the current juncture. For sovereign debt to be sustainable, economic growth has to be strong. On the other hand, fiscal consolidation measures, whenever implemented, may have adverse implications for growth and further lower the demand at the global level in the short-term. According to IMF, a one percentage point cut in deficit could lower growth by about half percentage point over two years. However, reduction of debt raises output over longer term by bringing down real interest rates and making room for tax cuts5. Credible fiscal consolidation measures may have positive effects even in the short-run due to improvement in confidence. ... leading to rise in risks in the external sector 1.6 The adverse global developments are reflected in the external sector transactions in India. The external sector vulnerability index (based on the movements in current account deficit, ratio of current payments to current receipts, share of short-term debt to total debt and ratio of debt stock to GDP) has recorded an uptrend in recent times indicating aggravation of risks from the external sector (Chart 1.6). 1.7 Both the IMF and the WTO have projected a lower growth in world trade volume, reflecting weakening global demand. Though the depreciation of the Rupee will cushion Indian exports a bit, exports may moderate in second half of 2011-12, if slowdown in advanced economies, in turn, weakens growth prospects of emerging market economies (EMEs) which have been getting prominence as India's export destinations, Similarly, receipts on account of invisibles, particularly the software sector, will depend on the severity of the slowdown in the advanced economies. On the other hand, higher oil prices and sharp increase in imports of bullion, machinery and electronics have resulted in continued buoyancy in imports. Recent data indicate further widening of the trade balance. Consequently, CAD which increased during Q1 of 2011-12 (Chart 1.7) is expected to widen further. Larger CAD would necessitate higher capital inflows. In this context, the impact of risk aversion due to downward risk to economic and financial conditions in the US and Euro Area would be critical, particularly for FII flows to India. 1.8 Though the twin deficits are expected to widen during the current year, it is the global developments rather than fiscal slippage that is contributing to the widening of CAD. Nevertheless, fiscal consolidation could contribute to correction of CAD to some extent. Pace of domestic growth takes a dip 1.9 Domestic growth is expected to be adversely affected by transmission of the impact of the global slowdown and sovereign debt problems through trade and financial linkages and the cumulative impact of rising domestic interest rates. The industrial sector, in particular, may get adversely impacted by lower demand, infrastructural constraints and higher cost of both external and internal credit. Further, increased market borrowings by the Government may crowd out private sector investment. 1.10 Though the services sector recorded healthy growth in Q2 of 2011-12, slowdown in the industrial sector and deceleration in private consumption may adversely impact its growth going forward (Chart 1.8). The PMIs for services sector in September and October 2011 ruled below 50, indicating contraction but has recorded some recovery in November, PMIs for the industrial sector has recovered marginally from its 30 month low in September 2011 (Chart 1.9). The moderation in the manufacturing PMI was primarily due to a slowdown in new business received and contraction of export orders in September 2011. The momentum in the services sector eased further in October 2011 with continued decline in business activity and deceleration of new orders.
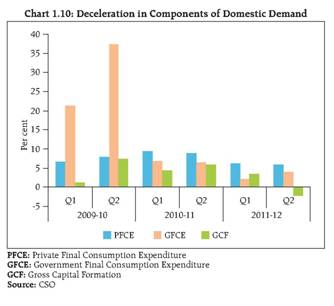
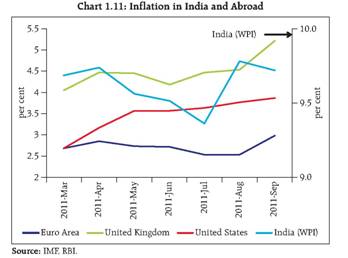
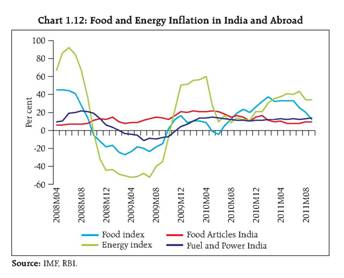
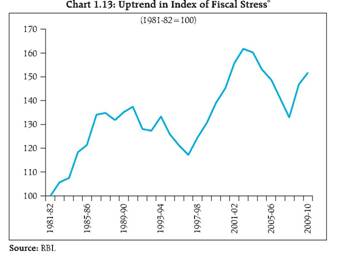
1.11 The Second Quarter Review of Monetary Policy 2011-12 revised the baseline projection of GDP growth for 2011-12 downwards from 8.0 per cent to 7.6 per cent, largely on account of slowing global growth and the slackening of investment demand, reflecting slower clearance and execution of projects, concerns about inflation and rising interest rates. Domestic demand too records deceleration 1.12 The prime driver of growth in India, especially during the crisis, was domestic demand which is showing some weakness in recent times. Its components, viz. private consumption, government consumption and investment, recorded deceleration in the first half of 2011-12 (Chart 1.10). In view of prolonged and slow global recovery, the sustainability of growth of the domestic economy hinges on resuscitation of domestic demand, especially investment, for sustained growth. ... while domestic inflation remains at elevated levels 1.13 The weaker global growth since Q2 has resulted in only a small correction in international commodity prices, particularly crude oil. Brent and Dubai Fateh prices (which comprise the Indian basket) have declined only modestly. Reflecting the above trend, headline measures of inflation remained above the comfort zones/targets in both advanced economies and EMEs. In the case of EMEs and India, domestic demand added to inflationary pressures (Chart 1.11). An analysis of component-wise inflation at the global level reveals that, while India has successfully moderated the volatility in the prices of energy and food, they remain at elevated levels (Chart 1.12). 1.14 The Second Quarter Review has observed that the inflation path will be shaped by both demand and supply factors, viz, extent of moderation in aggregate demand, behaviour of global crude prices, supply response in respect of those commodities where there are structural imbalances and fuller pass-through of petroleum and coal prices. Elevated inflationary pressures have started to ease from December 2011 and the baseline for WPI Inflation for March 2012 is projected at 7 per cent. However, uncertainties about sudden adverse developments remain and inflation risks continue to be high. 1.15 Exchange rate depreciation has inflationary implications through the increase in the cost of oil and other imported goods which form inputs in overall production. The impact of moderation in domestic demand on inflation could get offset by the widening of fiscal deficit. Further, the fiscal deficit may have current account widening implications which, in turn, may affect the exchange rate and have inflationary implications. Persistence of supply shocks, especially due to the periodic increase in petrol, diesel and minimum support prices, having cascading effect on the entire economy, seems to be neutralising the demand moderating impact of the monetary policy measures. Inflationary expectations, which continue to remain at high levels, is also causing stickiness in the downward movement of the price level. 1.16 From a longer term perspective, structural imbalances in agriculture, infrastructure capacity bottlenecks and distorted administered prices of key commodities like oil and coal pose upside risks to inflation. 1.17 Banks' asset quality comes under pressure due to the adverse impact of inflation on growth in addition to various other macro and sectoral drivers. Stronger the adverse output impact of high inflation, greater will be the asset quality concerns. Depending on the manner in which the monetary policy response and interest rate cycle change in response to inflation, asymmetric flexibility on asset and liability of banks could exert pressure on earnings. High inflation and higher policy interest rates could impact financial markets, particularly exchange rate, bond and stock markets. Due to mark-to-market accounting, depending on the bank specific exposures, pressure on earnings and need for higher capital and provisioning may also become a possibility. While low and stable inflation alone is not sufficient to promote macro-economic and financial stability, it continues to be an essential pre-condition. Rising fiscal stress adds to growth and inflation concerns 1.18 Fiscal stress has increased in the recent past and continues to rule at high level (Chart 1.13). The stress is likely to aggravate as the risks of fiscal slippage have increased during the current year. Slowdown in revenue collections and the potential rise in food, fertilizer and fuel subsidies may make attaining the budgetary target of fiscal deficit of 4.6 per cent of GDP for 2011-12 challenging. Revenue receipts during the first seven months of the fiscal year 20011-12 stood at 45.5 per cent of Budget Estimates (BE) as compared to 65.6 per cent in the same period of the previous year. During the first half of 2011-12, expenditures may come under pressure due to elevated inflation. Further, subsidies and interest payments increased sharply by 22.0 per cent and 19.2 per cent, respectively, over the corresponding period of the previous year, while the growth in plan expenditure was mere 4.8 per cent. The shortfall in plan expenditure, particularly capital expenditure has adverse implications for growth. Primary deficit during April-September 2011 has exceeded the annual targets while revenue and fiscal deficit during the first seven months account for over 79 and 74 per cent of their annual targets, respectively. The Government has announced increased market borrowings. The second batch of Supplementary Demands for Grants for 2011-2012 involving gross additional expenditure of `63,180 crore with net cash outgo at `56,848 crore was announced in November 2011. Indian sovereign debt, however, is sustainable as it is held mostly by domestic institutions, its average maturity is high and costs less than the rate of growth of GDP.
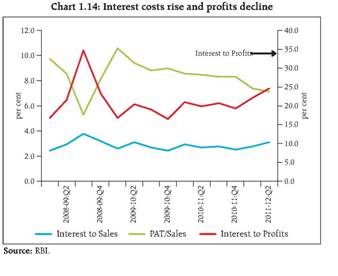
1.19 A number of factors seem to hinder fiscal consolidation at the current juncture. Deceleration of growth and demand would adversely impact the growth of direct and indirect tax collections. With sticky oil prices and increase in Minimum Support Prices (MSP) of key rabi crops, subsidy expenditure is also likely to be under pressure. Weak market conditions may also jeopardise the divestment plan. Fiscal slippage could increase the interest cost of borrowing of the government which, in turn, could have a feedback effect on the fiscal deficit and stress. Effect of rising raw material and interest costs as well as reduced pricing power is seen in the declining margin of the corporate sector 1.20 Corporate margins have been declining in the first two quarters. Ratio of profit after tax (PAT) to Sales declined by over 200 basis points during Q1 and Q2 of 2011-12 as compared to their level in the last quarter of 2010-11, reflecting the rising input and interest costs and deceleration in domestic demand (Chart 1.14). The rising share of interest cost in sales as well as gross profits so far, implies that the impact of monetary tightening on the margins of the corporates are now becoming visible.
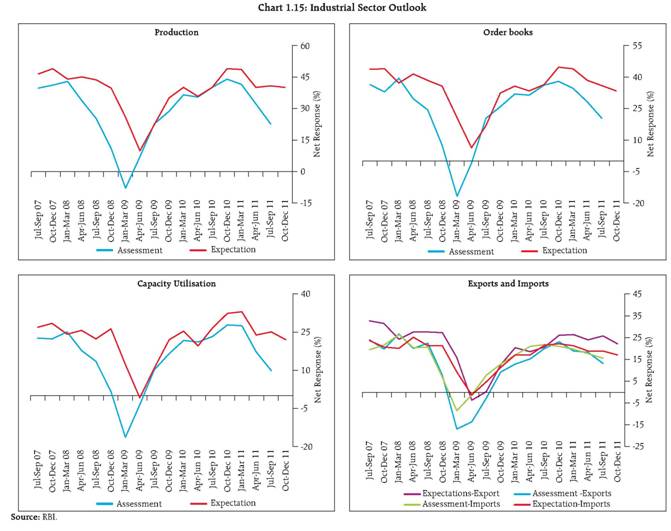
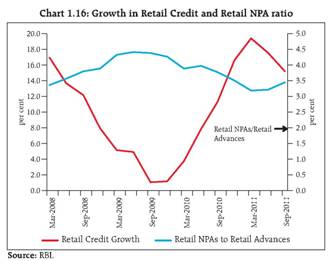
1.21 The outlook of the firms shows signs of weakness which can be attributed to rise in input prices, interest rates, slackening demand and some infrastructure constraints. Servicing of loans by them, therefore, may come under stress. There was some moderation in demand conditions as reflected in production, order books, capacity utilisation, imports and exports in the RBI Industrial Outlook Survey (Chart 1.15). The moderation was more pronounced for small sized companies. Even as cost of credit kept rising in sync with prices, credit to household sector and quality followed suit... only marginally 1.22 The impact of inflation and rise in cost of credit on the growth in retail credit is marginal. Part of the deceleration in retail credit, however, can be attributed to the base effect. There has been some deterioration in asset quality but NPA ratio remains substantially below the peak levels reached in 2009 and 2010 (Chart 1.16).
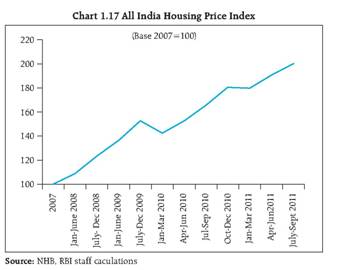
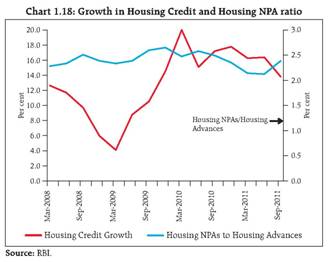
... and housing prices continue to rise 1. 23 All-India housing price index based on weighted average of Residex of 15 cities indicate firmness in housing price7. Notwithstanding rising cost of credit and reports of lower sales, house prices continued to rise during the first half of 2011-12 (Chart 1.17). 1.24 In response to the rise in housing prices and interest cost, the deceleration in housing credit was more significant. There has been some deterioration in asset quality but the NPA ratio in case of housing sector too remains significantly below its earlier peaks of 2009 and 2010 (Chart 1.18). Concluding Remarks 1.25 Global uncertainties have increased with prolongation of slowdown, aggravation of sovereign debt and lack of credible resolution mechanism at the current juncture. The impact of these global developments is felt in India through trade, finance, commodity and confidence channels. Adverse global developments along with domestic factors such as, persistent food inflation, high energy prices, capacity constraints in certain sectors and slackening investment activity are likely to pose continuing challenges for sustaining a high growth. Both industrial and services sectors are exhibiting signs of weakness. The adverse impact on trade along with deceleration in invisibles, higher oil imports and buoyancy in imports of bullion, machinery and electronics is also reflected in the widening of CAD. 1.26 Fiscal slippages during the first half of the year added to the fiscal stress in the economy. Growth slowdown, increase in MSP of some crops, high global crude prices, elevated inflation, unfavourable market conditions for disinvestment and high interest rates make fiscal consolidation very challenging. 1.27 Inflation and inflation expectations continue to rule at high levels and remain a primary concern at the current juncture with upside risks from structural imbalances in agriculture, infrastructure capacity bottlenecks, distorted administered prices of key commodities, exchange rate depreciation, and widened fiscal deficit. Elevated inflationary pressures have started to ease from December 2011 and the baseline projection for WPI inflation for March 2012 is estimated to be at 7 per cent. However, uncertainties about sudden adverse developments remain. 1.28 Reflecting the deterioration in global and domestic outlook, the corporate sector has been showing signs of weakness and the outlook has moderated. However, the continued high growth in retail credit indicates the strength of the household sector. Some deterioration in asset quality has been observed but NPA ratio remains substantially below the peak levels reached in 2009 and 2010. 1.29. Overall macroeconomic stress has been increasing but seems to be still below the levels reached in the aftermath of the global crisis. 1 For a brief on the methodology used for construction of the Macroeconomic Stability Map, please see Annex. 2 The relationship of household sector with the quality of assets in the banking sector is not clear and in view of low share of credit to household, the sector has not been included in Macroeconomic Stability Indicator currently. The other individual risks specified in Chart 1.1 are combined into a single Macroeconomic Stability Indicator using two methodologies. First, each risk is given equal weight in the index (MSI-HH). In the second method, the weights are derived using Principal Component Analysis (MSI_PCA). Both the methodologies give similar results. 3 Christine Lagarde, MD, IMF ," Challenges and Opportunities for the World economy and the IMF," C. Peter Series on International Economics, July 26,2011 4 Keynote speech by Christian Noyer, Governor of the Bank of France and Chairman of the Board of Directors of the BIS, at the CIGS (The Canon 6 Based on methodology suggested in Baldacci, Emanuele, James McHugh and Iva Petrova, 2011, "Measuring Fiscal Vulnerability and Fiscal Stress: A Proposed Set of Indicators," IMF Working Paper 11/94 and Baldacci, Emanuele Iva Petrova, Nazim Belhocine, Gabriela Dobrescu, and Samah Mazraani, 2011, "Assessing Fiscal Stress" IMF Working Paper 11/100. Three indicators, namely gross primary balance, gross fiscal deficit and combined outstanding liabilities of Centre and State Governments have been used in the present exercise 7 Residex is the city-wise housing price index published by NHB. City-wise housing credit has been used as the weights in construction of all India index primarily for two reasons: (a) the movements of housing prices are more pronounced, thereby highlighting changes more clearly than when other weights (e.g. population, number of households, total deposits/credit) are used, and (b) performance of the housing loans is the main subject of concern from the perspective of financial stability, |
পৃষ্ঠাটো শেহতীয়া আপডেট কৰা তাৰিখ:


