 IST,
IST,
Chapter III : Financial Institutions: Soundness and Resilience
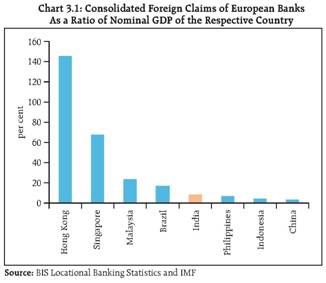
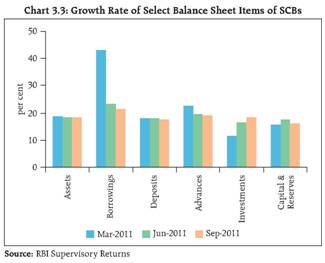
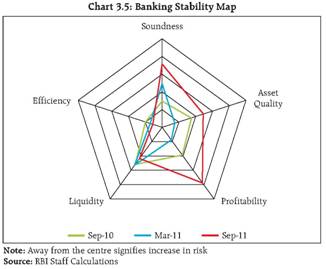
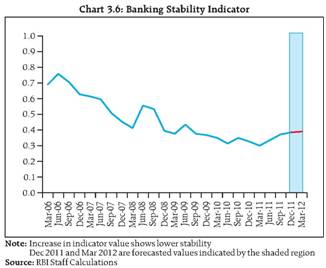
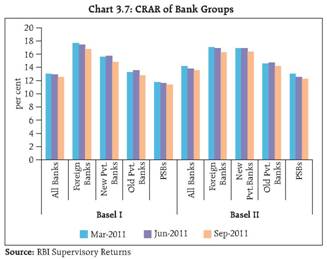
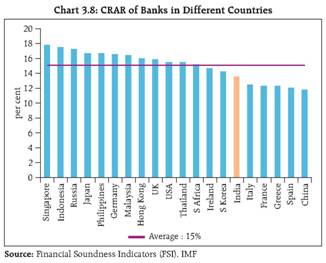
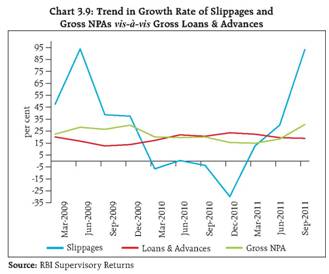
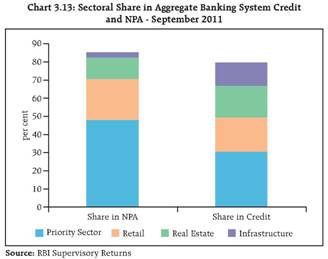
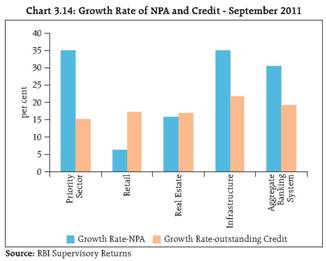
The current heightened global uncertainty on account of lingering Euro Zone crisis has implications for emerging market economies (EMEs) including India. The recent regulatory prescriptions for European banks have brought in fears of deleveraging. The direct impact on Indian banks, though, is expected to be limited. The banking system remained sound with CRAR and core CRAR well above the regulatory minimum and NPA ratios that compared favourably with the major advanced countries as well as peer EMEs. Continuous decline in CRAR and deterioration in asset quality, however, indicated that the risks were rising for the banking sector; even as credit growth decelerated and slippages outpaced credit growth. The major sectors that contributed to the increasing trend in NBAs were the priority sector, retail, real estate and infrastructure. In the infrastructure segment, the power and telecom sectors saw increased impairments and restructuring. The banking stability map and indicator also depicted increase in vulnerabilities in the Indian banking sector. Strain on asset quality was evident in the case of urban and rural co-operative sectors as well as NBFCs. Tension junds have been covered for the first time in FSR and illustrates the countervailing role played by these funds. Interconnectedness between the insurance and banking sectors could pose concerns. A number of single factor sensitivity stress tests were conducted to test the resilience of the financial system. The stress test results indicated that the system would be able to withstand a range of risk specific and sector specific shocks. Sovereign risks and bank balance sheets caught in a vicious feedback loop 3.1 Concerns over sustainability of sovereign debt levels as well as lower growth prospects in US and Europe, have weighed down the global banking system, in the period since the previous FSR. Sovereign debt and banking sector problems in the Euro area have become more persistent than expected, even as the European debt crisis spreads from the peripheral regions to the core. The spill-over of sovereign risks to the banking sector tends to get amplified through the network of highly interconnected and leveraged financial institutions. 3.2 There are several channels of contagion from sovereigns to banks. Firstly, increase in sovereign risk causes losses on banks' government bond holdings, thereby weakening their balance sheets. Banks have been raising their level of sovereign bond holdings of late in view of the preferential treatment for such securities under the liquidity standards of Basel III. Secondly, in repo markets, sovereign debt accounts for the majority of collateral, and participants are sensitive to changes in its riskiness. Rating downgrades, if large enough, can exclude a government's bonds from the pool of eligible collateral. Moreover, counterparties increase the haircuts on such securities, thus, raising the cost of borrowings. The close connection between sovereign credit risk and banking sector represents a substantial macroeconomic threat for the global economy, as the effects of sovereign debt problems in one country spill over to the banks in other countries through banks' investments in foreign sovereign debt and exposures to domestic banks and assets in the affected foreign country. 3.3 The recent regulatory prescription1 raising the capital requirements of European banks could lead to significant deleveraging. As per the final estimates released by the European Banking Authority, €114,7 billion is the amount of capital the region's banks need by June 30, 2012.Considering the prevalent conditions of the equity markets, banks will find it difficult to raise capital from the market. Further, most governments are not in their best financial health to inject fresh funds. Sale of assets could prove counterproductive as the losses on their sale would tantamount to further erosion in regulatory capital. Hence, the banks are more likely to scale down their credit portfolio aggressively which would hurt the real economy and potentially worsen the debt crisis in Europe. 3.4 As the European banks deleverage, they may try to export the pain of deleveraging further afield, including to EMEs. This could lead to a downstream impact on India, since European banks' claims on India constituted 8.6 per cent of India's GDP (Chart 3.1). The impact on Indian Banks, especially direct impact, however, is expected to be limited (Box 3.1). Scheduled Commercial Banks (SCBs) 3.5 The balance sheet size of the SCBs increased by 18.5 per cent (year-on-year) as at end September 2011, marginally lower than the growth of 18.8 per cent as at end March 2011. The credit growth (year-on-year) remained strong at 19.2 per cent as at end September 2011, though it had decelerated from the robust growth of 22.6 per cent as at end March 2011. This credit growth was attained against a nominal GDP growth of 16 per cent during the secound quarter of 2011-12. Deposits continued to constitute close to 80 per cent of total liabilities of the banking system with the share of CASA (current account and savings account) in total deposits being around 33 per cent as at end September 2011, lower than the share of about 35 per cent as at end March 2011. The deposits grew by 17.6 per cent (year-on-year) as at end September 2011, marginally lower than the 17.8 per cent growth rate as at end March 2011. Consequently, the credit to deposit (CD) ratio declined to 73.4 per cent as at end September 2011 from 74.3 per cent as at end March 2011 (Chart 3.3).
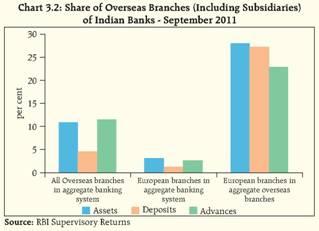
Box 3.1: Euro Zone Crisis and Impact on Indian Banks The first-order impact of the on-going Euro-zone debt crisis on Indian banks may be limited, on account of negligible exposure to the vulnerable countries. Firstly, there are only 37 branches and three subsidiaries of Indian banks in the European Union, none of which are in Portugal, Italy, Greece and Spain. Out of the 37 branches, 30 branches are in the UK, 3 branches in Belgium and 2 each in Germany and France while all of the 3 subsidiaries are in the UK. Their combined share in the aggregate banking sector assets stood at 3 per cent as at end September 2011 (Chart 3.2).
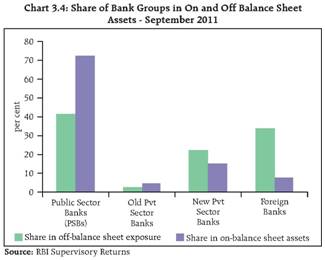
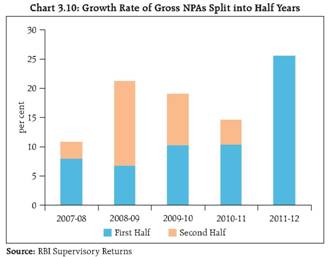
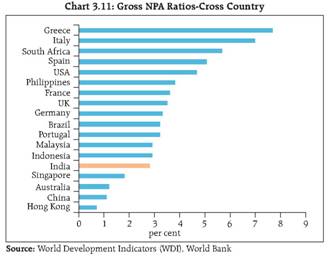
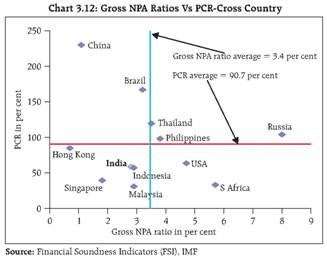
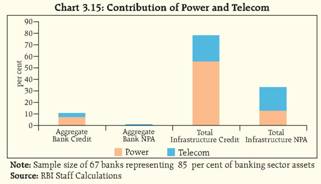
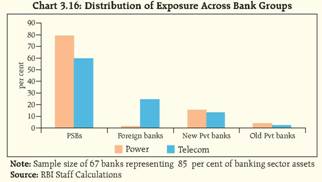
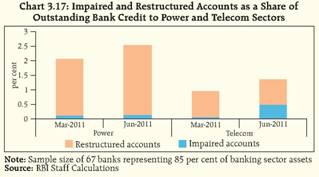
Secondly, none of the Indian banks have any exposure to bonds issued by Portugal, Greece and Spain while exposures to Italian bonds are negligible. Outside these countries, investment exposure (of a sample of the major Indian banks) to banks in Ireland, Germany and France were not significant, even if exposures to corporates in Germany and France are added. Thirdly, outstanding nostro balances of Indian banks maintained with banks in Europe have been falling over the last few months. Funding dependence of overseas branches of Indian banks (sample of five major banks) on European entities, except for UK, is also not very significant. There could, however, be second-order impact on the Indian banks through various channels including trade. In the event of the European crisis worsening through contagion and in consequence, global financial markets, especially in Europe freezing, funding constraints for Indian bank-branches operating overseas may emerge. Besides, the cost of borrowing may also rise. Some signs of market tightness are, in fact, already visible. In such a case, both banks and corporates could face challenges in refinancing their foreign currency liabilities. In addition, domestic liquidity (of which the banking sector is a major provider) would need to fill in to refinance the shrinking overseas debt of Indian firms. This has been discussed in detail in Chapter II of this Report. 3.6 The off-balance sheet exposures of the banking sector continued to increase as at end September 2011. Across the bank groups, foreign banks continued to hold a disproportionate share in off-balance sheet exposures vis-a-vis their on-balance sheet size (Chart 3.4). Increasing derivatives exposure between banks has the potential to cause systemic disruptions in stress scenarios, as discussed in Chapter IV of this Report. Banking Stability Map and Indicator2 Vulnerabilities in the banking sector increase... 3.7 The risks to banking sector have increased since the previous FSR. The banking sector faced profitability pressures due to higher funding costs and asset quality pressures due to a slowing economy. This is testified by the Banking Stability Map which revealed a dimensional increase in risks emanating from soundness, profitability and asset quality. Though the soundness indicators showed a relative deterioration vis-a-vis the position in previous periods, the ratios continue to remain well above the regulatory requirements. Similarly, an increase in vulnerability in the banking sector was indicated by the rise in the quarterly series of the Banking Stability Indicator starting from the quarter ended June 2011. Further, a forecast of the Indicator for the next two quarters shows a continuing, albeit marginal, deterioration in the stability of the banking sector (Charts 3.5 and 3.6). ...as capital slides due to disconnect between rate of capital augmentation and risk profile 3.8 The Capital to Risk Weighted Assets Ratio (CRAR) and the core CRAR continued to slide, though they remained well above the regulatory minimum under both Basel-I and Basel II norms. CRAR fell from 14.5 per cent as at end March 2010 to 14.2 per cent as at end March 2011 and stood at 13.5 per cent as at end September 2011. Core CRAR dropped from 10.1 per cent as at end March 2010 to 10 per cent as at end March 2011 to 9.6 per cent as at end September 2011 A crosscountry comparison however, reveals that India lags behind its peer group countries in this respect (Charts 3.7 and 3.8). 3.9 Leverage ratio3 of SCBs exhibited a marginal decline from 6 per cent as at end March 2011 to 5.9 per cent as at end September 2011, though all banks except three operated with Tier I leverage ratio of greater than 4 per cent as against the Basel III requirement of a minimum of 3 per cent. ...and asset quality deteriorates since slippages outpace credit growth by a wide margin 3.10 Asset quality of SCBs has deteriorated. In fact, the deterioration in asset quality has been identified as the risk with the highest probability of occurrence by the respondents of the first Systemic Risk Survey (discussed in detail in Chapter V of this Report). The gross non-performing assets (NPA) ratio of SCBs has increased from 2.3 per cent as at end March 2011 to 2.8 per cent as at end September 2011. Similarly, the net NPA ratio has increased from 0.9 per cent as at end March 2011 to 1.2 per cent as at end September 2011, while slippage ratio increased from 1.6 per cent to 1.9 per cent between March to September 2011. 3.11 The growth rate (year-on-year) of NPAs at 30.5 per cent as at end September 2011 has outpaced credit growth of 19.2 per cent. Slippages (i.e. fresh accretion to NPAs) too have outpaced credit growth and grew at 92.8 per cent (year-on-year) as at end September 2011. An analysis of the growth rate of NPAs shows that the growth rate in the first half of 2011-12 at 25.5 per cent is more than triple the average growth rate of 7.4 per cent in the first half years during 2006-2011 (Charts 3.9 and 3.10). 3.12 Despite the recent spurt in NPAs, the impairment levels in Indian banks compare favourably with the banking sectors in both the major advanced countries as well as peer economies. The provision coverage ratio (PCR)4, howerver, has fallen short when benchmarked against the peer group average of 90.7 per cent. The PCR of the SCBs (excluding technical write-offs) was at 58.9 per cent as on June 30, 2011, which was slightly less than the level (59.4 per cent) where it was as on March 31,2011 (Charts 3.11 and 3.12). 3.13 The major sectors that contributed to the increasing trend in NPAs were priority sector, retail, real estate and infrastructure. Their combined share in gross NPAs of the banking sector stood at 85 per cent as at end September 2011. The contribution of priority sector and retail sector to aggregate NPAs of the banking system at 48 and 23 per cent, respectively, was lower than their contribution to total advances of the banking system at 31 and 19 per cent, respectively. Further, retail sector saw an increase in NPAs after a decreasing trend since March 2010 (Charts 3.13 and 3.14). In case of infrastructure and priority sectors, the growth rate of NPAs was much higher than that of their respective outstanding. In the infrastructure segment, though the NPAs as a ratio of outstanding remained low at 0.6 per cent, power and telecom sectors saw a rise in impairments and restructuring. However, going forward, if growth slows down, there could be further impact on the asset quality in this sector. The impact could be much pronounced in the power sector, especially due to the legacy losses in state electricity boards (Box 3.2). 3.14 There is an increased possibility of further deterioration in asset quality as deceleration in credit growth is expected on the back of a slowing economy. In this context, a reference can be drawn to the empirical study detailed in the previous FSR which revealed that strong credit growth was synonymous with improvement in asset quality, whereas slow down in credit growth was followed by increase in impaired assets. These trends could be further accentuated due to recent developments in sectors like power, telecom (discussed above) and aviation. A series of stress tests, however, indicate that the banking sector would be able to withstand NPA shocks, though a few individual banks could face difficulty in case of large shocks (paragraph 3.40 to 3.42). ... causing a dent in profitability 3.15 Higher provisioning requirements, consequent to higher non-performing assets and higher interest expenses have put pressure on the banks' profitability. 3.16 Interest income grew by 34.4 per cent (year-on- year) as at end September 2011, while interest expenses increased by 46.7 per cent. Net interest income (NII) increased by 15.5 per cent (year-on-year) in September 2011 as against 40.7 per cent growth in September 2010. Operating expenses too grew (year-on-year) at a rate faster than the non-interest income - 15.2 per cent as against 4.4 per cent, on account of decelerating fee income and trading income. Box 3.2 : Impairments and Restructuring Rise in Power and Telecom Sector Credit to the power and telecom sectors, as at end June 2011, constituted the major share of bank credit to infrastructure segment at 55 and 22 per cent, respectively. Their share in aggregate bank credit stood at around 7 and 3 per cent, respectively. In case of banks' exposure to power sector, the public sector banks (PSBs) accounted for the maximum share followed by new private sector banks, Similarly, in the telecom sector, PSBs held the majority exposure followed by foreign banks (Charts 3.15 and 3.16). Impairments and restructuring have increased in the power and telecom sector as at end June 2011. Restructured accounts in the two sectors together constituted 8.5 per cent of total restructuring in the banking sector as at end June 2011 compared to 5.0 per cent as at end March 2011. Similarly, impaired accounts as a share of aggregate banking sector NPAs had risen from 0,4 per cent to 1.0 per cent (Chart 3.17).
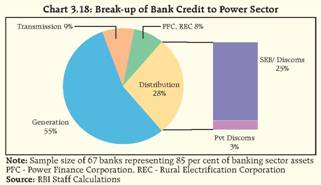
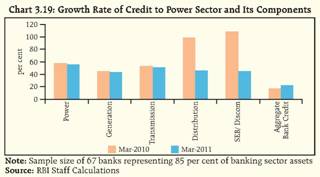
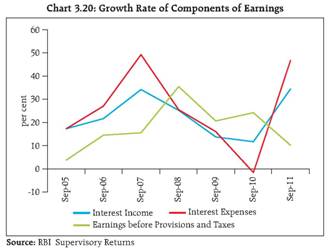
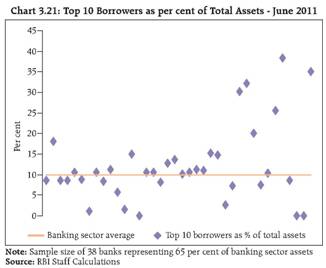
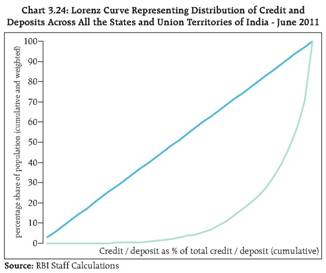
The growth rate of credit to power sector remained much higher than the aggregate banking sector's credit growth, though credit to state electricity boards (SEBs) have moderated sharply, In addition, concentration is discernible in credit to power sector as projects for power generation garnered 55 per cent share while SEBs/corporatised distribution companies (Discoms) accounted for 25 per cent (Charts 3.18 and 3.19). The risk that banks currently face on account of their exposure to power sector is due to two reasons: rising losses and debt levels in SEBs, and the shortage of fuel availability for power generation. As per the draft approach to the 12th Five Year Plan (August 2011), the current losses of distribution utilities before accounting for State subsidy stood at approximately `70,000 crore. The accumulated losses of SEBs indirectly impact the power producers since SEBs are the largest buyers of power in the country. Apart from poor financial health of SEBs, coal supply issues plague the power sector. Further, some projects are stalled due to environmental hurdles. Against this backdrop, there is anecdotal evidence of many lenders being cautious in extending loans to the sector. With losses among SEBs and coal / delay issues of power projects, high concentration of bank credit in power generation and distribution (as discussed above) is a matter of concern. 3.17 As a result, growth (year-on-year) in earnings before provision and taxes (EBPT) came down from 24 per cent in September 2010 to 10 per cent in September 2011 and profit after tax (PAT) increased by 2 per cent as against 31 per cent growth in September 2010. During the year 2010-11, EBPT increased by 21.8 per cent and PAT by 19.7 per cent. Profitability ratios also indicated deterioration amidst falling profit margins and rising provisions (Chart 3.20 and Table 3.1). 3.18 Going forward, further stress on earnings of banks could materialise on account of pressure on margins due to sustained high deposit rates. An important development in this context is the recent deregulation of savings bank deposit rates, which could elevate interest costs on retail deposits in the current high interest rate environment (Box 3.3). Higher provisions owing to further deterioration in credit quality of assets (as elucidated in paragraph 3.14) on the back of a possible slowdown in credit and the rising interest rate scenario could also adversely impact the bottom-line of the banks. Borrower concentration risk was prominent in small foreign banks 3.19 During the quarter ended June 2011, the top 10 borrowers, on an average, accounted for 10 per cent of total assets of the banking system. There were, however, a number of outlier banks (mostly small foreign banks) where the top 10 borrowers constituted up to 40 per cent of total assets, signaling some degree of concentration risks in these banks (Chart 3.21) Geographic concentration was significant for credit as well as deposits 3.20 Both credit and deposits are distributed in a skewed manner across the country. Demographic distribution explains this disparity to a certain extent, with regions having low population accounting for low credit and deposits. However, development is clearly the bigger reason in this regard. Maharashtra and NCR Delhi (National Capital Region) account for more than 43 per cent of total bank credit, while these two regions contribute to about 40 per cent of total bank deposits. The states which have both low credit and deposit counts are the North Eastern states, Jammu and Kashmir and Chattisgarh. The Gini coefficient with regard to credit distribution across the country over the last one year remained at a high level of 74 per cent while this coefficient for deposit distribution stood at 68 per cent (Chart 3.24).
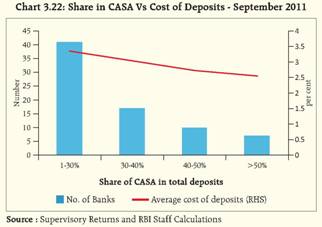
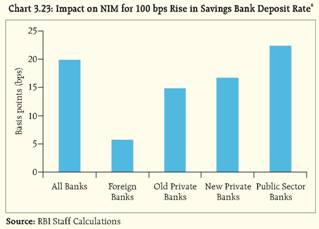
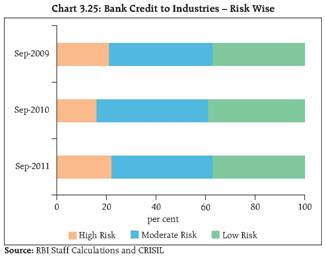
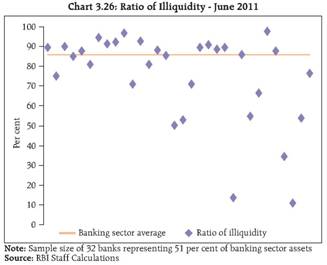
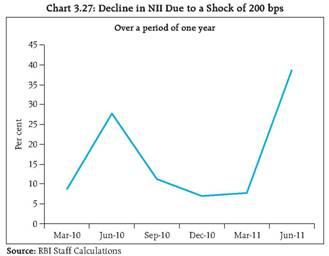
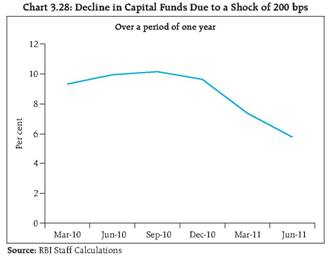
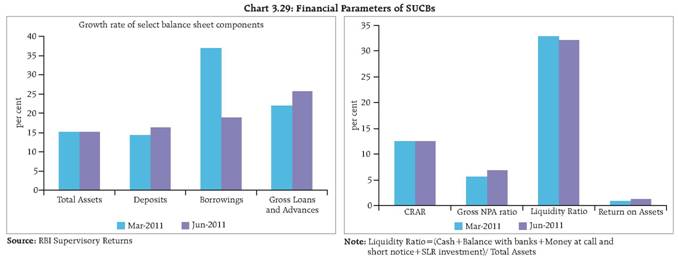
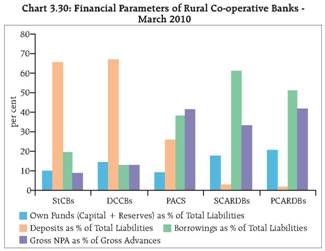
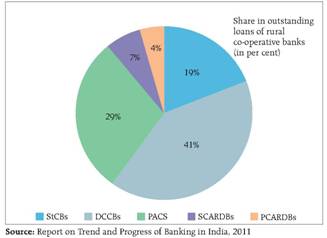
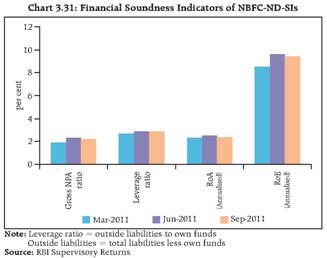
Box 3.3 : Deregulation of Savings Bank Interest Rates : an Analysis A major component of the financial sector reform process pursued by India was deregulation of a complex structure of deposit and lending interest rates. On the deposit side, the only interest rate that remained regulated was the savings deposit interest rate. The interest rate on savings bank deposits had remained unchanged at 3.5 per cent per annum since March 1, 2003. Cross-country experience shows that in most countries, interest rates on savings bank accounts have been deregulated and are now fixed by commercial banks based on the market interest rates. The changes in the interest rate of savings deposit were initiated by the Reserve Bank with banks being advised to pay interest on savings bank accounts on a daily product basis with effect from April 1, 20105. Later, in May 2011, the rates on such deposits were raised by 50 basis points to 4 per cent. Effective October 25, 2011, the Reserve Bank deregulated the savings bank account interest rates, wherein banks will have to keep a uniform rate of interest for savings accounts with deposits up to `1 lakh, while differential interest rates could be set for savings bank deposits over `1 lakh. This move is expected to improve the transmission of monetary policy. It is also expected to enhance the attractiveness of savings accounts and encourage thrift behaviour in the economy by bringing the savings deposit rate in sync with the changing market conditions. The opportunity cost between savings deposit and other liquid/ ultra short-term funds is expected to reduce henceforth, with savings rate mirroring prevalent market conditions. Though the penetration of such liquid and ultra short-term funds is limited and hence substitutability may be questionable; after deregulation, some churn in customers can be expected. A major attraction of savings deposits for banks is that it offers a low-cost source of funds. This is evident from the fact that bank groups with higher share of CASA deposits (of which savings deposit is a major component) enjoy relatively low cost of deposits (Chart 3.22). However, the distribution of CASA deposits among banks is not uniform. Competition in this space, which was non-existent hitherto, could rise as banks with low CASA ratio could rush to garner such deposits by raising rates. The effect is already visible as a few of the banks have raised savings account interest rate following the deregulation. The impact of such rate hikes on banks' profitability will need to be monitored carefully as already the banks' cost of funds have gone up and such rate hikes will put additional strain on the banks' net interest margin (NIM) (Chart 3.23). The effect, however, may be muted, based on the churn in customers and cost structure adopted by the individual banks. A corollary to the event would be that in a falling interest rate scenario, the savings bank deposit rates may also moderate accordingly. In a heightened competitive environment for retail deposits, banks are likely to introduce innovative savings deposits, as in Hong Kong, wherein new products such as combined savings and checking accounts and Hong Kong Interbank Offered Rate or HIBOR-linked savings products and tiered structures of interest rates were introduced following the deregulation of savings deposit interest rates. However, care needs to be taken to avoid the potential of mis-selling complex and opaque structured products which may not be suitable for the general public. Further, banks are likely to partially offset the impact of the increase in interest cost by levying transaction and servicing charges and thus pass on the additional costs to the customers. Concentration in high risk industries rises 3.21 The share of credit to high risk industries has registered an increase as at end of September 2011 - 22 per cent as against 16 per cent as at end March 2011. Within high risk sectors, commercial real estate garnered the major share (Chart 3.25). Liquidity risk was seen at a high level 3.22 The ratio of illiquidity (calculated as total loans, mandatory CRR and SLR and fixed assets as a percentage of total assets) stood, on an average, at a high level of over 80 per cent for the banking sector (Chart 3.26). A stress test analysis revealed that in severe stress scenarios, the SLR investments proved of help to banks enabling them to mitigate the liquidity pressure (paragraph 3.49 and 3.50). Yield curve risk was found to be low 3.23 The ratio in this regard (calculated as the total unmatched position across all time buckets as a percentage of Risk Sensitive Assets and Liabilities) declined from about 3 per cent in March 2011 to about 1.5 per cent in June 2011, signifying low risk. Interest rate risk in the banking book has risen 3.24 Interest rate risk in the banking book as measured from the earnings perspective (calculated as a percentage decline in NII due to a shock of 200 bps over a twelve month horizon) has risen from about 8 per cent in March 2011 to a high of almost 40 per cent as at end of June 2011. However, during the same period, based on the Economic value perspective (calculated as a percentage decline in capital funds due to a standardised shock of 200 bps over a twelve month horizon) an improvement was seen from a high risk zone of 10 per cent to a moderate risk of around 6 per cent (Charts 3.27and 3.28). 3.25 A stress test anlaysis has been done to examine the impact of different kinds of shifts in yield curve on the banking book, which revealed that most of the banks were able to withstand interest rate shocks (paragraph 3.43 and 3.44). Urban Co-operative Banks (UCBs) Strain on asset quality evident 3.26 The founding principles of co-operative banking i.e. mutual aid, coupled with the objective of promoting thrift and self help have helped to sustain the prominence of UCBs through the years. UCBs are seen as an important element in the programme of financial inclusion. With an objective of encouraging entry of new UCBs in regions where their representation is inadequate, a Committee was set up for studying the advisability of granting new urban co-operative banking licenses under Section 22 of the Banking Regulation Act, 1949 [As Applicable to Co-operative Societies (AACS)]. The recommendations of the Committee which included, inter alia, minimum entry point capital depending upon the location of the proposed UCBs, setting up two apex level organisations in the form of umbrella organisations to provide payment and settlement services and other services normally provided by central banks as well as IT and training, are under consideration of the Reserve Bank. 3.27 An analysis of the scheduled UCBs (SUCBs), comprising 43.7 per cent of total assets of the sector, indicated robust growth in deposits and advances as at end June 2011 (Chart 3.29). While CRAR declined marginally from 12.5 per cent at end March 2011 to 12.4 per cent in June 2011, Gross NPA ratio increased from 5.7 per cent as at end March 2011 to 6.9 per cent as at end June 2011, indicating strain on asset quality. A stress test on credit risk for SUCBs has been carried out and the results suggest that the sector could withstand a rise in NPA ratio by 50 per cent, but would come under duress if NPA ratio doubled (paragraph 3.51). Rural Co-operatives Dominance of short term structure in rural credit disbursement continued 3.28 The rural co-operative sector, comprising of StCBs, DCCBs, PACS (short-term structures) and SCARDBs and PCARDBs (long-term structures)7, formed 9.2 per cent of total assets of the banking sector. DCCBs accounted for almost 41 per cent of total outstanding loans of rural co-operative banks, as at end March 2010, followed by PACS and StCBs. At the same time, the share of long- term co-operatives in total outstanding loans and advances stood at 11 per cent, thus indicating the continuing dominance of short-term structure in rural credit disbursement. Deposits formed the major source of resources for StCBs and DCCBs, while in SCARDBs and PCARDBs, borrowings were the dominant source. In terms of asset quality the short term structure fared relatively better than the long-term one, except for PACS; though the NPA ratios remained high (Chart 3.30). Non Banking Financial Companies (NBFCs) Asset quality declined, even as profitability showed improvement 3.29 Non-deposit taking NBFCs that are large and systemically important i.e., having asset size of `100 crore and above are classified as NBFC-ND-SIs and constituted about 80 per cent of total assets of the NBFC sector. The financial soundness indicators of NBFC-ND- SIs as at end September 2011, indicated that the asset quality has deteriorated since March 2011, though it has improved as compared to quarter ended June 2011. Profitability indicators, however, remain strong (Chart 3.31). A stress test on credit risk for NBFC-ND-SIs has been carried out and the results suggest that they could withstand quite severe credit risk shocks (paragraph 3.52 and 3.53).
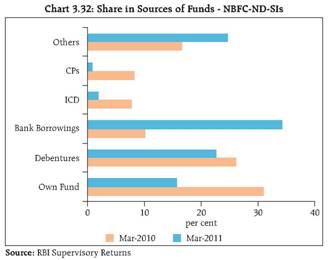
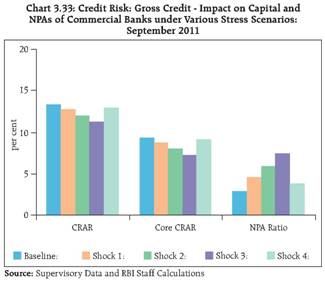
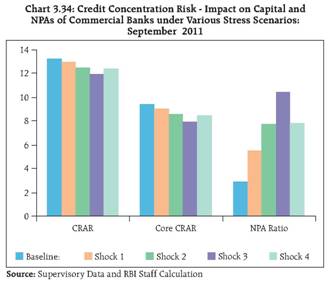
Significant reliance on banking system for resources evident... 3.30 NBFC-ND-SIs exhibited high dependency on the banking system for their resources, as evident from an analysis of their sources and uses of funds. This could pose risks for NBFCs if banks are not in a position or unwilling to extend credit to the sector. It could also pose concern for the banking sector as NBFCs typically deleverage faster during times of stress. The recent global crisis is a pointer in this direction. During the year 2010-11, borrowings of the NBFC sector from the banks increased by 54.7 per cent, while credit extended by the NBFC sector grew by 30.4 per cent (Chart 3.32). 3.31 The growing interconnectedness of NBFCs with the banks and the relatively less stringent regulation governing NBFCs compared to banks, raised the potential of arbitrage opportunities. These have been highlighted in previous FSRs and many steps have been initiated to plug avenues of such regulatory arbitrage. Accordingly, a Working Group was set up by the Reserve Bank in January 2011, to study the issues and concerns in the NBFC sector. The Working Group has since submitted its recommendations which pertain to, inter alia, the rationalisation of existing regulatory framework, prudential norms, regulatory convergence between banks and NBFCs, reviewing supervisory framework and corporate governance standards and disclosures. These recommendations are being examined. Pension Funds8 ... act as 'automatic stabiliser' with their long-term-long-only investment style 3.32 The importance of pension funds in ensuring stability is multi-fold. One, though pension funds are termed 'passive investors' (because portfolio churning is low) due to their 'buy and hold' strategy; with a sizeable presence, they can ensure market stability, by acting as a countervailing power in the face of large scale sell-off. Two, pension funds being large shareholders with a long-term investment strategy, they tend to play an important role in bringing in the best practices of corporate governance in companies that get the investments. Three, permitting pension funds to invest in equity/ debt instruments can play a dual role in not only providing better returns to its constituents but also, at the same time, in developing the capital market, Further, pension funds can be major stimulators of financial innovation, as suggested by international experience. 3.33 In India, the Pension Fund Regulatory and Development Authority (PFRDA) has been mandated to act as a regulator for the pension sector and is regulating the 'National Pension System' or the 'New Pension System' (NPS), The investment management guidelines in NPS have been framed to mitigate credit and market risk. Under this system, the pension fund managers manage three separate schemes, consisting of three asset classes, namely (i) equity, (ii) Government securities, and (iii) credit risk-bearing fixed income instruments, with the investment in equity subject to a cap of 50 per cent. 3.34 The pension funds have two accounts, namely, Tier-I and Tier-II. Tier-I account is a long-term investment for the accumulation phase of pension fund and meant for pay-out phase liabilities. On the other hand, Tier-II account allows frequent (or, even immediate) withdrawals and imposes a high reserve requirement. Given a framework where investors have a choice of liquidation, any sudden spike in redemption pressure, provided the fund sizes are large in Tier II can cause disorderly movements in securities markets and can even pose stability risks. Insurance Sector9 ..interconnectedness remains an issue of concern 3.35 The Indian insurance sector is well capitalised, as the solvency ratio10 exceeds the regulatory requirements in all the cases with respect to life insurers. However, recently this has become a matter of concern for non-life insurers as the liability requirement and the associated capital requirement for the mandatory motor third party pool has increased and so have the underwriting losses in the non-life sector. 3.36 Insurers underwrite risks if it can be backed by internal capital or the availability of reinsurance capacity. Reinsurance shares and allows diversification of exposures and provides stability to the industry. Currently, the reinsurance capacity is readily available for most of the risks written in India and can support the activity of the insurance business. Even, in case of the failure of reinsurance industry, it would only increase the price for getting the reinsurance cover. 3.37 Inter-linkages between insurance and banking sector is a matter of concern, with many insurance companies being part of financial conglomerates. Any financial stability issue regarding the bank in the conglomerate may have an amplifying effect on the insurer. The contagion between the banking and insurance sector will also depend on the insurance companies' overall exposure to banks. This has been brought to the fore in the contagion analysis in Chapter V. Resilience of Financial Institutions - Stress Testing 3.38 A number of single factor sensitivity stress tests11 were carried out on scheduled commercial banks (60 SCBs comprising 99 per cent of total banking sector assets) as well as urban (scheduled UCBs) and NBFC (NBFC-ND-SI) sectors to assess their vulnerabilities and resilience under various scenarios. Based on the latest supervisory data available, individual banks' position in terms of income/portfolio loss was examined by applying shocks in respect of a single key variable (holding other risk factors constant). The losses, thus computed, were then related to an important financial soundness indicator, typically the regulatory capital adequacy ratio. The same analyses were also carried out for the system as a whole by aggregating the impact across individual banks. 3.39 The credit risk stress tests, assumed an overall deterioration in asset quality. This test covered a set of separate shocks on (i) aggregate NPAs (Gross Credit); (ii) sectoral NPAs for selected sectors; and (iii) largest individual exposures (concentration). In all these tests, shocks are applied directly to NPAs (Gross NPA values as per banks' balance sheet taken as gross of annual average write-offs) with assumptions of increased provisioning12.These tests assess the impact of additional provisioning requirements (income losses) on the overall capital adequacy of individual bank as well as on the aggregated system. The total capital is taken as per Basel-II requirements. The stress tests are done in static mode, with shocks assumed to be occurring instantaneously. Scheduled Commercial Banks (SCBs) The banking system is quite resilient to credit risk shocks occurring in isolation 3.40 For the general NPA shocks, an increase in NPAs by 50 percent, 100 per cent and 150 per cent (shocks 1 to 3) were assumed. Another scenario assumed that 40 percent of restructured advances would become NPAs (shock 4). The results of these stress tests show that the system is reasonably poised to withstand the NPA shocks, but in case of large shocks a few individual banks could come under duress (Chart 3.33 and Table 3.2). Profits may be impacted in case of large negative shock in case of Sectoral NPAs 3.41 The exercise examined the credit risk of exposure to the four sectors viz. agriculture, power, real estate, and telecom. The assumed shock was an incremental increase in NPA by 5 percentage points in each sector. These tests are designed to capture the effect of a negative shock affecting important sectors. The results of sensitivity analysis reveal that the combined shock would increase the system level NPA ratio significantly, with the major contribution emanating from the real estate and agriculture sectors. Further, the impact on capital adequacy due to incremental increase of 5 percentage point in NPA ratio of priority sector would not be significant (Table 3.3). The losses are limited since banks typically diversify their sectoral exposure and also have internal sectoral limits. Most banks prove resilient to credit exposure concentration 3.42 To assess concentration of exposures among the largest borrowers, this test focused on the effect of one or more top borrowers defaulting at the same time. The tests consider a default of the top one, top two and top three single borrowers (shocks 1 to 3); and also a default of the largest group borrower (shock 4). The concentration of advances at the system level appears somewhat conservative, while it could be quite high in an individual bank. The average group exposure at the system level is only 6.5 percent of total advances, while the highest group exposure for an individual bank is 19.1 percent of total advances (Chart 3.34 and Table 3.4).The results reconfirm that the bank portfolios are well diversified, given the regulatory/prudential cap on single/ group exposures.
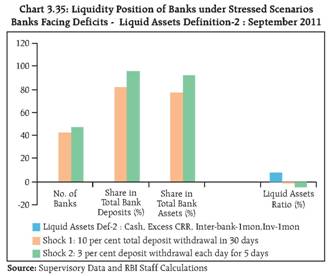
Interest rate risk in the banking book: risks appear manageable 3.43 A range of tests were carried out to examine direct interest rate risk, which reflects re-pricing mismatches of interest bearing assets and liabilities. The examined shocks include various shifts in interest rates, resulting in shifts in the yield curve. The shocks assumed (1) parallel upward shift in INR yield curve by 250 bps, (2) parallel downward shift by 250 bps, (3) Steepening of the INR yield curve : 0 to 100 bps linearly and (4) Inversion of the INR yield curve : 250 to -100 bps linearly. These tests were conducted for the banking and trading books separately. 3.44 The total (net) impact on the banking book was calculated by adding income losses/gains and portfolio losses/gains13, and the resultant losses/gains were used to derive the impacted CRAR. The valuation impact for the tests was calculated under the assumption that the HTM portfolio would be marked-to-market. The income impact on the CRAR is assumed for one-year only, to reflect the impact on the current year profit and loss and income statement. The results suggest that the largest impact came from the 250 bps upward parallel shift of the INR yield curve (Table 3.5). Most of the banks, except a few small banks, however, were able to withstand the shocks due to the offsetting effect across the different maturity buckets, which contained the overall loss. Interest rate risk in the trading book: banks could withstand the shock relatively easily 3.45 The results suggest that the impact of direct interest rate risk on the trading book would be small, demonstrating that the banks manage their interest rate risk rather well (Table 3.6). This reflects the point that the banks have well diversified bucket composition.
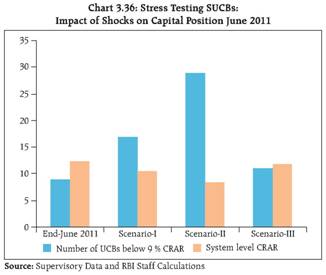
Impact of exchange rate movements on the banking system would be extremely limited 3.46 Foreign exchange (FX) risk derives from exchange rate changes that negatively affect the local currency value of financial institutions' assets, liabilities, and off-balance sheet positions. The tests examined banks' exchange rate risk exposures, covering all exchange-rate sensitive positions. Separate shock scenarios assumed appreciation and depreciation of INR by 10 and 15 per cent against all major currencies. The potential impact of the shocks were evaluated against banks' individual net open bilateral currency positions. The stress testing exercise estimated the impact of shocks on banks' individual foreign currency net positions, and then expressed potential losses against the CRAR. 3.47 The results of the stress tests show that under stress scenarios, the CRAR for the overall system would change slightly, though it would still exceed the minimum requirement of 9 per cent. This virtually negligible direct impact reflects a number of factors, including (i) very low FX exposure and (ii) closely monitored net open positions. Impact of the equity price index drop is extremely limited for the overall system 3.48 Under the equity price risk, impact of a shock of a fall in the equity price index, by 40 per cent, on NPA level and bank capital were examined. The system-wide CRAR would decline by only 0.07 percentage point from the baseline, while the average CRAR for the banks remain well above 9 per cent. This is because the banks typically have low proportion of capital market exposures on their balance sheets, considering the regulatory limit prescribed on banks' exposures to capital markets. SLR investments have a major effect on mitigating liquidity risk 3.49 The sensitivity analysis covered liquidity risk-an important source of risk highlighted in many financial systems during the recent global financial crisis. The analysis assumed that liquid assets are sold with a 10 per cent haircut in the open market, which corresponds to empirical observations over recent years. The stress tests assume two scenarios: first scenario assumed that the SLR securities would be available for use by lowering the SLR requirements during a systemic deposit withdrawal, while the second scenario assumed that only excess SLR securities are liquid. 3.50 The maintenance of SLR securities is a special feature in India. In order to capture its impact, the liquidity risk analysis has been done with two definitions of liquid assets. As per the first definition, the liquid assets comprise of cash, excess CRR, all inter bank deposits and all SLR investments; which works out to a liquid asset ratio of 24.7 per cent under the baseline scenario. Whereas under the second definition for liquid assets, cash, excess CRR, inter-bank-deposits- maturing-within-1-month and investments-maturing- within-1-month is considered; and the liquid asset ratio is derived as 7.7 per cent under the baseline scenario. The scenarios are constructed to test the ability of banks to meet deposit runs using only their stock of liquid assets under stress conditions, resulting in a widening of the liquidity gaps and low liquidity ratios. Under the stress scenarios, there were indications of deterioration in the liquidity position (Table 3.7 and Chart 3.35). It is reflected from the analysis that in severe stress scenario the SLR investments would help banks to withstand the liquidity pressure quite easily. Urban Co-operative Banks (UCBs) ... exhibit resilience even on increase in NPA ratio by 50 per cent 3.51 Stress tests on credit risk were conducted on Scheduled UCBs (SUCBs), one of the important segments in UCB sector, using their asset portfolio as at end-June 2011. The results are based on single factor sensitivity analysis. Impact of shocks on CRAR was tested under three different scenarios, which assume (i) an increase in NPA ratio by 50 per cent, (ii) an increase in NPA ratio by 100 per cent and (iii) no profit earned by banks. It is observed that SUCBs could withstand shocks assumed under scenarios I and III easily. However, the sector would come under some stress under scenario II (Chart 3.36). Non-Banking Financial Companies (NBFCs) ... able to withstand even five fold increase in gross NPAs 3.52 A stress test on credit risk for NBFC-ND-SIs was carried out based on end-March 2011 data under two scenarios: (i) a two fold increase in gross NPA; and (ii) a five fold increase in gross NPA. The assumed increase in NPAs was distributed across sub-standard, doubtful and loss categories in the same proportion as prevailing in the existing stock of NPAs. The additional provisioning requirement was adjusted from the current capital position.
3.53 The results of the sensitivity analysis suggest that the NBFC sector could withstand quite severe credit risk shocks. Under both the scenarios, it was observed that there was a shortfall in provisioning. However, the overall impact on the CRAR was negligible, as the sector had a high CRAR of 35.1 per cent, as against the regulatory requirement of 15 per cent. Concluding Remarks 3.54 The turmoil in Euro zone has fanned fears of deleveraging by the European banks. Though Indian banks are not expected to have any direct impact on account of their negligible exposure to the troubled zone, indirect impact on account of funding pressures could be seen. 3.55 The Banking Stability Map and Indicator revealed rise in vulnerabilities in the banking sector and a risk to stability on account of dimensional increase in soundness, profitability and asset quality risks. 3.56 Credit growth had decelerated from the robust growth of 22.6 per cent as at end March 2011 to 19.2 per cent as at end September 2011. This credit growth was attained against nominal GDP growth of 16 per cent. CRAR, though well above the regulatory minimum, continued its decline and fell from 14.5 per cent as at end March 2010 to 13.5 per cent as at end September 2011. Whilst India's current gross NPA ratio at 2.8 per cent was broadly in line with the peer countries' average, the growth rate of NPAs at 30.5 per cent and slippages at 92.8 per cent as at end September 2011, had outpaced credit growth of 19.2 per cent by a wide margin. Priority sector, real estate, infrastructure and retail sectors contributed significantly to the increase in NPAs. Banks' profitability has come under pressure as rising interest rates resulted in growth rate of interest expenses outpacing that of interest income, and consequent deceleration in NII and EBPT. 3.57 Power and telecom sectors together accounted for 77 per cent of infrastructure credit and saw a rise in impairments and restructuring. With power sector advances being concentrated in generation and SEBs, the risk was prominent due to financial ill-health of most SEBs and coal supply/delays plaguing most power projects. 3.58 With further slow-down in credit cycle expected on the back of higher interest rate environment and a slowing economy, deteriorating asset quality will emerge as a challenge for the banking sector. The bottom-line of the banks is expected to be affected adversely on account of pressure on margins due to sustained high deposit rates and higher provisions due to deterioration in credit quality of assets. 3.59 The urban co-operative banking sector faced significant pressure on asset quality, akin to the scheduled commercial banks. The rural co-operative sector revealed the prominence of short-term structure in credit disbursement. The bank-NBFC interconnectedness has been observed to be strong as NBFCs relied significantly on bank borrowings for their resources. 3.60 Pension funds can ensure market stability, by acting as a countervailing power in the face of large scale sell-off and can also play an important role in bringing in the best practices of corporate governance in companies where they invest in. Given the framework of NPS where investors have a choice of liquidation, any sudden spike in redemption pressure, can cause disorderly movements in securities markets. The Indian insurance sector is well capitalised with the solvency ratio being well above the regulatory minimum prescribed. However, the interconnectedness with the banking system remains a matter of concern and calls for further monitoring. 3.61 The stress testing exercises provided important insights into the resilience of the banking system. The single-factor sensitivity calculations suggest that the system would be able to withstand a range of risk specific and sector specific shocks occurring in isolation, and the impact of interest rate risk, foreign exchange risk and equity price risk would not be significant. The liquidity stress test results indicated that the SLR investments enabled the banks to withstand quite severe deposit runs. The credit risk stress tests on scheduled UCBs and NBFC-ND-SIs revealed that the impact on CRAR under different scenarios would not be shocking. 1In October, 2011, Euro zone leaders agreed on a package of measures designed to overcome the on-going problems due to the spiralling sovereign debt. This included, inter alia, a proposal of 50 per cent loss or 'haircut' on Greek government bonds held by the financial sector, increasing the European Financial Stability Facility (EFSF) to about €1 trillion and requiring European banks to have a significantly higher capital ratio (9 per cent of core Tier 1 capital relative to risk-weighted assets) after accounting for their losses on government debt. 2 For methodology and details, please refer to the Annex of this Report. 3 Leverage ratio has been introduced by Basel III regulatory capital framework and is a non-risk-based measure which captures both on and off balance sheet exposures. 4PCR is essentially the ratio of provisioning to gross non-performing assets and indicates the extent of funds a bank has provided to cover its loan losses. 5 Prior to the introduction of a daily product method, the interest on savings deposit account was calculated based on the minimum balance maintained in the account between the 10th day and the last day of each calendar month and credited to the depositor's account only when the interest due was at least `1/- or more. 6 The impact is calculated on the assumption that all banks raise their savings bank deposit rate by 100 bps, ceterus paribus. 7 StCBs - State Cooperative Banks, DCCBs - District Central Cooperative Banks, PACS - Primary Agricultural Credit Society, SCARDBs - State Cooperative Agriculture and Rural Development Banks and PCARDBs - Primary Cooperative Agriculture and Rural Development Banks 10 Solvency ratio (which is the ratio of the company's available solvency margin to its required solvency margin) is a measure of the insurance company's risk-bearing capacity and must exceed 150 per cent for the company to be considered solvent from a regulatory perspective. 11For details on stress tests, please refer to the Annex of this Report. 12 Enhanced Provisioning norms assumed: standard assets 1 per cent, sub-standard assets 30 per cent, doubtful and loss assets 100 per cent. 13Total (Net) losses/ gain = Income (losses/ gain) + portfolio (losses\ gain). |
|||||||||||||||||||||||||||||||||||||||||||||||||||||||||||||||||||||||||||||||||||||||||||||||||||||||||||||||||||||||||||||||||||||||||||||||||||||||||||||||||||||||||||||||||||||||||||||||||||||||||||||||||||||||||||||||||||||||||||||||||||||||||||||||||||||||||||||||||||||||||||||||||||||||||||||||||||||||
পৃষ্ঠাটো শেহতীয়া আপডেট কৰা তাৰিখ:


