 IST,
IST,


VI. Bank Credit(Part 2 of 3)
6.23 From the mid-1980s onwards, steps were, therefore, taken to liberalise the credit delivery system but these gathered momentum only in the 1990s. Selective credit controls have been dispensed with and micro-regulation of credit delivery has been discontinued providing greater freedom to both banks and borrowers. Although directed lending in the form of ‘priority sector’ remains at 40 per cent of total bank lending, banks have been provided greater flexibility in the changed milieu to meet the priority sector requirements. Notably, advances eligible for priority sector lending have been enlarged and interest rates deregulated, thus making the system far more flexible for priority sector lending. Arrangements requiring banks to form consortia for loans beyond specified credit limits were phased out by 1997.
Credit Delivery System
6.24 Consequent upon the deregulation of interest rates and the significant reduction in the statutory preemptions, there was an expectation that enhanced credit flow to the needy would be facilitated. In contrast to these expectations, banks continued to show a marked preference for investments in Government securities. Even as the SLR was brought down from 38.5 per cent in 1992 to 25 per cent by 1997, the credit-deposit ratio of scheduled commercial banks did not witness any increase at all. In fact, the ratio at 53.6 per cent at end-March 2000 was lower than that of 54.4 per cent at end-March 1992. As discussed later, a number of factors such as weak demand and risk aversion by banks explain this phenomenon.
6.25 The micro-management of credit through various regulations during the 1970s and 1980s had eroded the risk appraisal techniques of the banks. Notwithstanding the shift in approach from lending based on credit allocation targets and administered
interest rates to a risk-based system of lending and market-determined interest rates, banks continue to charge interest rates to borrowers by their category - whether agriculture or small scale industry - rather than actual assessment of risks for each borrower. Thus, the need for the banks to improve their credit risk assessment skills has gained importance.
6.26 Development of appropriate credit risk assessment techniques is critical also for the efficacy of monetary transmission. With the shift to indirect instruments of monetary management, monetary policy signals are increasingly transmitted through modulations in shor t-term interest rates. The monetary transmission mechanism is, thus, now crucially dependent on the impact of changes in policy interest rates, such as the Bank Rate or the reverse repo rate, on banks’ deposit and lending rates. An improvement in banks’ credit risk assessment techniques will help not only to increase the flow of credit to the commercial sector but should also enhance the efficacy of the transmission mechanism in the economy.
6.27 It is against this backdrop that various measures by the Reserve Bank aimed at reducing the information and transaction costs of lending in order to improve the credit delivery mechanism (issues related to interest rate deregulation are covered in Chapter VII). This analytical discussion is followed by an analysis of recent movements in credit availability to various sectors of the economy in order to assess the efficacy of the policy measures. Finally, the section addresses reasons for banks’ continued preference for Government securities, well above the statutory requirements.
Credit to Agriculture
6.28 As a key sector of the Indian economy, agriculture receives priority in the credit delivery mechanism. The Reserve Bank of India Act is unusual among central banks to have specific provision for attention to agricultural credit. Notwithstanding the impressive geographical spread and functional reach, the rural financial institutions at the start of the 1990s were found in a poor shape and characterised by several weaknesses such as decline in productivity and efficiency, erosion of repayment ethics and profitability (Mohan, 2004d). Accordingly, during the 1990s, steps were undertaken to strengthen the rural financial institutions through recapitalisation of select regional rural banks, introduction of prudential accounting norms and provisioning requirements for all rural credit agencies.
6.29 At the same time, it needs to be noted that lending to the agricultural sector is inherently risky. This is due to several risks that a farmer faces, and of these, future price and monsoon conditions are the most severe and almost entirely beyond the control of the farmer. Efforts have been made to mitigate these risks through various mechanisms such as the Minimum Suppor t Price (MSP) mechanism. While the MSP route has been useful, its coverage is limited to cereals like rice and wheat and, in some areas, cotton. Accordingly, if some elements of insurance are ab initio not viable, extending credit becomes more risky and hence constrained (Reddy, 2004b). This high risk is reflected in high interest rates on such loans and high non-performing loans (NPLs) in the agricultural sector. At the same time, it is relevant to note that NPLs to the agricultural sector are not as high as those of loans extended to the small-scale sector and ‘other priority sector’. Illustratively, during 2001-03, for the public sector banks, the non-performing assets (NPAs) (as per cent to outstanding advances) averaged 12.0 per cent for the agricultural sector as compared with 20.6 per cent for SSI loans, 12.2 per cent for ‘other priority sector’ and 9.4 per cent for ‘non-priority sector’. If public enterprises are excluded from the ‘non-priority sector’ group, the proportion of NPAs in the agricultural sector may be comparable to this group. Thus, the difference between NPLs in the agricultural sector and the ‘non-priority sector’ is probably not large enough to warrant excessive caution in bank lending for agricultural purposes (Mohan, 2004d).
6.30 Against this backdrop, steps were initiated in the late 1990s to increase flow of credit to the rural sector through introduction of schemes such as Kisan Credit Cards (Box VI.2). The current strategy adopted by the Reserve Bank to increase the flow of credit to the agricultural sector may be summarised as follows. First, the coverage of rural credit is extended to include facilities such as storage as well as credit through NBFCs. Second, procedural and transactional bottlenecks are sought to be removed, including elimination of Service Area
Box VI.2
Initiatives to Improve Credit Flow to the Rural Sector
Public sector banks have been advised to formulate Special Agricultural Credit Plans (SACP) to fix self-set yearly targets for achievement. The targets fixed by the banks generally provide for an increase of about 20 to 25 per cent over the disbursement made in the previous year. At present, a sub-target of 18 per cent of net bank credit has been stipulated for lending to the agriculture sector by domestic scheduled commercial banks. This is inclusive of both direct and indirect finance provided by banks. With a view to ensuring that the focus of the banks on the ‘direct’ category of agricultural advances does not get diluted, it was stipulated in 1993 that agricultural lending under the ‘indirect’ category should not exceed one-fourth of the sub-target of 18 per cent, i.e., 4.5 per cent of net bank credit. All agricultural advances under direct as well as indirect categories continue to be reckoned in computing performance under the overall priority sector lending target of 40 percent of net bank credit. The scope of priority sector lending has been expanded to include, inter alia, financing of agri-clinics and agribusiness centres.
Shortfall of public as well as private sector banks in lending to the priority sector is allocated for contribution to the Rural Infrastructure Development Fund (RIDF) established with the NABARD in 1995-96. The RIDF has contributed to improvement of infrastructure like irrigation, roads and bridges. Funds in the RIDF are increasingly being used for schemes, which more directly benefit the farmers rather than contributing only to rural infrastructure improvement.
Areas that need to be given priority for sanction, e.g., irrigation, water and soil conservation are being identified. RIDF assistance has also been linked to agricultural/rural reforms in the States.
Effective 1998-99, banks have been issuing Kisan Credit Cards to farmers on the basis of their land holdings so that the farmers can use them to readily purchase agricultural inputs such as seeds, fertilisers and pesticides. This scheme aims at adequate and timely support to the farmers for their cultivation needs including purchase of inputs in a flexible and cost-effective manner. Over the last couple of years, the Kisan Credit Card Scheme has emerged as an effective tool for catering to the short-term credit requirements of the farmers. A National Impact Assessment Survey, carried out by the National Council of Applied Economic Research (NCAER) for the Reserve Bank, shows that the KCC Scheme has had many benefits. These include: (i) augmentation in flow of credit to the agriculture sector; (ii) about 6 per cent decrease in cost of borrowings for farmers after they were given KCCs; (iii) cost of borrowings for KCC holders from formal sources is about 3 per cent lower than those for non-KCC holders; (iv) significant drop in the number of borrowers depending exclusively on informal sources for their short-term credit needs; (v) reduction in cost of borrowings from informal sources by about 3 per cent; (vi) significant saving in time spent in taking short-term agricultural loans; and (vii) decline in cost of delivering credit due to simplification in procedures.
Approach, reducing margins, redefining overdues to coincide with crop-cycles, new debt restructuring policies, one-time settlement and relief measures for farmers indebted to non-institutional lenders. Third, the Kisan Credit Card Scheme is being improved and widened in its coverage while some banks are popularising General Credit Cards (GCCs) which is in the nature of clean overdraft for multipurpose use, including consumption. Fourth, public and pr ivate sector banks are being encouraged to enhance credit-delivery while strengthening disincentives for shortfall in priority sector lending. Fifth, banks are urged to price the credit to farmers based on actual assessment of individual risk rather than on a flat rate depending on category of borrower or end-use while ensuring that interest-rates charged are justifiable as well as reasonable. In brief, the thrust is on enhancing credit-delivery with improved risk assessment systems that lead to a regime of reasonable credit prices. Such a change has to be implemented within the framework of existing legal and institutional constraints: and to this limited extent, there has been a major change in the mindset (Reddy, 2004b). The issues relating to flow of agricultural sector were re-examined by the Vyas Committee and several recommendations of the Committee have been implemented (RBI, 2004).
Credit to SSIs
6.31 Small scale industries (SSIs) play a significant role in terms of balanced and sustainable growth, employment generation, development of entrepreneurial skills and contribution to export earnings. In particular, there is need to develop entrepreneurship in developing countries and, in this context, small-scale units play an important role. It is relevant to note that a unit which is small today could be a big unit tomorrow. At the same time, SSI units are hampered in their growth by imperfections in all the key factor markets - capital, land and labour – but, in particular, capital markets (Mohan, 2002). Capital costs faced by SSI units are typically higher because of market imperfections in the availability of information for investors and lenders. Given the relatively small size of loans, transaction costs are also higher for SSI units. Provision of collateral or other risk-reducing securities is also often difficult for SSIs. On all these grounds, credit flow to small scale units may be less than desirable. This provides a strong rationale for policy intervention to direct credit flow to the SSI units.
6.32 Like many countries, in India too, efforts have, therefore, been made to increase provision of credit to this sector. This has taken the form of requiring banks to allocate a stipulated proportion of their total credit to the SSI sector. Advances to SSI are accordingly a part of the priority sector lending since the 1970s. Before the initiation of financial sector reforms in the early 1990s, these loans were subsidised. In the post-reform period, higher transaction costs and the absence of good credit assessment capabilities with banks engendered by the earlier regime led to a significant jump in interest rates applicable to SSI units. The high interest rates paid by the SSIs may not always be in accordance with their risk profile.
6.33 Efforts have, therefore, been made in the recent years to increase flow of credit to this sector while reducing transactions costs for lending. Initiatives to increase flow of credit to the SSI sector include: opening of specialised SSI branches; fixing of self-target for SSI sector by banks; enhancement in the limit for composite loans; delegation of more powers to branch managers; simplification of loan application forms; launching of a new Credit Guarantee Scheme; and collateral free-loans. In order to further enhance the flow of credit to this sector, a Working Group on Flow of Credit to SSI Sector (Chairman: Dr. A.S. Ganguly) was recently constituted by the Reserve Bank. The Group submitted its Report in April 2004 (Box VI.3). Following the Group’s Report, the Reserve Bank’s Annual Policy Statement for 2004-05 stated that Credit Information Bureau of India Ltd. (CIBIL) would work out a mechanism, in consultation with the Reserve Bank, SIDBI and IBA for developing a system of proper credit records. As noted above, a key factor that inhibits lending to the SSI sector is limited information that banks have about borrowers. The proposal to develop a set of credit records will enable an easier verification of credit histories and thereby increase flow of credit. Empirical evidence for the US shows that wider availability of credit histories have greatly expanded the availability of credit as potential borrowers are no longer tied to their local lenders. Small firms in the US have been able to borrow from increasingly distant lenders over time (Peterson and Rajan, 2002). Given this evidence, the proposed measures of developing credit record through CIBIL should widen the available resources to SSI units as also reduce their cost. With mechanisms such as credit histories in place, financiers can also move away from lending only against collateral or on the basis of prior contacts.
Box VI.3
Report of the Working Group on Flow of Credit to SSI Sector
In India, small and medium enterprises (SMEs) are major contributors to growth in GDP, export promotion and employment generation and, in this context, there is a need to activate avenues to speed up credit to the SME sector. The Working Group observed that, for banks, SME financing is an attractive business opportunity of lending to the priority sector. However, the present slowdown in lending to the SME sector is mainly attributed to the risk-averse behaviour of banks due to a high proportion of credit extended to SMEs becoming non-performing.
The Group observed that this warranted a complete rethinking on the strategy of lending to this sector and a reassessment suggested the following three principle elements of strategy on lending:
First, provision and flow of credit to units having direct linkages with large corporate undertakings could be tied up with these large undertakings. This would facilitate recovery. For the linkage to be strong enough and to be beneficial for both, technology transfer from large undertakings to the small units could be accompanied by a greater oversight and quality of the products delivered.
The cost of credit assessment of small and medium enterprises can be reduced by a focused recognition of clusters of like small-scale industries that exist around the country. Such clusters help SSIs to reap economies of scale, both in financial assistance and in technology upgradation. Accordingly, the second leg of the Group’s strategy is to develop a set of standard products for units belonging to the same cluster of industries.
The third leg is to develop local financial intermediaries specifically aimed at financing units mainly in the tiny but also small sectors. These would be similar to NBFCs but without any permission to accept deposits from the public. They would draw their resources from the banking system, by originating the loans and selling the same to the banks as a portfolio with appropriate arrangements for risk sharing. Such micro credit intermediaries would be able to assess risk and rate credit requirements and also serve as instruments for extending quick credit to SME clusters.
The Group observed that highly successful micro finance models working in southern states should be actively publicised and replicated as best practices in other parts of the country. Finally, since many State Financial Corporations (SFCs) have good infrastructure and trained personnel, revival of some of the more active SFCs as state level NBFCs needs to be explored.
This will thus permit a greater degree of financing without collaterals (Rajan and Zingales, 2003 op.cit). Finally, in order to improve the flow to this sector, a mechanism for debt restructuring on the lines of the Corporate Debt Restructuring (CDR) is proposed for the medium scale enterprises.
Micro Finance
6.34 The access to credit for the poor from conventional banking is often constrained by lack of collateral and high transaction costs associated with small borrowal accounts. It has been demonstrated that timely and adequate access to credit can help alleviate poverty, the prime example being the success of the Grameen Bank model of Bangladesh. It is possible for even the organised financial intermediaries to lend to the poor at market determined interest rate with high rates of recovery and low transaction costs. In this context, micro finance has emerged as a viable alternative to reach the underprivileged sections of society for their social and economic empowerment through financial intermediation. Micro finance involves provision of thrift, credit and other financial services and products of very small amounts to the poor for enabling them to raise their income levels and thereby improve living standards.
6.35 In this regard, a number of initiatives have been taken to augment the flow of bank credit to the micro enterprises in rural and semi-urban areas set up by vulnerable sections of society including women. Banks have been advised to provide maximum support to Self Help Groups (SHGs). A SHG is a registered or unregistered group of micro entrepreneurs with a homogenous social and economic background, voluntarily coming together to save small amounts regularly and mutually agreeing to contribute to a common fund to meet their emergency needs on mutual help basis. The group members use collective wisdom and peer pressure to ensure proper end-use and timely repayment of credit. In fact, peer pressure has been recognised as an effective substitute for collaterals. Besides, financing through SHGs reduces transaction costs for both lenders and borrowers. Accordingly, the Reserve Bank has put in place a facilitating environment for banks to promote SHGs. Since 1996, financing of SHGs is a part of priority sector lending. More recently, banks have been advised to provide adequate incentives to their branches for financing SHGs, establishing linkages and adopting simple and easy procedures to suit local conditions. The ambit of microfinance has been extended to include consumption expenditure. Banks have been advised that the group dynamics of SHGs need not be regulated and there is no need to impose or insist upon formal structures.
Housing Finance
6.36 The importance of the housing sector in any economy is derived from its high employment potential and extensive backward and forward linkages. In addition to being an engine of growth for the economy, the housing sector provides a relatively safe destination for bank credit on account of relatively high recovery rates. Consequently, the Reserve Bank has initiated a host of supply side measures to boost flow of bank credit to the housing sector and to ensure the benefit of soft interest rates to borrowers. These include: (a) contribution of Rs.100 crore to the equity capital of NHB; (b) reduction in risk weight on loans from 100 per cent to 50 per cent; (c) investments in Mortgage Backed Securities (MBS) reckoned in the prescribed housing finance allocation of 3.0 per cent; (d) increase in limit on housing loans for repairing damaged houses in rural, semi-urban and urban areas; and (e) direct finance to the housing sector up to Rs.10 lakh in rural and semi-urban areas as part of priority sector lending.
Infrastructure Lending
6.37 Financing of infrastructure projects is characterised by large capital outlays, long gestation period and high leverage ratios. Once an infrastructure project is built, and tariffs are set in a transparent and predictable manner, the cash flows are fairly regular and predictable. They can then be securitised easily. However, the pre-operation risk is extremely high: hence risk mitigation, and credit enhancement is necessary to attract resources at reasonable cost (Mohan, 2003b). Taking into account such special considerations involved in the funding of the infrastructural sector as also the need to facilitate private sector investment in infrastructure, several policy measures have been implemented by the Reserve Bank. In April 1999, the Reserve Bank introduced new guidelines relating to the financing of infrastructure projects, such as, the criteria for financing, the types of financing, the appraisal, the regulatory compliance/concerns, the administrative arrangements and the inter-institutional guarantees. Certain relaxations relating to regulatory and prudential aspects have been allowed to banks since 1999-2000 to boost flow of credit to this sector. These measures, inter alia, included: (i) enhancing the scope of definition of infrastructure lending; (ii) relaxing the prudential single borrower exposure limit from 15 per cent to 20 per cent of capital funds in respect of infrastructure companies providing infrastructure facilities; (iii) assigning a concessional risk weight of 50 per cent on investment in securitised paper satisfying certain conditions pertaining to an infrastructure facility;
(iv) permitting lending to special purpose vehicles (SPVs) in the private sector registered under Companies Act for directly undertaking viable infrastructure projects subject to certain conditions; (v) lending to promoters, with certain safeguards and where appropriate, for acquiring a controlling stake in existing infrastructure companies; and (vi) expanding the scope of definition of infrastructure lending to include the construction of projects involving agro-processing and supply of inputs to agriculture, preservation and storage of processed agro-products and perishable goods, educational institutions and hospitals.
Credit Delivery: An Assessment
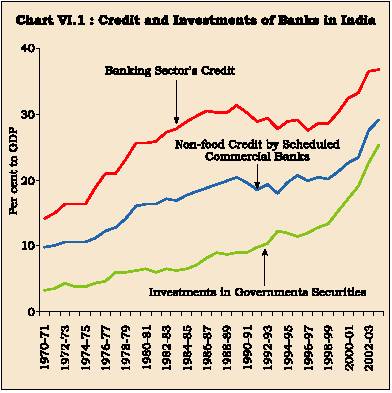
6.38 Against the above backdrop of the various recent policy efforts to improve the credit delivery mechanism, an analysis of the actual outturn in credit pattern extended by banks throws up a number of interesting facets. First, overall bank credit from scheduled commercial banks (SCBs) as a proportion of GDP stagnated during the 1990s although there are signs of a substantial increase from 1999-2000 onwards (Table 6.3 and Chart VI.1). A key factor holding down credit flow to the commercial sector was the banks’ investments in Gover nment securities. As discussed later, increasing investments of banks in Government securities were initially on account of statutory requirements, but subsequently banks preferred investments on their own even as statutory requirements were scaled down significantly. At the same time, the conventional measurement of bank credit to commercial sector understates actual credit availed. Reflecting the liberalisation process, banks have been permitted to subscribe to shares, debentures of corporates and commercial paper (RBI, 1999). Investments in such instruments, at present, are around 11 per cent of the conventional credit and nearly three per cent of GDP compared to negligible
|
Table 6.3: Credit and Investment by Banks in India |
||||
|
(Per cent to GDP) |
||||
|
Item |
1970s |
1980s |
1990s |
2000-04 |
|
1 |
2 |
3 |
4 |
5 |
|
Credit to Commercial Sector |
18.8 |
28.7 |
28.9 |
34.7 |
|
by Banking Sector |
||||
|
Of which: Non-food Credit by |
||||
|
Scheduled Commercial Banks |
11.8 |
18.1 |
19.7 |
25.6 |
|
Investments in Government |
||||
|
Securities by Banking System |
4.6 |
7.4 |
11.8 |
21.0 |
|
Source : Reserve Bank of India. |
||||
|
Table 6.4: Scheduled Commercial Banks’ Non-SLR Investments |
|||
|
(Rs. Crore) |
|||
|
Item March 1997 |
March 2004 |
||
|
1 |
2 |
3 |
|
|
1 |
Commercial Paper |
685 |
3,770 |
|
2. |
Shares issued by |
1,252 |
8,667 |
|
2.1 PSUs |
348 |
1,272 |
|
|
2.2 Private Corporate Sector |
904 |
7,395 |
|
|
3. |
Bonds/debentures issued by |
16,631 |
76,549 |
|
3.1 PSUs |
14,277 |
48,646 |
|
|
3.2 Private Corporate Sector |
2,354 |
27,903 |
|
|
4. |
Total Non-SLR (1+2+3) |
18,568 |
88,986 |
|
5. |
Conventional Bank Credit |
2,78,401 |
8,40,785 |
|
(20.3) |
(30.3) |
||
|
6. Bank Credit including non-SLR |
2,96,969 |
9,29,771 |
|
|
(21.7) |
(33.5) |
||
|
Note : Figures in brackets are per cent to GDP. |
|||
6.39 Second, a cross-country analysis shows that bank credit to the private sector in India (inclusive of credit to public sector units) remains lower than in many developing economies (Table 6.5). The bank
|
Table 6.5: Bank Credit to the Private Sector: A Cross-Country Survey |
|||||||
|
(Per cent to GDP) |
|||||||
|
Country/Region |
1970s |
1981-85 |
1986-90 |
1991-95 |
1996-00 |
2001-03 |
|
|
1 |
2 |
3 |
4 |
5 |
6 |
7 |
|
|
Argentina |
19.0 |
27.6 |
22.8 |
17.3 |
23.0 |
15.6 |
|
|
Australia |
25.0 |
29.0 |
48.8 |
66.4 |
80.6 |
89.8 |
|
|
Brazil |
47.8 |
44.4 |
68.5 |
60.3 |
34.4 |
34.6 |
|
|
Chile |
18.8 |
72.9 |
54.4 |
50.4 |
62.1 |
64.4 |
|
|
China |
51.7 |
60.2 |
79.6 |
91.1 |
111.8 |
136.6 |
|
|
Germany |
70.6 |
83.2 |
85.5 |
97.8 |
115.7 |
118.9 |
|
|
India |
18.8 |
27.9 |
30.5 |
28.8 |
29.4 |
35.5 |
|
|
Indonesia |
.. |
14.6 |
30.7 |
49.2 |
42.4 |
22.5 |
|
|
Japan |
128.8 |
142.6 |
179.0 |
200.1 |
196.5 |
180.9 |
|
|
Korea, Rep. |
41.4 |
54.2 |
58.4 |
62.4 |
78.9 |
99.7 |
|
|
Mexico |
26.6 |
14.9 |
14.0 |
29.7 |
21.5 |
17.8 |
|
|
Philippines |
34.3 |
41.2 |
19.5 |
31.9 |
52.2 |
36.9 |
|
|
Poland |
.. |
4.4 |
7.1 |
20.8 |
23.7 |
28.5 |
|
|
Russian Federation |
.. |
.. |
.. |
11.1 |
12.2 |
18.3 |
|
|
South Africa |
63.5 |
66.7 |
76.1 |
111.1 |
126.0 |
120.6 |
|
|
United Kingdom |
29.1 |
40.2 |
100.5 |
112.0 |
122.7 |
143.1 |
|
|
United States |
117.4 |
121.7 |
147.6 |
162.5 |
220.6 |
190.6 |
|
|
Memo: |
|||||||
|
East Asia and Pacific |
45.8 |
48.6 |
65.6 |
82.5 |
104.3 |
116.6 |
|
|
World |
80.4 |
88.2 |
110.0 |
120.3 |
139.8 |
131.5 |
|
|
.. Not Available. |
|||||||
|
Source : |
1. |
World Development Indicators Online, World Bank (2004). |
|||||
|
2. |
Reserve Bank of India. |
||||||
credit to GDP ratio in India is one-third of that for the East Asian and Pacific region. Countries like Argentina and Indonesia that suffered from financial crises exhibit a significant decline in their credit-GDP ratios in the recent period. Even in countries like the US, where the financial systems are considered as market-based, the ratio of credit to GDP is significantly higher.
6.40 As noted above, bank credit/GDP ratio in India is lower than that in the East Asian region. This can be attributed in part to higher savings ratio in the East Asian region. High fiscal deficits and their financing by banks in India also explain the low credit-GDP ratio. This becomes clear if the total credit extended by the banking system – private sector as well as the government sector – is examined (Table 6.6).
6.41 Third, turning to sectoral credit trends, bank credit to agriculture, as a proportion of total credit, shows a decline from its levels in the 1980s, although the declining trend has been arrested since March 2002 (Table 6.7 and Chart VI.2). The share of industry in overall bank credit has also witnessed a declining trend since 1990. Amongst other key sectors, transport reveals a secular decline from its 1990 level. The decline in the relative share of the major sectors such as agriculture and industry has been predominantly on account of an increase in the sub-group 'personal loans'. The share of this sub-group has witnessed a multi-fold increase during the 1980s and 1990s: from around two per cent in 1980 to nine per cent in 1990 which doubled further to almost 20 per cent by 2003. Amongst the personal loans segment, housing loans have emerged as a significant category. At present, housing loans constitute nearly seven per cent of outstanding bank credit as compared with only 2.4 per cent in 1990. Apart from various policy efforts of the Reserve Bank to improve credit flows to the housing sector (noted above), the sharp growth in housing loans also reflects a softening of interest rates in the recent years and fiscal incentives.
6.42 Fourth, as a proportion of overall GDP, the declining trend in outstanding credit to agriculture has been reversed since 2001 and the ratio has exhibited a substantial increase since then. Both the components
|
Table 6.6: Domestic Credit Provided by the Banking Sector |
||||||
|
(Per cent to GDP) |
||||||
|
Country/Region |
1970s |
1981-85 |
1986-90 |
1991-95 |
1996-00 |
2001-03 |
|
1 |
2 |
3 |
4 |
5 |
6 |
7 |
|
Argentina |
27.5 |
43.0 |
47.1 |
25.1 |
32.2 |
50.1 |
|
Australia |
40.1 |
40.8 |
58.5 |
75.3 |
87.1 |
93.9 |
|
Brazil |
49.5 |
50.7 |
101.1 |
98.6 |
50.1 |
61.1 |
|
Chile |
45.4 |
89.7 |
88.1 |
62.2 |
69.4 |
73.6 |
|
China |
45.1 |
60.2 |
81.2 |
94.2 |
117.9 |
161.3 |
|
Germany |
76.9 |
98.0 |
99.8 |
116.8 |
143.2 |
144.9 |
|
India |
32.5 |
47.2 |
54.2 |
51.8 |
51.9 |
62.2 |
|
Indonesia |
.. |
13.2 |
29.9 |
49.0 |
61.0 |
59.3 |
|
Japan |
166.9 |
208.8 |
247.9 |
271.7 |
303.4 |
314.3 |
|
Korea, Rep. |
45.2 |
59.9 |
60.5 |
63.1 |
80.8 |
101.4 |
|
Mexico |
45.1 |
52.6 |
46.4 |
41.4 |
35.6 |
36.6 |
|
Philippines |
43.3 |
56.4 |
26.0 |
44.4 |
74.0 |
60.8 |
|
Poland |
.. |
6.0 |
8.6 |
36.4 |
33.4 |
36.2 |
|
Russian Federation |
.. |
.. |
.. |
27.7 |
32.0 |
26.6 |
|
South Africa |
86.9 |
88.6 |
95.0 |
131.5 |
146.5 |
133.4 |
|
United Kingdom |
46.2 |
48.5 |
98.8 |
117.1 |
126.6 |
145.2 |
|
United States |
139.5 |
145.6 |
174.5 |
193.9 |
245.9 |
209.8 |
|
Memo: |
||||||
|
East Asia and Pacific |
41.1 |
53.3 |
70.5 |
85.2 |
112.3 |
140.0 |
|
World |
98.3 |
112.3 |
137.5 |
150.8 |
172.2 |
158.9 |
|
.. Not Available. |
||||||
|
Source : 1. |
World Development Indicators Online, World Bank (2004). |
|||||
|
2. |
Reserve Bank of India. |
|||||
|
Table 6.7 : Distribution of Outstanding Credit of Scheduled Commercial Banks |
||||||||||
|
According to Occupation |
||||||||||
|
(Per cent to Total) |
||||||||||
|
Item |
Jun-80 |
Jun-85 |
Mar-90 |
Mar-95 |
Mar-00 |
Mar-01 |
Mar-02 |
Mar-03 |
||
|
1 |
2 |
3 |
4 |
5 |
6 |
7 |
8 |
9 |
||
|
I. |
Agriculture |
14.8 |
17.6 |
15.9 |
11.8 |
9.9 |
9.6 |
9.8 |
10.0 |
|
|
1. |
Direct Finance |
11.3 |
14.7 |
13.8 |
10.2 |
8.4 |
8.1 |
7.2 |
7.8 |
|
|
2. |
Indirect Finance |
3.4 |
3.0 |
2.1 |
1.7 |
1.5 |
1.5 |
2.5 |
2.2 |
|
|
II. |
Industry |
48.0 |
41.3 |
48.7 |
45.6 |
46.5 |
43.9 |
41.4 |
41.0 |
|
|
1. |
Mining and Quarrying |
0.8 |
0.6 |
0.8 |
0.7 |
1.1 |
1.2 |
1.8 |
1.8 |
|
|
2. |
Food, Manufacturing and Other |
|||||||||
|
Processing Industries |
4.3 |
3.8 |
4.1 |
3.7 |
3.8 |
3.6 |
3.2 |
3.1 |
||
|
3. |
Bevarage and Tobacco Industries |
0.9 |
0.7 |
0.7 |
0.7 |
0.5 |
0.5 |
0.5 |
0.5 |
|
|
4. |
Manufacture of Textiles |
8.4 |
6.9 |
7.2 |
7.7 |
6.6 |
5.9 |
5.2 |
4.9 |
|
|
5. |
Paper , Paper Products and Printing |
1.7 |
1.7 |
1.6 |
1.3 |
1.1 |
1.0 |
1.1 |
1.1 |
|
|
6. |
Leather and Leather Products |
0.8 |
0.6 |
1.0 |
0.9 |
0.6 |
0.5 |
0.4 |
0.4 |
|
|
7. |
Rubber and Rubber Products |
1.0 |
0.8 |
0.9 |
0.8 |
0.6 |
0.5 |
1.1 |
1.0 |
|
|
8. |
Manufacturer of Chemicals and Chemical Products |
6.1 |
4.8 |
6.1 |
6.1 |
5.8 |
5.5 |
4.6 |
4.6 |
|
|
9. |
Manufacture of Basic Minerals/Petroleum, |
|||||||||
|
coal product and Nuclear Fuels |
1.8 |
0.5 |
0.4 |
0.7 |
3.2 |
2.4 |
1.9 |
1.5 |
||
|
10. |
Manufacture of Cement |
0.5 |
0.6 |
0.8 |
0.6 |
0.9 |
0.9 |
0.9 |
0.9 |
|
|
11. |
Basic Metals and Metal Products |
5.2 |
4.6 |
5.2 |
5.1 |
5.4 |
5.1 |
5.1 |
4.9 |
|
|
12. |
Engineering |
9.9 |
7.3 |
8.6 |
7.8 |
5.5 |
5.4 |
4.9 |
4.5 |
|
|
13. |
Vehicles, Vehicle Parts and |
|||||||||
|
Transport Equipments |
2.5 |
2.3 |
2.2 |
1.4 |
1.8 |
1.7 |
1.7 |
1.5 |
||
|
14. |
All Other Industries |
3.1 |
4.9 |
7.1 |
5.9 |
6.7 |
6.3 |
4.0 |
4.2 |
|
|
15. |
Electricity Generation,Transmission |
|||||||||
|
and Distribution |
0.5 |
0.6 |
0.8 |
0.8 |
1.9 |
2.2 |
2.9 |
3.3 |
||
|
16. |
Construction |
0.8 |
0.8 |
1.4 |
1.4 |
1.2 |
1.2 |
2.3 |
2.7 |
|
|
III. |
Transport |
4.3 |
4.8 |
3.2 |
1.9 |
1.8 |
1.6 |
1.4 |
1.2 |
|
|
IV. |
Personal Loans and |
|||||||||
|
Professional Services |
2.2 |
6.4 |
9.4 |
11.3 |
14.4 |
15.8 |
16.8 |
19.6 |
||
|
1. |
Loans for Purchase of Consumer Durables |
.. |
0.2 |
0.4 |
0.3 |
0.6 |
0.6 |
0.5 |
0.4 |
|
|
2. |
Loans for Housing |
.. |
1.6 |
2.4 |
2.8 |
4.0 |
4.7 |
5.0 |
6.5 |
|
|
V. |
Trade |
22.2 |
23.4 |
13.9 |
17.1 |
15.6 |
16.6 |
15.4 |
13.8 |
|
|
VI. |
Financial Institutions |
0.8 |
1.2 |
2.1 |
3.8 |
4.8 |
4.9 |
5.7 |
6.7 |
|
|
VII. |
Miscellaneous / All Others |
7.6 |
5.3 |
6.8 |
8.5 |
7.1 |
7.5 |
9.5 |
7.7 |
|
|
Total |
100.0 |
100.0 |
100.0 |
100.0 |
100.0 |
100.0 |
100.0 |
100.0 |
||
|
Memo: |
||||||||||
|
Services |
24.2 |
26.3 |
30.5 |
31.9 |
31.9 |
32.8 |
35.6 |
36.8 |
||
|
.. |
Not Available |
|||||||||
|
Note |
: Services are defined to include construction, transport, professional and other services, housing, trade (excluding food procurement), |
|||||||||
|
finance and other services. |
||||||||||
|
Source |
: Basic Statistical Returns of Scheduled Commercial Banks (various issues), Reserve Bank of India. |
|||||||||
of agricultural credit – direct as well as indirect credit –have contributed to this increase. Thus, notwithstanding the falling share of agriculture in overall economic activity, credit to agriculture (as a proportion of overall GDP) at end-March 2003 was quite close to that at end-March 1990. In view of the declining role of agriculture in overall activity, it would be more appropriate to examine movements in credit to the agricultural sector in relation to its own sectoral GDP. An analysis based on this approach shows a general upward movement in credit to agricultural sector, barring a downward trend in the first half of the 1990s. Illustratively, the ratio of credit to the agricultural sector to its own GDP at around 15 per cent at end-March 2003 was higher than that of 12 per cent at end-March 1990 (Table 6.8). The analysis thus indicates that the efforts of the Reserve Bank during the
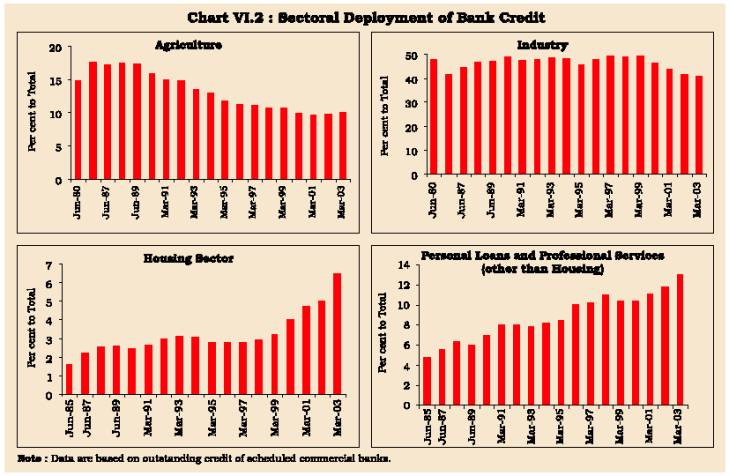
|
Table 6.8: Credit to Various Sectors of the Economy from Scheduled Commercial Banks |
||||||||
|
(per cent to GDP) |
||||||||
|
Item |
June |
June |
March |
March |
March |
March |
March |
March |
|
1980 |
1985 |
1990 |
1995 |
2000 |
2001 |
2002 |
2003 |
|
|
1 |
2 |
3 |
4 |
5 |
6 |
7 |
8 |
9 |
|
Per cent to Overall GDP |
||||||||
|
Agricultural Credit |
2.6 |
3.6 |
3.4 |
2.5 |
2.4 |
2.5 |
2.8 |
3.1 |
|
Direct |
2.0 |
3.0 |
3.0 |
2.1 |
2.0 |
2.1 |
2.1 |
2.4 |
|
(5.3) |
(5.6) |
(5.7) |
(4.0) |
(3.2) |
(3.3) |
(3.4) |
.. |
|
|
Indirect |
0.6 |
0.6 |
0.5 |
0.3 |
0.4 |
0.4 |
0.7 |
0.7 |
|
Industry |
8.5 |
8.4 |
10.5 |
9.5 |
11.0 |
11.3 |
11.9 |
12.5 |
|
Per cent to Respective Sectoral GDP |
||||||||
|
Agricultural Credit |
7.8 |
11.3 |
12.1 |
8.9 |
9.9 |
11.0 |
12.3 |
14.9 |
|
Direct |
6.0 |
9.4 |
10.5 |
7.7 |
8.3 |
9.3 |
9.1 |
11.6 |
|
(15.9) |
(17.5) |
(20.2) |
(14.6) |
(13.6) |
(14.9) |
(15.1) |
.. |
|
|
Indirect |
1.8 |
1.9 |
1.6 |
1.3 |
1.5 |
1.8 |
3.2 |
3.3 |
|
Industry |
45.2 |
43.6 |
52.4 |
47.7 |
61.0 |
60.6 |
65.8 |
67.3 |
|
.. Not Available. |
||||||||
|
Note : Data in brackets are total direct credit to agricultural sector from the banking system inclusive of cooperatives. |
||||||||

এই পৃষ্ঠাটো শ্বেয়াৰ কৰক:


ভাৰতীয় ৰিজাৰ্ভ বেংক মোবাইল এপ্পলিকেষ্যন ইনষ্টল কৰক আৰু নৱীনতম বাতৰিৰ প্ৰৱেশাধিকাৰ পাওক!
আমাৰ এপটো ইনষ্টল কৰিবলৈ QR ক’ড স্কেন কৰক


পৃষ্ঠাটো শেহতীয়া আপডেট কৰা তাৰিখ:


