 IST,
IST,


Monetary Policy Response to Recent Inflation in India
Shri Deepak Mohanty, Executive Director, Reserve Bank of India
delivered-on ছেপ্তে 03, 2011
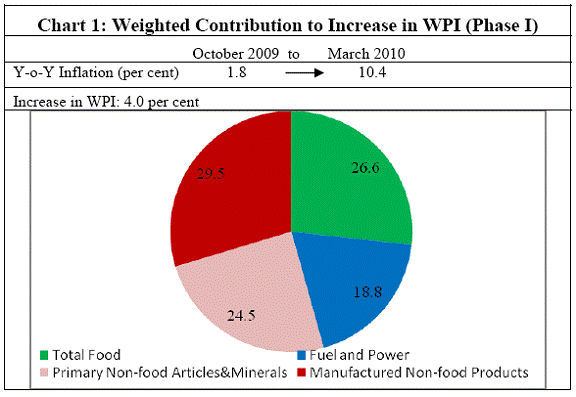
I thank the Indian Institute of Technology (IIT), Guwahati and Mr. Ankit Khemka, Convenor, Techniche 2011, for inviting me to address such a talented and bright group of youngsters . I propose to speak to you about inflation which is a matter of concern to all of us. It has been about two years since October 2009 that the Reserve Bank of India announced its exit from the crisis-driven accommodative monetary policy stance. However, inflation continues to remain elevated, despite sustained monetary policy action. Headline inflation, measured by year-on-year changes in the wholesale price index (WPI), averaged 9.6 per cent in 2010-11 and it has continued to be over 9 per cent in the current financial year so far. This spell of high inflation has been the longest since the mid-1990s. It has, therefore, posed a major challenge for policymakers, especially for the Reserve Bank as the key objective of monetary policy is price stability. Why do we need to worry about inflation? How did the inflation dynamics evolve over the past two years? What was the monetary policy response? These are primarily the questions that I will address. Why do we need to worry about inflation? We need to be concerned about inflation as it has adverse impact on the real economy. First, high and persistent inflation imposes significant socio-economic costs. Given that the burden of inflation is disproportionately large on the poor, high inflation by itself can lead to distributional inequality. Therefore, for a welfare-oriented public policy, low inflation becomes a critical element for ensuring balanced progress. Second, high inflation distorts economic incentives by diverting resources away from productive investment to speculative activities. Third, inflation reduces households saving as they try to maintain the real value of their consumption. Consequent fall in overall investment in the economy reduces its potential growth. Fourth, as inflation rises and turns volatile, it raises the inflation risk premia in financial transactions. Hence, nominal interest rates tend to be higher than they would have been under low and stable inflation. Fifth, if domestic inflation remains persistently higher than those of the trading partners, it affects external competitiveness through appreciation of the real exchange rate. Sixth, as inflation rises beyond a threshold, it has an adverse impact on overall growth. The Reserve Bank’s current assessment suggests that the threshold level of inflation for India is in the range of 4-6 per cent1. If inflation persists beyond this level, it could lower economic growth over the medium-term. These costs, therefore, necessitate monetary policy response to control inflation. How did the inflation dynamics change? It is important to appreciate the background in which the inflation surge has occurred. The current phase of high inflation followed the global financial crisis, which affected the India’s economy, though not with the same intensity as advanced countries. Managing inflation in an economy which is recovering from a downturn is much more complex because of associated uncertainties than managing inflation under normal conditions. Prelude to current inflation surge In the initial phase of the crisis, it appeared that emerging market economies (EMEs) were better positioned to weather the storm created by the global financial meltdown on the back of their substantial foreign exchange reserve cushion, improved policy frameworks and generally robust banking sector and corporate balance sheets. However, any hope about EMEs escaping unscathed could not be sustained after the failure of Lehman Brothers in September 2008 which triggered global deleveraging and heightened risk aversion. Eventually, EMEs were also adversely affected by the spillover effects: first through contraction in world trade and then from reversal in capital flows. India, though initially somewhat insulated from the global developments, was eventually impacted significantly by the global shocks through all the channels – trade, finance and expectations channels. In response, the Reserve Bank swiftly introduced a comprehensive range of measures to limit the impact of the adverse global developments on the domestic financial system and the economy. The Reserve Bank, like most central banks, took a number of conventional and unconventional measures to augment domestic and foreign currency liquidity, and sharply reduced the policy rates. In a span of seven months between October 2008 and April 2009, there was unprecedented policy activism. For example: (i) the repo rate was reduced by 425 basis points to 4.75 per cent, (ii) the reverse repo rate was reduced by 275 basis points to 3.25 per cent, (iii) the cash reserve ratio (CRR) of banks was reduced by a cumulative 400 basis points of their net demand and time liabilities (NDTL) to 5.0 per cent, and (iv) the total amount of primary liquidity potentially made available to the financial system was over ` 5.6 trillion or over 10 per cent of GDP. The Government also come up with various fiscal stimulus measures. In October 2009, it was not easy to exit from the excessively accommodative monetary policy stance for two main reasons. First, the year-on-year headline WPI inflation had just barely turned positive and was entirely driven by food inflation. Industrial production had started to pick up but exports were still declining. Hence, recovery was not assured. Second, globally, most central banks were in favour of continuing stimulus. On the other hand, domestically, consumer price inflation was high, households’ inflation expectations were rising and surplus liquidity was substantial as reflected in the Reserve Bank’s Liquidity Adjustment Facility (LAF) window. These developments had inflationary consequences. In its Second Quarter Review of Monetary Policy for 2009-10, the Reserve Bank after wider consultations provided the arguments for and against beginning reversal of monetary easing. On balance of considerations, the Reserve Bank judged that the time was appropriate to sequence the exit in a calibrated way so that while the recovery process was not hampered, inflation expectations remained anchored. The exit process thus began with the closure of the special liquidity facilities instituted during the crisis. This amounted to withdrawal of potential liquidity to the tune of ` 1.7 trillion. Phases of Inflation The evolution of the inflation process since the beginning of the exit in October 2009 can be characterised into four different phases: Phase I - October 2009-March 2010; Phase II - April-July 2010; Phase III - August-November 2010; and Phase IV - December 2010 onwards. As the drivers of inflation changed over the phases, the response of monetary policy was calibrated on the basis of changing dynamics of inflation as also the growth-inflation balance and the evolving global economic conditions. Phase I. October 2009- March 2010 The year-on-year headline WPI inflation accelerated from under 2 per cent in October 2009 to above 10 per cent by March 2010 (Chart 1).
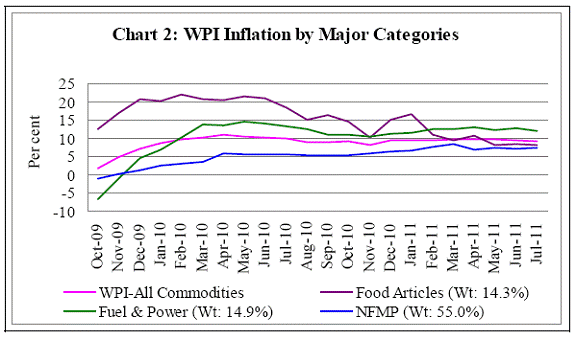
A major part of this increase in inflation was attributed to the waning of base effect. In addition, the price pressures largely emanated from food. There was severe deficiency in rainfall during 2009-10, which adversely affected the food prices. Moreover, global commodity prices rebounded from the trough reached during the crisis. Fuel prices rose significantly during this period. Manufactured non-food products inflation also reverted to its medium-term trend (Chart 2).
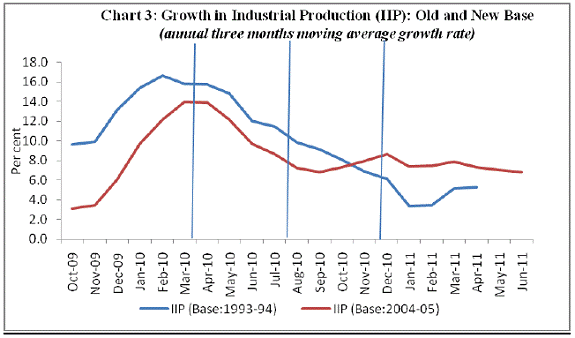
The Reserve Bank, in its Second Quarter Review of monetary policy in October 2009, highlighted the need for exit from crisis-time monetary policy stimulus and withdrew the unconventional liquidity support measures and restored the statutory liquidity ratio (SLR) of banks to the pre-crisis level. At the same time, monetary policy had to recognise that the economic growth was recovering from the crisis time slowdown and any aggressive monetary tightening at that point would have affected the recovery. Subsequently, in January 2010, the CRR was raised by 75 basis points of banks’ net demand and time liabilities (NDTL), and policy rates were increased for the first time in March 2010 by 25 basis points. The transmission of rate-based monetary policy actions was weak during the periods of surplus liquidity in the financial system and, therefore, bringing down liquidity levels was the crucial challenge. The Reserve Bank’s policy action during this period was effective in terms of bringing down the overall surplus liquidity available within the system to the levels consistent with monetary policy stance. At the same time, the recovery in economic growth was not dented as was seen from the trend in growth in industrial output, which picked up during this period (Chart 3).
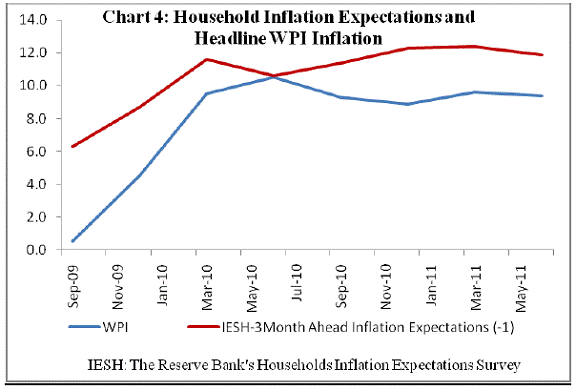
Increase in headline inflation during this period, however, caught up with the households’ inflation expectations (Chart 4).
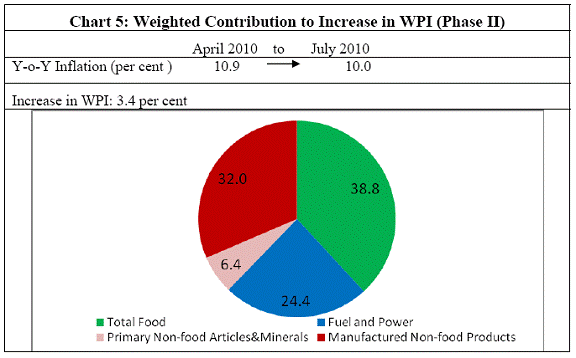
During the initial months of this phase, the major challenge for monetary policy was, on the one hand, to remain supportive of recovery while on the other hand to keep a vigil on the build-up of inflationary pressures which were getting amplified by the deficit in monsoon rainfall. Subsequently, increases in global commodity prices, especially fuel, emerged as a key risk. At the same time, consolidating recovery necessitated a shift in the monetary policy stance from 'managing the crisis' to 'managing the recovery'. Phase II. April –July 2010 During this phase, year-on-year WPI inflation remained stubborn around 10 per cent and the index advanced by 3.4 per cent (Chart 5).
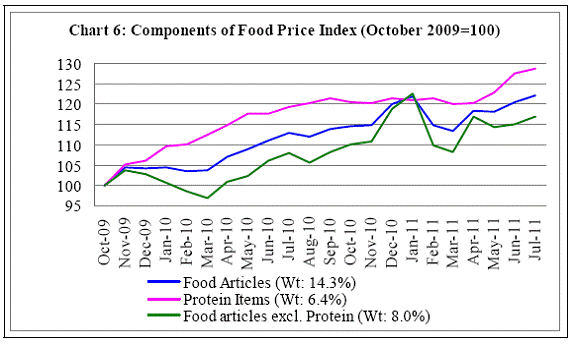
It was expected that with a normal monsoon during 2010-11, food inflation would moderate. But, contrary to expectations, the major driver of inflation in this period was food. In fact, inflation in cereals, pulses and vegetables was significantly lower in July 2010 as compared with the March 2010 levels indicating that the good monsoon indeed had a moderating impact on these items. However, food inflation did not decline as price pressures were emanating from the protein-rich items such as milk, egg, meat and fish, whose output was less responsive to monsoon (Chart 6). The demand for these items has been growing with increasing per capita income and changing dietary patterns. In the absence of adequate supply response, price pressures were substantial. Another major contributor to increase in WPI during this period was the increase in administered prices of petroleum products and deregulation of petrol prices in June 2010. The major contribution to inflation thus emanated from food and fuel.
During this period, the key policy rates were increased gradually with a narrowing of the LAF interest rate corridor in order to reduce volatility in the overnight interest rate. While the level of inflation had increased, industrial production was showing a declining trend (Chart 3). On the global front, the weak US recovery and concerns over sovereign debt sustainability in euro area during this period raised fears of a double dip-recession and global commodity prices declined marginally. Moreover, the pressure on inflation during this period emerged largely from food and administered price revisions. Given the limitations of demand management policies to address supply shock induced inflation, monetary policy actions were geared towards normalisation of policy rates as well as anchoring inflation expectations. During this period, policy rates were raised thrice and the CRR was raised once (Table).
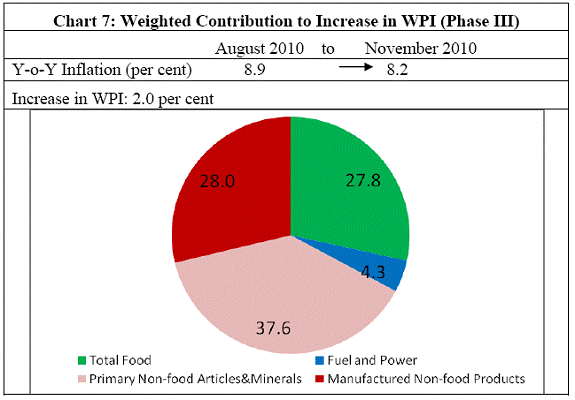
By the end of this period, the liquidity in the system turned into deficit as was evident from banks borrowing from the LAF of the Reserve Bank. Therefore, effective policy rate showed an additional increase by the width of LAF interest rate corridor, i.e., 100 basis points, as the repo rate became the policy rate. The transition of liquidity situation from surplus to deficit mode also set the stage for improved monetary transmission. Phase III. August-November 2010 This phase was marked by slowing down of price pressures as headline inflation declined to 8.2 per cent by November 2010 from above 10 per cent in the preceding phase (Chart 7). The increase in WPI during this phase by just 2.0 per cent was also moderate compared to the previous two phases. Of the increase in WPI, a major part emanated from the primary non-food articles, mostly raw cotton and minerals. The build-up in primary non-food articles prices, however, contained the risk in that they might pass-through to manufactured products inflation, depending on the prevailing demand conditions, the signs of which were first seen in November 2010.
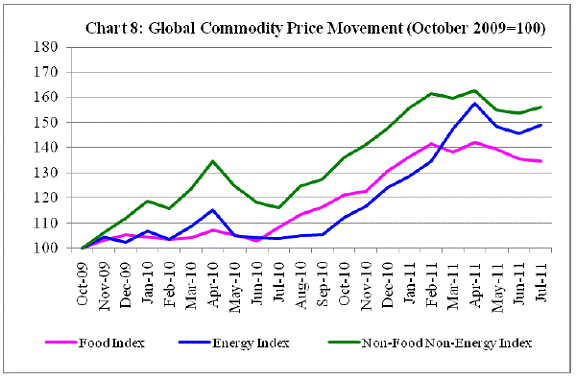
Moderate softening of price pressures during this period also reflected that the calibrated approach of monetary policy was having an impact on demand in a non-disruptive manner. The available data then on industrial production from the old-base IIP series indicated that there was a slowdown in overall IIP growth. However, inflation expectations remained elevated. Global commodity price rebound in this period was largely driving the industrial raw material prices (Chart 8). But, monetary policy had to be cautious as mixed signs on growth sustainability were becoming evident coupled with gradual decline in inflation. At the same time, as inflation remained significantly above the comfort level, monetary policy had to act to anchor inflation expectations. Thus, the trend of moderating inflation and consolidating growth in the second and third quarters of 2010-11 justified the calibrated policy approach of the Reserve Bank.
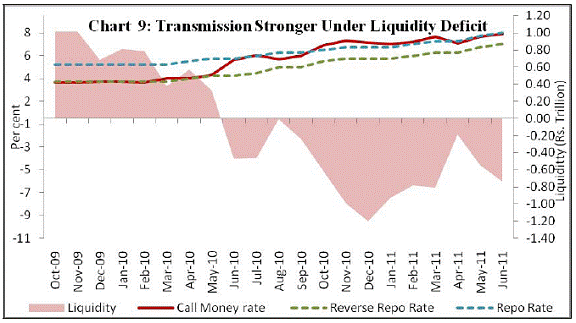
Transmission of monetary policy improved significantly during this period as liquidity continued to remain in deficit with significant increase in banks borrowing from the repo window (Chart 9). Rates in all the segments of the financial market increased during this period with more prominent increase in the call money rate.
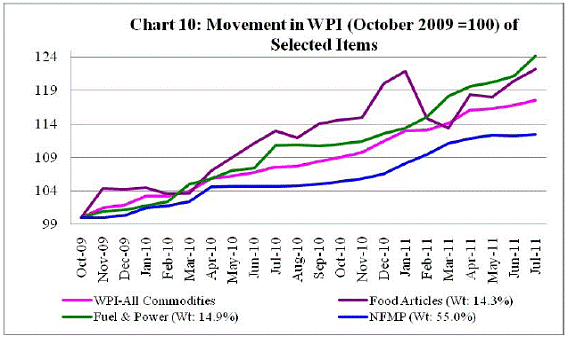
Phase IV. December 2010 Onwards The moderately declining trend in inflation changed course significantly during this period: first, on account of a spurt in food inflation as unseasonal rains in some parts of the country caused significant damage to output of vegetables and subsequently on account of stronger than expected pass-through of increase in input costs to output prices (Chart 10).
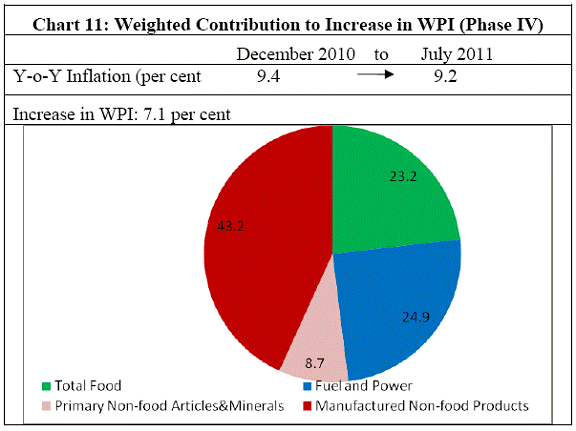
The contribution of non-food manufactured products inflation to overall increase in WPI rose significantly during this period. The inflation in this group reached a high of 8.5 per cent in March 2011 and remained at or above 7 per cent thereafter indicating generalised price pressures. Consequently, the share of non-food manufactured product inflation rose sharply during this phase (Chart 11).
Given the high global commodity prices and their likelihood to remain firm, the threat to price stability from global inflation continues to persist. The faster than expected increase in core inflation suggested that high inflation was becoming increasingly persistent. There was also evidence of demand pressure from increase in real wages besides high fiscal deficit. Monetary policy also had to recognise that over the long-run, high inflation is inimical to sustained growth. It slows investment by creating uncertainty and thus poses significant risks to future growth. It was indicated by the Reserve Bank that bringing down inflation, given its generalised nature, even at the cost of some growth in the short-run, should take precedence.2 Taking into account these emerging factors, monetary policy was continuously tightened during this period both in terms of the number of increases as well as in terms of the stepped up magnitude of increase in the policy rate (Table). The increasing generalisation of inflation indicated that the supply shocks had morphed into a more generalised inflation process. Conclusions First, inflation in India has remained elevated and persistent over 18 months now. The inflation path was influenced by a number of domestic and international supply shocks. Monsoon failure in 2009-10 and sharp increase in international fuel and commodities prices accentuated domestic inflationary pressures. Second, the evolution of inflation so far from its low level in October 2009 can be seen in four phases: first, driven by food prices and then by fuel and industrial raw material prices, and finally spilling over to a generalised inflation process. In fact, inflation was on a declining trajectory between August and November 2010 before reversing course in December and getting generalised. Third, monetary policy response began early in October 2009 in anticipation of the likely path of the inflation trajectory as also on consideration of its source and composition. The background of calibrated monetary policy response is important as policy was reversed from its highly stimulative stance with policy interest rates at the historically lowest levels and liquidity was high. During this period, the global economy remained mired in uncertainties and domestic recovery was also not assured. Fourth, the initial rounds of monetary policy response was in the nature of normalisation from an excessively stimulative stance in a non-disruptive manner. The policy response was calibrated to the domestic growth-inflation dynamics. As growth took hold and inflation became more generalised, monetary policy response was strengthened. Initially, monetary transmission was weak as systemic liquidity was in surplus. But once liquidity turned into deficit in July 2010, monetary transmission improved. Fifth, since October 2009, the cash reserve ratio (CRR) has been raised by 100 basis points. The policy repo rate has been raised by a cumulative 325 basis points. As the liquidity in the system transited from surplus to deficit, the effective tightening has been of the order of 475 basis points. Thus, the cumulative monetary policy action would have the desired impact on inflation. It is expected that inflation would moderate towards the later part of 2011-12 and come down to around 7 per cent by the end of the year. The current monetary stance remains anti-inflationary. Sixth, inflation imposes real costs which are borne disproportionately by the different segments of the economy. Prolonged high inflation, even if originating from the supply side, could give rise to increased inflation expectations and cause general prices to rise. As inflation is inimical to growth, it becomes necessary for monetary policy to respond to contain inflation and anchor inflationary expectations. Seventh, the medium-term objective of the Reserve Bank is to bring down inflation to 3.0 per cent consistent with India’s broader integration into the global economy. In this direction, monetary policy aims to contain perceptions of inflation in the range of 4.0–4.5 per cent with a particular focus on the behaviour of the non-food manufacturing component. This objective is consistent with the estimated threshold level of inflation of 4–6 per cent suggesting the absence of a ‘new normal’ for inflation in India. Finally, at the end of my talk what advice can I give to this gathering of bright minds? I believe, innovation and enterprise coupled with the spirit of youth will rapidly propel India to its rightful place in the global economy in the coming years. So unless you dare the frontiers, we will not know what lies beyond. Thank you for your kind attention. * Speech by Shri Deepak Mohanty, Executive Director, Reserve Bank of India, delivered at the Indian Institute of Technology (IIT), Guwahati on 3rd September 2011. The assistance provided by G.V. Nadhanael is acknowledged. 1 Reserve Bank of India Annual Report 2010-11. 2 Monetary Policy Statement 2011-12, May 3, 2011, Reserve Bank of India. |
||||||||||||||||||||||||||||||||||||||||||||||||||||||||||||||||||||||||||||||||||
পৃষ্ঠাটো শেহতীয়া আপডেট কৰা তাৰিখ:


