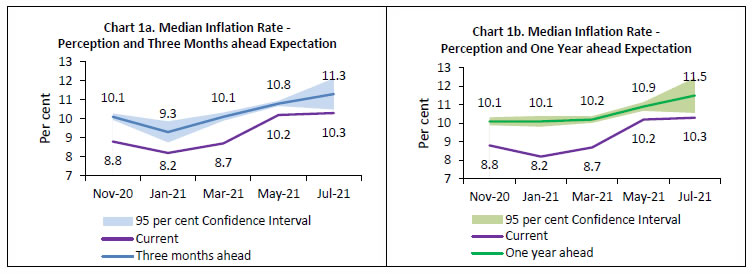
Today, the Reserve Bank released the results of the July 2021 round of the Inflation Expectations Survey of Households (IESH)1. In view of the Covid-19 pandemic, the survey was conducted through field interviews, wherever possible, and telephonic interviews elsewhere, during June 28 to July 9, 2021 in 18 major cities. The results2 are based on responses from 5,963 urban households3.
Highlights:
Households’ median inflation perception for the current period remained elevated at 10.3 per cent [Charts 1a and 1b; Table 3].
Median inflation expectations for three months and one year ahead period hardened by 50 basis points and 60 basis points, respectively, in the latest survey round. [Charts 1a and 1b; Table 3].
Over 60 per cent of the respondents expect higher general inflation over the next quarter as well as over the next one year [Tables 1a and 1b].
One year ahead expectations on general prices and inflation were mostly aligned with the respondents’ surmise for the cost of non-food products and services [Table 4].
Households expect higher rise in food prices over three month horizon when compared to that over one year horizon [Tables 1a and 1b].
Table 1(a): Product-wise Expectations of Prices for Three Months ahead
(Percentage of Respondents)
Survey period ended
Jul-20
Jan-21
Mar-21
May-21
Jul-21
General
Estimate
SE
Estimate
SE
Estimate
SE
Estimate
SE
Estimate
SE
Prices will increase
83.5
0.92
83.7
0.89
86.6
0.74
83.7
0.68
85.9
0.79
Price increase more than current rate
52.2
1.14
56.0
1.26
58.4
1.14
58.5
0.91
63.0
1.15
Price increase similar to current rate
26.0
1.03
22.4
0.95
24.1
0.94
21.2
0.76
19.6
0.90
Price increase less than current rate
5.3
0.54
5.3
0.53
4.1
0.50
4.0
0.37
3.3
0.38
No changes in prices
14.0
0.84
14.3
0.86
11.1
0.71
14.0
0.63
11.3
0.70
Decline in prices
2.5
0.43
1.9
0.30
2.3
0.29
2.3
0.30
2.8
0.40
Food Product
Prices will increase
82.3
0.86
80.9
0.95
85.2
0.70
84.4
0.72
84.0
0.81
Price increase more than current rate
54.7
1.08
54.2
1.16
61.2
1.01
60.2
0.92
61.0
1.15
Price increase similar to current rate
21.9
0.89
20.0
0.95
18.1
0.81
19.4
0.75
17.6
0.89
Price increase less than current rate
5.7
0.47
6.7
0.57
6.0
0.55
4.8
0.38
5.4
0.53
No changes in prices
13.2
0.75
13.0
0.82
9.3
0.60
11.8
0.63
10.5
0.65
Decline in prices
4.5
0.56
6.1
0.54
5.5
0.45
3.9
0.39
5.5
0.53
Non- Food Product
Prices will increase
79.1
0.99
79.3
0.98
81.0
0.78
78.6
0.79
82.6
0.85
Price increase more than current rate
48.3
1.11
51.6
1.20
57.0
1.00
53.1
0.95
59.0
1.17
Price increase similar to current rate
24.6
0.98
20.9
0.90
19.4
0.77
19.8
0.75
18.8
0.92
Price increase less than current rate
6.2
0.51
6.7
0.56
4.7
0.43
5.6
0.44
4.7
0.50
No changes in prices
15.2
0.87
16.9
0.91
12.9
0.69
17.1
0.72
12.3
0.73
Decline in prices
5.6
0.59
3.8
0.40
6.2
0.48
4.3
0.42
5.1
0.51
Household Durables
Prices will increase
57.8
1.14
64.3
1.11
68.1
0.92
58.8
0.96
65.6
1.10
Price increase more than current rate
34.7
1.07
42.5
1.15
46.0
0.98
37.7
0.94
45.1
1.19
Price increase similar to current rate
17.6
0.87
16.8
0.77
17.7
0.74
16.4
0.70
16.6
0.86
Price increase less than current rate
5.4
0.48
5.0
0.49
4.4
0.44
4.7
0.40
4.0
0.43
No changes in prices
28.4
1.00
27.2
1.05
24.6
0.84
32.2
0.90
25.3
0.99
Decline in prices
13.8
0.86
8.4
0.58
7.3
0.50
9.0
0.56
9.1
0.66
Cost of Housing
Prices will increase
46.9
1.08
66.1
1.11
68.9
0.93
54.9
0.94
64.7
1.13
Price increase more than current rate
28.1
0.98
45.1
1.20
48.4
1.03
36.5
0.92
45.9
1.21
Price increase similar to current rate
14.9
0.78
16.2
0.79
16.7
0.75
14.4
0.67
14.5
0.79
Price increase less than current rate
3.9
0.39
4.8
0.49
3.8
0.40
3.9
0.36
4.2
0.46
No changes in prices
29.9
1.03
24.6
1.02
22.2
0.86
30.5
0.89
23.7
0.99
Decline in prices
23.2
0.95
9.3
0.66
8.9
0.54
14.6
0.69
11.6
0.74
Cost of Services
Prices will increase
70.1
1.06
68.8
1.06
75.6
0.90
67.6
0.89
74.3
1.02
Price increase more than current rate
43.3
1.11
45.7
1.15
51.6
1.02
44.6
0.94
52.5
1.19
Price increase similar to current rate
21.2
0.92
18.5
0.81
19.4
0.79
18.0
0.71
17.3
0.83
Price increase less than current rate
5.6
0.49
4.6
0.50
4.5
0.44
5.0
0.40
4.5
0.45
No changes in prices
25.7
0.99
27.4
1.02
20.8
0.84
29.2
0.87
22.0
0.95
Decline in prices
4.2
0.52
3.8
0.47
3.6
0.36
3.2
0.35
3.7
0.43
Note: 1. The table provides estimates and standard errors for qualitative responses. 2. Constituent items may not add up to the corresponding total, due to rounding off.
Table 1(b): Product-wise Expectations of Prices for One Year ahead
(Percentage of Respondents)
Survey period ended
Jul-20
Jan-21
Mar-21
May-21
Jul-21
General
Estimate
SE
Estimate
SE
Estimate
SE
Estimate
SE
Estimate
SE
Prices will increase
84.6
0.87
88.0
0.80
88.7
0.61
86.9
0.65
86.8
0.78
Price increase more than current rate
55.9
1.12
62.9
1.23
63.4
1.07
62.4
0.91
65.6
1.18
Price increase similar to current rate
24.3
0.93
21.2
0.95
21.4
0.87
20.3
0.75
18.3
0.93
Price increase less than current rate
4.4
0.46
3.9
0.43
3.8
0.44
4.2
0.38
2.9
0.38
No changes in prices
12.9
0.82
9.6
0.75
8.5
0.54
10.4
0.58
10.1
0.68
Decline in prices
2.5
0.35
2.4
0.33
2.8
0.32
2.7
0.33
3.1
0.41
Food Product
Prices will increase
75.3
1.00
80.5
0.96
81.7
0.74
81.7
0.76
80.8
0.87
Price increase more than current rate
45.2
1.10
53.0
1.21
54.6
1.01
53.5
0.95
55.9
1.18
Price increase similar to current rate
24.1
0.96
22.6
0.96
22.2
0.83
22.6
0.77
20.7
0.98
Price increase less than current rate
6.0
0.50
4.9
0.49
4.9
0.46
5.6
0.43
4.2
0.45
No changes in prices
17.4
0.88
13.4
0.84
12.0
0.61
12.5
0.64
12.6
0.73
Decline in prices
7.3
0.63
6.1
0.55
6.3
0.45
5.8
0.46
6.6
0.54
Non- Food Product
Prices will increase
74.3
1.04
80.4
0.93
79.9
0.79
79.2
0.78
80.3
0.91
Price increase more than current rate
44.0
1.13
52.8
1.22
54.0
1.02
51.8
0.96
56.8
1.21
Price increase similar to current rate
24.3
0.92
22.7
0.93
21.4
0.83
21.8
0.76
19.0
0.91
Price increase less than current rate
6.0
0.50
4.9
0.45
4.6
0.44
5.7
0.44
4.6
0.48
No changes in prices
18.7
0.97
15.0
0.84
13.4
0.66
15.8
0.70
13.4
0.76
Decline in prices
7.0
0.71
4.6
0.46
6.6
0.47
5.0
0.44
6.2
0.57
Household Durables
Prices will increase
62.4
1.14
69.8
1.07
70.3
0.90
64.7
0.94
69.1
1.06
Price increase more than current rate
35.6
1.08
45.0
1.20
47.2
0.98
41.2
0.94
47.0
1.18
Price increase similar to current rate
21.1
0.91
19.9
0.81
18.8
0.74
18.6
0.72
18.3
0.88
Price increase less than current rate
5.8
0.51
4.9
0.48
4.4
0.42
4.9
0.39
3.8
0.41
No changes in prices
26.0
1.01
22.1
0.97
22.7
0.81
26.7
0.86
22.7
0.97
Decline in prices
11.6
0.81
8.1
0.63
6.9
0.48
8.6
0.55
8.2
0.62
Cost of Housing
Prices will increase
57.4
1.10
74.8
1.05
75.7
0.86
65.4
0.93
71.8
1.08
Price increase more than current rate
34.7
1.10
49.9
1.22
53.8
1.04
43.5
0.97
50.9
1.21
Price increase similar to current rate
18.4
0.88
20.2
0.91
18.3
0.79
17.5
0.71
16.6
0.87
Price increase less than current rate
4.3
0.43
4.7
0.48
3.6
0.38
4.5
0.40
4.2
0.44
No changes in prices
26.1
1.01
17.7
0.95
17.8
0.76
23.3
0.83
19.8
0.92
Decline in prices
16.5
0.83
7.5
0.61
6.5
0.48
11.2
0.62
8.4
0.68
Cost of Services
Prices will increase
75.6
1.06
78.5
0.98
81.4
0.75
76.5
0.82
80.9
0.88
Price increase more than current rate
46.1
1.11
51.1
1.21
55.2
1.02
50.0
0.94
55.9
1.17
Price increase similar to current rate
23.7
0.90
22.9
0.96
21.5
0.82
21.3
0.75
20.5
0.91
Price increase less than current rate
5.8
0.50
4.6
0.45
4.7
0.44
5.2
0.43
4.5
0.47
No changes in prices
20.5
0.97
18.2
0.94
15.2
0.67
20.1
0.77
15.7
0.80
Decline in prices
3.9
0.57
3.3
0.41
3.4
0.35
3.4
0.36
3.4
0.42
Note: 1. The table provides estimates and standard errors for qualitative responses. 2. Constituent items may not add up to the corresponding total, due to rounding off.
Table 2: Inflation Expectations of Various Groups: Jul-21
Current Perception
Three Months ahead Expectation
One Year ahead Expectation
Mean
Median
Mean
Median
Mean
Median
Estimate
SE
Estimate
SE
Estimate
SE
Estimate
SE
Estimate
SE
Estimate
SE
Overall
10.5
0.11
10.3
0.06
11.7
0.11
11.3
0.42
11.0
0.13
11.5
0.49
Gender-wise
Male
10.8
0.13
10.4
0.07
11.8
0.13
11.9
0.52
11.0
0.16
11.9
0.50
Female
10.2
0.14
10.1
0.11
11.4
0.14
10.8
0.15
10.7
0.18
10.9
0.22
Category-wise
Financial Sector Employees
10.4
0.73
9.3
1.13
11.0
0.64
10.5
1.00
10.5
0.65
10.7
0.44
Other Employees
10.7
0.18
10.3
0.08
11.8
0.17
11.7
0.54
11.2
0.23
12.0
0.61
Self Employed
11.0
0.20
10.5
0.09
12.0
0.19
12.1
0.75
11.0
0.26
12.3
0.69
Homemaker
10.1
0.17
10.1
0.14
11.3
0.16
10.8
0.15
10.6
0.20
10.8
0.21
Retired Persons
11.5
0.39
11.0
1.00
12.3
0.37
13.7
1.34
10.9
0.50
12.9
1.38
Daily Workers
10.3
0.26
10.0
0.31
11.3
0.27
10.8
0.30
10.4
0.33
10.7
0.26
Other category
10.0
0.25
9.5
0.51
11.1
0.24
10.7
0.27
10.7
0.29
10.8
0.31
Age Group-wise
Up to 25 years
9.8
0.19
8.9
0.30
10.8
0.19
10.3
0.15
10.6
0.24
10.7
0.20
25 to 30 years
10.0
0.18
9.9
0.26
11.1
0.19
10.7
0.14
10.7
0.23
10.9
0.29
30 to 35 years
10.5
0.20
10.2
0.14
11.5
0.20
11.2
0.56
11.0
0.23
11.1
0.54
35 to 40 years
10.5
0.19
10.3
0.09
11.6
0.20
11.3
0.45
10.8
0.25
11.0
0.40
40 to 45 years
10.6
0.23
10.3
0.12
11.6
0.22
11.4
0.59
10.9
0.28
11.7
0.76
45 to 50 years
10.7
0.24
10.4
0.09
11.9
0.24
12.0
0.79
11.0
0.31
11.2
0.63
50 to 55 years
11.4
0.26
10.8
0.27
12.3
0.26
13.7
1.22
11.2
0.35
12.7
1.00
55 to 60 years
10.7
0.31
10.4
0.13
11.6
0.30
11.6
0.79
10.1
0.43
10.7
0.41
60 years and above
11.1
0.29
10.6
0.13
12.2
0.29
13.0
0.98
11.1
0.41
12.7
1.36
City-wise
Ahmedabad
10.5
0.44
10.4
0.31
12.4
0.43
13.4
1.24
12.5
0.45
14.2
1.22
Bengaluru
10.2
0.35
10.2
0.27
12.2
0.30
13.2
1.33
12.0
0.41
15.2
0.66
Bhopal
9.8
0.79
9.7
1.15
10.7
0.74
10.7
1.51
8.9
0.76
9.1
1.57
Bhubaneswar
10.1
0.69
10.3
0.53
11.2
0.66
11.2
1.01
9.2
0.90
10.4
2.16
Chennai
9.6
0.40
9.6
0.83
10.9
0.37
10.6
0.29
10.8
0.48
11.9
1.22
Delhi
11.1
0.26
10.4
0.12
12.1
0.25
12.5
0.86
11.3
0.31
11.8
1.02
Guwahati
11.6
0.56
11.1
1.37
11.8
0.54
11.5
1.16
11.9
0.72
12.0
2.08
Hyderabad
10.7
0.46
10.4
0.87
11.8
0.42
12.7
1.97
10.8
0.48
12.3
1.70
Jaipur
11.5
0.59
10.8
0.66
11.4
0.67
11.6
1.51
11.8
0.82
14.6
1.45
Kolkata
11.5
0.35
10.8
0.68
12.4
0.35
14.1
1.48
11.3
0.45
12.5
1.36
Lucknow
10.2
0.67
9.1
0.53
10.6
0.59
10.0
0.55
10.5
0.71
10.5
0.89
Mumbai
11.0
0.29
10.4
0.18
11.9
0.28
11.8
0.88
10.4
0.37
11.3
0.63
Nagpur
8.4
0.41
7.5
0.71
10.1
0.43
9.1
0.68
8.9
0.59
8.9
0.77
Patna
9.5
0.50
8.9
0.66
10.2
0.55
9.6
0.49
9.3
0.68
9.2
0.58
Thiruvananthapuram
6.7
0.80
5.3
0.65
8.3
0.84
6.9
0.63
9.3
0.96
8.1
1.24
Chandigarh
11.0
0.47
10.4
0.27
11.0
0.63
10.8
0.85
10.1
0.91
10.4
0.95
Ranchi
7.2
0.48
6.5
0.60
7.9
0.46
7.5
0.43
7.5
0.64
7.6
0.79
Raipur
6.7
0.52
5.6
0.21
8.3
0.71
7.4
0.61
10.4
0.71
10.8
0.70
Note: The table provides estimates and standard errors for quantitative responses.
Table 3: Household Inflation Expectations – Current Perception, Three Months and One Year Ahead Expectations
Current Perception
Three Months ahead Expectation
One Year ahead Expectation
Mean
Median
Mean
Median
Mean
Median
Estimate
SE
Estimate
SE
Estimate
SE
Estimate
SE
Estimate
SE
Estimate
SE
Jul-20
10.0
0.11
9.9
0.21
10.8
0.11
10.5
0.06
9.8
0.14
10.3
0.08
Jan-21
9.1
0.12
8.2
0.17
10.0
0.12
9.3
0.29
9.7
0.13
10.1
0.15
Mar-21
9.4
0.11
8.7
0.16
10.4
0.11
10.1
0.11
10.0
0.12
10.2
0.09
May-21
10.4
0.09
10.2
0.04
11.4
0.09
10.8
0.07
10.7
0.11
10.9
0.12
Jul-21
10.5
0.11
10.3
0.06
11.7
0.11
11.3
0.42
11.0
0.13
11.5
0.49
Note: The table provides estimates and standard errors for quantitative responses.
Table 4: Households Expecting General Price Movements in Coherence with Movements in Price Expectations of Various Product Groups: Three Months Ahead and One Year Ahead
(Percentage of Respondents)
Survey period ended
Food
Non-Food
Households durables
Housing
Cost of services
Three Months Ahead
Jul-20
62.8
61.0
49.9
43.6
58.4
Jan-21
63.3
64.3
54.5
55.7
62.8
Mar-21
67.0
65.7
57.4
58.6
65.1
May-21
68.0
65.1
51.8
50.3
60.5
Jul-21
67.6
69.0
58.4
56.9
65.0
One Year Ahead
Jul-20
63.9
64.5
55.2
51.2
65.7
Jan-21
68.4
68.6
60.6
63.0
69.0
Mar-21
69.6
70.1
62.4
65.5
71.6
May-21
68.3
67.1
57.7
57.1
67.2
Jul-21
70.1
71.0
63.3
63.5
71.4
Note: Figures are based on sample observations
Table 5(a): Cross-tabulation of Number of Respondents by Current Inflation Perception and Three Months Ahead Inflation Expectations: Jul-21
Three Months Ahead Inflation Rate (per cent)
Current Inflation Rate (per cent)
<1
1-<2
2-<3
3-<4
4-<5
5-<6
6-<7
7-<8
8-<9
9-<10
10-<11
11-<12
12-<13
13-<14
14-<15
15-<16
>=16
No idea
Total
<1
2
0
1
0
0
0
0
0
0
0
0
0
0
0
0
0
0
0
3
1-<2
2
15
13
4
1
1
0
0
0
0
2
0
0
0
0
0
0
0
38
2-<3
2
8
52
28
23
7
3
6
0
0
2
0
1
0
0
0
0
0
132
3-<4
1
1
7
55
41
35
23
9
4
1
5
0
0
0
0
0
0
0
182
4-<5
0
1
3
8
90
64
45
15
10
2
2
0
0
0
0
0
2
0
242
5-<6
1
3
9
18
22
339
113
155
87
16
119
1
2
0
2
9
1
0
897
6-<7
0
1
4
2
7
4
121
71
61
15
19
2
0
0
0
1
1
0
309
7-<8
0
0
3
1
3
7
6
116
76
58
52
4
8
1
1
2
2
0
340
8-<9
0
0
0
0
3
3
6
6
182
59
120
16
29
6
4
6
6
0
446
9-<10
0
0
0
0
0
0
1
1
3
89
56
29
23
6
2
10
4
0
224
10-<11
1
0
2
0
1
35
3
6
10
6
413
56
177
36
24
259
151
0
1180
11-<12
0
0
0
0
0
0
1
0
2
0
1
13
4
5
6
6
2
0
40
12-<13
0
0
0
0
1
0
0
0
0
0
4
0
28
4
13
36
16
0
102
13-<14
0
0
0
0
1
0
0
0
0
0
0
0
0
7
2
12
8
0
30
14-<15
0
0
0
0
0
0
0
0
0
0
0
0
0
0
6
3
14
0
23
15-<16
0
0
0
0
0
3
0
1
0
0
7
0
1
3
0
95
159
0
269
>=16
1
1
1
1
0
9
0
0
0
1
36
0
2
1
2
26
1421
4
1506
Total
10
30
95
117
193
507
322
386
435
247
838
121
275
69
62
465
1787
4
5963
Note: Figures are based on sample observations
Table 5(b): Cross-tabulation of Number of Respondents by Current Inflation Perception and One Year Ahead Inflation Expectations: Jul-21
One Year Ahead Inflation Rate (per cent)
Current Inflation Rate (per cent)
<1
1-<2
2-<3
3-<4
4-<5
5-<6
6-<7
7-<8
8-<9
9-<10
10-<11
11-<12
12-<13
13-<14
14-<15
15-<16
>=16
No idea
Total
<1
1
0
1
0
0
1
0
0
0
0
0
0
0
0
0
0
0
0
3
1-<2
8
7
5
7
2
3
0
0
0
0
5
1
0
0
0
0
0
0
38
2-<3
29
4
18
15
25
13
9
3
3
1
6
0
2
1
0
0
3
0
132
3-<4
25
1
2
23
16
47
14
10
13
7
12
1
5
2
1
2
0
1
182
4-<5
45
0
0
3
36
43
45
15
22
7
14
0
4
2
1
0
5
0
242
5-<6
118
0
4
5
9
178
69
132
75
33
156
9
20
6
8
55
19
1
897
6-<7
34
0
0
2
3
2
64
46
70
16
41
3
8
3
8
1
7
1
309
7-<8
40
0
1
1
0
2
3
75
47
63
56
10
14
3
10
8
7
0
340
8-<9
46
0
0
0
2
4
2
4
111
47
120
27
26
9
4
22
22
0
446
9-<10
23
0
0
0
1
0
1
1
1
57
38
27
32
12
7
16
7
1
224
10-<11
147
0
0
0
2
12
4
6
7
7
266
32
133
38
15
208
299
4
1180
11-<12
4
0
0
1
0
0
0
0
0
0
1
10
6
4
4
3
7
0
40
12-<13
12
0
0
0
0
0
0
0
0
0
1
0
18
1
9
32
29
0
102
13-<14
5
0
0
0
0
0
0
0
0
0
0
0
0
4
1
8
12
0
30
14-<15
2
0
0
0
0
0
0
0
0
0
0
0
0
0
4
2
15
0
23
15-<16
26
0
0
0
0
0
0
0
1
0
4
0
0
2
0
55
181
0
269
>=16
231
0
0
1
0
5
0
1
1
0
16
0
4
0
0
18
1224
5
1506
Total
796
12
31
58
96
310
211
293
351
238
736
120
272
87
72
430
1837
13
5963
Note: Figures are based on sample observations
1The survey results reflect the respondents’ views, which are not necessarily shared by the Reserve Bank. Results of the previous survey round were released on the Bank’s website on June 04, 2021.
2The survey is conducted at bi-monthly intervals by the Reserve Bank of India. It provides directional information on near-term inflationary pressures as expected by the respondents and may reflect their own consumption patterns. Hence, they should be treated as households’ sentiments on inflation.