Today, the Reserve Bank released the results of the 89th round of the Industrial Outlook Survey (IOS) conducted during January-March, 2020. The survey encapsulates qualitative assessments of the business climate by Indian manufacturing companies for Q4:2019-20 and their expectations for Q1:2020-211. In all, 860 companies responded in this round of the survey. In the wake of the sudden adverse impact of the coronavirus outbreak on industrial activities, a quick survey on a few critical IOS parameters was conducted during March 18-20, 2020 among these 860 respondents, of which, 48 companies responded to the repeat survey. The feedback from these 48 companies is summarised in Special Tables 24 and 25. Highlights: A. Assessment for Q4: 2019-20 -
Manufacturing companies assessed some improvement in production and order books in Q4:2019-20 from the weak sentiments exhibited in the previous quarter; the sentiments on employment conditions became mildly optimistic. -
Respondents polled positive sentiments on external demand and their assessment of the overall financial situation improved. -
Prices of raw materials as well as selling prices were assessed to increase, but assessment of profit margins continued to be subdued, albeit there was some abatement in the downbeat sentiments. -
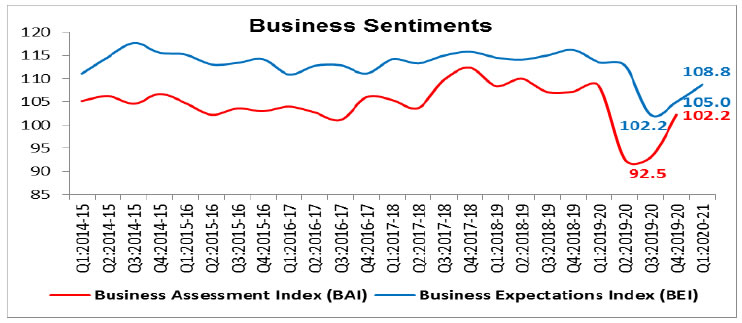
Pressures stemming from interest payments on borrowings and salary expenses were assessed to soften. - The Business Assessment Index (BAI)2 attained a level of 102.2 and moved into the zone of optimism after two successive quarters of prevailing pessimism.
B. Expectations for Q1: 2020-21 -
Respondents expected improvements in demand conditions in Q1: 2020-21. -
Manufacturers remained optimistic on the overall financial situation. -
Manufacturers expected higher selling prices on the back of increased cost pressures from inputs and higher salary outgo; profit margins projections for Q1:2020-21, however, continued to be pessimistic though there was some moderation in pessimism. -
Due to anticipated improvement in the demand parameters, the business expectations index (BEI) increased from 105.0 in Q4:2019-20 to 108.8 in Q1:2020-21. C. Quick survey results (48 companies) -
Respondents of the repeat survey conducted during March 18-20, 2020 covered 48 companies, who assessed demand conditions to deteriorate for the manufacturing sector, which also translated into pessimism on the overall business situation for Q4:2019-20. The outlook for Q1:2020-21 also indicated negative sentiment. -
A comparison of results for the common respondents both for round 89 of IOS as well as the quick survey reflected (a) very sharp deterioration in sentiments across all sectors for Q4:2019-20; and (b) stark pessimism for Q1:2020-21, when compared to their assessment given in the regular round of the survey. Summary Table
Net responses3 | | (per cent) | | Parameters | Assessment period | Expectations period | | Q3:2019-20 | Q4:2019-20 | Q4:2019-20 | Q1:2020-21 | | Production | 0.4 | 13.8 | 17.2 | 23.7 | | Order Books | 0.3 | 10.0 | 16.6 | 18.4 | | Pending Orders | 22.1 | 14.4 | 15.9 | 11.6 | | Capacity Utilisation | -8.3 | 2.0 | 7.9 | 11.3 | | Inventory of Raw Materials | -6.2 | -5.1 | -3.6 | -2.9 | | Inventory of Finished Goods | -11.0 | -6.5 | -6.7 | -4.3 | | Exports | -0.9 | 5.8 | 8.6 | 11.0 | | Imports | 0.9 | 4.7 | 5.4 | 6.6 | | Employment | -1.6 | 2.0 | 1.8 | 5.2 | | Financial Situation (Overall) | 5.3 | 12.8 | 19.5 | 24.3 | | Availability of Finance (from internal accruals) | 6.6 | 13.7 | 13.4 | 17.0 | | Availability of Finance (from banks & other sources) | 7.2 | 10.8 | 11.7 | 11.7 | | Availability of Finance (from overseas, if applicable) | 2.5 | 2.8 | 3.0 | 4.0 | | Cost of Finance | -8.7 | -6.6 | -7.9 | -6.1 | | Cost of Raw Material | -26.1 | -34.1 | -30.0 | -33.6 | | Salary/ Other Remuneration | -27.0 | -24.8 | -22.1 | -33.1 | | Selling Price | -9.6 | 2.5 | 2.2 | 8.3 | | Profit Margin | -22.1 | -11.6 | -10.2 | -2.9 | | Overall Business Situation | 3.5 | 15.7 | 22.6 | 28.2 | | Note: Please see the excel file for time series data |
| Table 1: Assessment and Expectations for Production | | (Percentage responses)@ | | Quarter | Total response | Assessment | Expectations | | Increase | Decrease | No change | Net response | Increase | Decrease | No change | Net response | | Q4:2018-19 | 1,258 | 40.2 | 14.9 | 44.9 | 25.3 | 43.5 | 7.2 | 49.3 | 36.3 | | Q1:2019-20 | 1,231 | 38.6 | 15.6 | 45.8 | 23.0 | 42.1 | 9.3 | 48.5 | 32.8 | | Q2:2019-20 | 481 | 26.5 | 28.4 | 45.2 | -1.9 | 40.1 | 11.0 | 48.9 | 29.1 | | Q3:2019-20 | 775 | 28.7 | 28.3 | 43.1 | 0.4 | 34.8 | 21.0 | 44.2 | 13.9 | | Q4:2019-20 | 860 | 33.6 | 19.8 | 46.6 | 13.8 | 35.4 | 18.2 | 46.4 | 17.2 | | Q1:2020-21 | | | | | | 37.8 | 14.1 | 48.1 | 23.7 | ‘Increase’ in production is optimistic.
@:Due to rounding off percentage may not add up to 100. |
| Table 2: Assessment and Expectations for Order Books | | (Percentage responses) | | Quarter | Total response | Assessment | Expectations | | Increase | Decrease | No change | Net response | Increase | Decrease | No change | Net response | | Q4:2018-19 | 1,258 | 35.3 | 15.9 | 48.8 | 19.5 | 41.0 | 8.5 | 50.5 | 32.5 | | Q1:2019-20 | 1,231 | 34.1 | 15.4 | 50.5 | 18.8 | 38.5 | 8.6 | 52.8 | 29.9 | | Q2:2019-20 | 481 | 27.4 | 30.2 | 42.5 | -2.8 | 31.6 | 11.1 | 57.3 | 20.5 | | Q3:2019-20 | 775 | 26.9 | 26.6 | 46.5 | 0.3 | 34.3 | 20.4 | 45.3 | 13.9 | | Q4:2019-20 | 860 | 30.1 | 20.1 | 49.9 | 10.0 | 33.6 | 17.0 | 49.3 | 16.6 | | Q1:2020-21 | | | | | | 33.5 | 15.1 | 51.4 | 18.4 | | ‘Increase’ in order books is optimistic. Footnote ‘@’ given in Table 1 is applicable here. |
| Table 3: Assessment and Expectations for Pending Orders | | (Percentage responses) | | Quarter | Total response | Assessment | Expectations | | Above Normal | Below Normal | Normal | Net response | Above Normal | Below Normal | Normal | Net response | | Q4:2018-19 | 1,258 | 5.1 | 14.3 | 80.6 | 9.2 | 6.3 | 9.9 | 83.8 | 3.6 | | Q1:2019-20 | 1,231 | 6.0 | 15.7 | 78.3 | 9.6 | 6.1 | 10.4 | 83.5 | 4.3 | | Q2:2019-20 | 481 | 4.5 | 25.5 | 70.0 | 21.0 | 16.1 | 9.4 | 74.5 | -6.7 | | Q3:2019-20 | 775 | 3.4 | 25.5 | 71.1 | 22.1 | 3.9 | 18.3 | 77.8 | 14.4 | | Q4:2019-20 | 860 | 4.1 | 18.5 | 77.4 | 14.4 | 3.7 | 19.5 | 76.8 | 15.9 | | Q1:2020-21 | | | | | | 4.6 | 16.2 | 79.1 | 11.6 | | Pending orders ‘Below Normal’ is optimistic. Footnote ‘@’ given in Table 1 is applicable here. |
| Table 4: Assessment and Expectations for Capacity Utilisation (Main Product) | | (Percentage responses) | | Quarter | Total response | Assessment | Expectations | | Increase | Decrease | No change | Net response | Increase | Decrease | No change | Net response | | Q4:2018-19 | 1,258 | 26.2 | 13.3 | 60.5 | 12.8 | 30.3 | 6.5 | 63.1 | 23.8 | | Q1:2019-20 | 1,231 | 22.8 | 13.4 | 63.8 | 9.4 | 27.2 | 7.7 | 65.1 | 19.6 | | Q2:2019-20 | 481 | 15.9 | 24.9 | 59.2 | -9.0 | 23.1 | 9.2 | 67.7 | 13.9 | | Q3:2019-20 | 775 | 17.5 | 25.8 | 56.7 | -8.3 | 24.4 | 20.0 | 55.6 | 4.4 | | Q4:2019-20 | 860 | 21.0 | 19.0 | 60.0 | 2.0 | 23.1 | 15.2 | 61.6 | 7.9 | | Q1:2020-21 | | | | | | 25.5 | 14.2 | 60.3 | 11.3 | | ‘Increase’ in capacity utilisation is optimistic. Footnote ‘@’ given in Table 1 is applicable here. |
| Table 5: Assessment and Expectations for Level of CU (compared to the average in last 4 quarters) | | (Percentage responses) | | Quarter | Total response | Assessment | Expectations | | Above Normal | Below Normal | Normal | Net response | Above Normal | Below Normal | Normal | Net response | | Q4:2018-19 | 1,258 | 11.6 | 13.0 | 75.3 | -1.4 | 12.7 | 8.6 | 78.7 | 4.1 | | Q1:2019-20 | 1,231 | 9.6 | 14.8 | 75.7 | -5.2 | 12.2 | 8.2 | 79.6 | 4.0 | | Q2:2019-20 | 481 | 8.1 | 26.6 | 65.3 | -18.6 | 9.2 | 8.8 | 82.0 | 0.3 | | Q3:2019-20 | 775 | 6.6 | 26.9 | 66.5 | -20.3 | 9.3 | 21.7 | 69.0 | -12.4 | | Q4:2019-20 | 860 | 7.6 | 21.6 | 70.7 | -14.0 | 7.9 | 18.5 | 73.6 | -10.6 | | Q1:2020-21 | | | | | | 9.1 | 16.4 | 74.5 | -7.3 | | ‘Above Normal’ in Level of capacity utilisation is optimistic. Footnote ‘@’ given in Table 1 is applicable here. |
| Table 6: Assessment and Expectations for Assessment of Production Capacity (with regard to expected demand in next 6 months) | | (Percentage responses) | | Quarter | Total response | Assessment | Expectations | | More than adequate | Less than adequate | Adequate | Net response | More than adequate | Less than adequate | Adequate | Net response | | Q4:2018-19 | 1,258 | 11.2 | 7.4 | 81.4 | 3.8 | 10.6 | 6.1 | 83.3 | 4.5 | | Q1:2019-20 | 1,231 | 11.0 | 6.7 | 82.2 | 4.3 | 12.2 | 6.2 | 81.6 | 6.0 | | Q2:2019-20 | 481 | 15.1 | 14.2 | 70.7 | 0.9 | 13.5 | 6.9 | 79.6 | 6.6 | | Q3:2019-20 | 775 | 15.8 | 11.7 | 72.5 | 4.2 | 15.3 | 12.4 | 72.2 | 2.9 | | Q4:2019-20 | 860 | 14.3 | 9.5 | 76.2 | 4.8 | 14.6 | 11.4 | 74.0 | 3.2 | | Q1:2020-21 | | | | | | 13.7 | 8.8 | 77.5 | 4.9 | | ‘More than adequate’ in Assessment of Production Capacity is optimistic. Footnote ‘@’ given in Table 1 is applicable here. |
| Table 7: Assessment and Expectations for Exports | | (Percentage responses) | | Quarter | Total response | Assessment | Expectations | | Increase | Decrease | No change | Net response | Increase | Decrease | No change | Net response | | Q4:2018-19 | 1,258 | 25.0 | 12.0 | 63.0 | 13.0 | 27.8 | 8.0 | 64.2 | 19.8 | | Q1:2019-20 | 1,231 | 24.6 | 11.5 | 64.0 | 13.1 | 25.7 | 8.0 | 66.2 | 17.7 | | Q2:2019-20 | 481 | 21.3 | 21.3 | 57.5 | 0.0 | 24.0 | 8.2 | 67.8 | 15.8 | | Q3:2019-20 | 775 | 18.3 | 19.2 | 62.5 | -0.9 | 24.3 | 17.0 | 58.7 | 7.3 | | Q4:2019-20 | 860 | 20.1 | 14.3 | 65.5 | 5.8 | 22.4 | 13.8 | 63.9 | 8.6 | | Q1:2020-21 | | | | | | 22.5 | 11.5 | 66.0 | 11.0 | | ‘Increase’ in exports is optimistic. Footnote ‘@’ given in Table 1 is applicable here. |
| Table 8: Assessment and Expectations for Imports | | (Percentage responses) | | Quarter | Total response | Assessment | Expectations | | Increase | Decrease | No change | Net response | Increase | Decrease | No change | Net response | | Q4:2018-19 | 1,258 | 19.7 | 8.7 | 71.6 | 10.9 | 21.0 | 5.3 | 73.7 | 15.7 | | Q1:2019-20 | 1,231 | 18.2 | 8.3 | 73.4 | 9.9 | 19.2 | 6.2 | 74.6 | 13.0 | | Q2:2019-20 | 481 | 16.0 | 14.5 | 69.6 | 1.5 | 18.4 | 7.4 | 74.2 | 11.1 | | Q3:2019-20 | 775 | 13.2 | 12.3 | 74.5 | 0.9 | 18.1 | 11.7 | 70.2 | 6.4 | | Q4:2019-20 | 860 | 16.0 | 11.3 | 72.7 | 4.7 | 15.7 | 10.2 | 74.1 | 5.4 | | Q1:2020-21 | | | | | | 16.9 | 10.3 | 72.8 | 6.6 | | ‘Increase’ in imports is optimistic. Footnote ‘@’ given in Table 1 is applicable here. |
| Table 9: Assessment and Expectations for level of Raw Materials Inventory | | (Percentage responses) | | Quarter | Total response | Assessment | Expectations | | Above average | Below average | Average | Net response | Above average | Below average | Average | Net response | | Q4:2018-19 | 1,258 | 14.9 | 5.5 | 79.6 | -9.5 | 12.1 | 4.2 | 83.8 | -7.9 | | Q1:2019-20 | 1,231 | 13.9 | 5.7 | 80.4 | -8.3 | 12.0 | 3.7 | 84.3 | -8.3 | | Q2:2019-20 | 481 | 17.1 | 8.4 | 74.5 | -8.6 | 11.8 | 4.2 | 84.0 | -7.7 | | Q3:2019-20 | 775 | 13.9 | 7.7 | 78.4 | -6.2 | 13.2 | 6.6 | 80.3 | -6.6 | | Q4:2019-20 | 860 | 12.9 | 7.8 | 79.3 | -5.1 | 10.6 | 7.0 | 82.4 | -3.6 | | Q1:2020-21 | | | | | | 9.8 | 6.9 | 83.3 | -2.9 | | ‘Below average’ Inventory of raw materials is optimistic. Footnote ‘@’ given in Table 1 is applicable here. |
| Table 10: Assessment and Expectations for level of Finished Goods Inventory | | (Percentage responses) | | Quarter | Total response | Assessment | Expectations | | Above average | Below average | Average | Net response | Above average | Below average | Average | Net response | | Q4:2018-19 | 1,258 | 14.4 | 6.5 | 79.1 | -7.9 | 11.1 | 4.6 | 84.3 | -6.5 | | Q1:2019-20 | 1,231 | 13.5 | 6.7 | 79.8 | -6.8 | 10.5 | 4.9 | 84.6 | -5.6 | | Q2:2019-20 | 481 | 22.5 | 8.0 | 69.5 | -14.5 | 13.0 | 6.0 | 81.0 | -7.0 | | Q3:2019-20 | 775 | 18.3 | 7.3 | 74.4 | -11.0 | 15.7 | 5.0 | 79.3 | -10.7 | | Q4:2019-20 | 860 | 13.3 | 6.7 | 80.0 | -6.5 | 12.9 | 6.2 | 80.9 | -6.7 | | Q1:2020-21 | | | | | | 10.4 | 6.2 | 83.4 | -4.3 | | ‘Below average’ Inventory of finished goods is optimistic. Footnote ‘@’ given in Table 1 is applicable here. |
| Table 11: Assessment and Expectations for Employment Outlook | | (Percentage responses) | | Quarter | Total response | Assessment | Expectations | | Increase | Decrease | No change | Net response | Increase | Decrease | No change | Net response | | Q4:2018-19 | 1,258 | 16.7 | 6.9 | 76.5 | 9.8 | 17.0 | 4.8 | 78.2 | 12.2 | | Q1:2019-20 | 1,231 | 15.9 | 7.3 | 76.8 | 8.6 | 17.1 | 4.8 | 78.1 | 12.3 | | Q2:2019-20 | 481 | 13.4 | 14.2 | 72.4 | -0.9 | 16.6 | 5.7 | 77.7 | 10.9 | | Q3:2019-20 | 775 | 12.2 | 13.8 | 74.0 | -1.6 | 12.1 | 11.4 | 76.5 | 0.7 | | Q4:2019-20 | 860 | 13.4 | 11.3 | 75.3 | 2.0 | 12.5 | 10.7 | 76.8 | 1.8 | | Q1:2020-21 | | | | | | 14.3 | 9.0 | 76.7 | 5.2 | | ‘Increase’ in employment is optimistic. Footnote ‘@’ given in Table 1 is applicable here. |
| Table 12: Assessment and Expectations for Overall Financial Situation | | (Percentage responses) | | Quarter | Total response | Assessment | Expectations | | Better | Worsen | No change | Net response | Better | Worsen | No change | Net response | | Q4:2018-19 | 1,258 | 29.3 | 11.4 | 59.3 | 17.8 | 35.2 | 6.5 | 58.3 | 28.7 | | Q1:2019-20 | 1,231 | 29.7 | 8.6 | 61.7 | 21.1 | 35.0 | 5.7 | 59.3 | 29.3 | | Q2:2019-20 | 481 | 21.2 | 22.2 | 56.6 | -1.1 | 34.3 | 6.1 | 59.6 | 28.3 | | Q3:2019-20 | 775 | 24.6 | 19.3 | 56.1 | 5.3 | 30.6 | 14.8 | 54.7 | 15.8 | | Q4:2019-20 | 860 | 26.5 | 13.6 | 59.9 | 12.8 | 31.2 | 11.7 | 57.1 | 19.5 | | Q1:2020-21 | | | | | | 33.1 | 8.8 | 58.0 | 24.3 | | ‘Better’ overall financial situation is optimistic. Footnote ‘@’ given in Table 1 is applicable here. |
| Table 13: Assessment and Expectations for Working Capital Finance Requirement | | (Percentage responses) | | Quarter | Total response | Assessment | Expectations | | Increase | Decrease | No change | Net response | Increase | Decrease | No change | Net response | | Q4:2018-19 | 1,258 | 30.8 | 4.6 | 64.6 | 26.2 | 29.9 | 4.4 | 65.7 | 25.6 | | Q1:2019-20 | 1,231 | 28.5 | 5.4 | 66.1 | 23.2 | 29.6 | 4.1 | 66.3 | 25.6 | | Q2:2019-20 | 481 | 28.4 | 10.7 | 60.9 | 17.7 | 27.7 | 5.5 | 66.8 | 22.1 | | Q3:2019-20 | 775 | 27.4 | 8.7 | 63.9 | 18.7 | 29.3 | 5.5 | 65.3 | 23.8 | | Q4:2019-20 | 860 | 28.3 | 6.4 | 65.4 | 21.9 | 27.3 | 5.7 | 66.9 | 21.6 | | Q1:2020-21 | | | | | | 28.8 | 5.7 | 65.5 | 23.1 | | ‘Increase’ in working capital finance is optimistic. Footnote ‘@’ given in Table 1 is applicable here. |
| Table 14: Assessment and Expectations for Availability of Finance (from Internal Accruals) | | (Percentage responses) | | Quarter | Total response | Assessment | Expectations | | Improve | Worsen | No change | Net response | Improve | Worsen | No change | Net response | | Q4:2018-19 | 1,258 | 22.8 | 7.5 | 69.6 | 15.3 | 25.4 | 6.2 | 68.4 | 19.2 | | Q1:2019-20 | 1,231 | 23.2 | 7.2 | 69.6 | 16.0 | 25.5 | 5.0 | 69.5 | 20.5 | | Q2:2019-20 | 481 | 19.6 | 12.7 | 67.7 | 6.9 | 23.0 | 5.7 | 71.3 | 17.3 | | Q3:2019-20 | 775 | 19.0 | 12.4 | 68.6 | 6.6 | 21.4 | 8.1 | 70.5 | 13.2 | | Q4:2019-20 | 860 | 23.1 | 9.5 | 67.4 | 13.7 | 22.1 | 8.8 | 69.1 | 13.4 | | Q1:2020-21 | | | | | | 23.1 | 6.0 | 70.9 | 17.0 | | ‘Improvement’ in availability of finance is optimistic. Footnote ‘@’ given in Table 1 is applicable here. |
| Table 15: Assessment and Expectations for Availability of Finance (from banks and other sources) | | (Percentage responses) | | Quarter | Total response | Assessment | Expectations | | Improve | Worsen | No change | Net response | Improve | Worsen | No change | Net response | | Q4:2018-19 | 1,258 | 17.8 | 7.0 | 75.2 | 10.8 | 20.1 | 4.1 | 75.8 | 16.0 | | Q1:2019-20 | 1,231 | 17.9 | 6.0 | 76.1 | 11.9 | 19.3 | 5.0 | 75.7 | 14.2 | | Q2:2019-20 | 481 | 14.3 | 10.0 | 75.8 | 4.3 | 17.4 | 4.4 | 78.2 | 13.0 | | Q3:2019-20 | 775 | 14.6 | 7.4 | 78.1 | 7.2 | 18.7 | 6.0 | 75.3 | 12.7 | | Q4:2019-20 | 860 | 16.9 | 6.1 | 76.9 | 10.8 | 17.7 | 5.9 | 76.4 | 11.7 | | Q1:2020-21 | | | | | | 18.1 | 6.4 | 75.4 | 11.7 | | ‘Improvement’ in availability of finance is optimistic. Footnote ‘@’ given in Table 1 is applicable here. |
| Table 16: Assessment and Expectations for Availability of Finance (from overseas, if applicable) | | (Percentage responses) | | Quarter | Total response | Assessment | Expectations | | Improve | Worsen | No change | Net response | Improve | Worsen | No change | Net response | | Q4:2018-19 | 1,258 | 8.6 | 3.9 | 87.6 | 4.7 | 9.0 | 3.0 | 88.0 | 6.0 | | Q1:2019-20 | 1,231 | 8.2 | 4.0 | 87.8 | 4.3 | 9.5 | 3.5 | 87.0 | 6.0 | | Q2:2019-20 | 481 | 6.9 | 4.1 | 89.1 | 2.8 | 13.1 | 3.5 | 83.5 | 9.6 | | Q3:2019-20 | 775 | 7.5 | 5.0 | 87.6 | 2.5 | 9.2 | 4.1 | 86.7 | 5.1 | | Q4:2019-20 | 860 | 7.2 | 4.4 | 88.4 | 2.8 | 7.3 | 4.3 | 88.4 | 3.0 | | Q1:2020-21 | | | | | | 7.9 | 4.0 | 88.1 | 4.0 | | ‘Improvement’ in availability of finance is optimistic. Footnote ‘@’ given in Table 1 is applicable here. |
| Table 17: Assessment and Expectations for Cost of Finance | | (Percentage responses) | | Quarter | Total response | Assessment | Expectations | | Increase | Decrease | No change | Net response | Increase | Decrease | No change | Net response | | Q4:2018-19 | 1,258 | 21.3 | 5.6 | 73.1 | -15.7 | 22.3 | 4.8 | 73.0 | -17.5 | | Q1:2019-20 | 1,231 | 22.4 | 4.9 | 72.7 | -17.6 | 20.2 | 5.8 | 74.0 | -14.4 | | Q2:2019-20 | 481 | 21.3 | 8.1 | 70.6 | -13.1 | 22.5 | 7.1 | 70.4 | -15.4 | | Q3:2019-20 | 775 | 16.9 | 8.2 | 74.9 | -8.7 | 18.5 | 8.4 | 73.1 | -10.0 | | Q4:2019-20 | 860 | 15.0 | 8.4 | 76.6 | -6.6 | 15.0 | 7.1 | 77.9 | -7.9 | | Q1:2020-21 | | | | | | 12.7 | 6.6 | 80.6 | -6.1 | | ‘Decrease’ in cost of finance is optimistic. Footnote ‘@’ given in Table 1 is applicable here. |
| Table 18: Assessment and Expectations for Cost of Raw Materials | | (Percentage responses) | | Quarter | Total response | Assessment | Expectations | | Increase | Decrease | No change | Net response | Increase | Decrease | No change | Net response | | Q4:2018-19 | 1,258 | 46.8 | 4.8 | 48.4 | -41.9 | 42.1 | 3.5 | 54.3 | -38.6 | | Q1:2019-20 | 1,231 | 46.4 | 3.1 | 50.5 | -43.3 | 37.2 | 3.5 | 59.2 | -33.7 | | Q2:2019-20 | 481 | 42.4 | 7.1 | 50.5 | -35.3 | 31.4 | 3.8 | 64.8 | -27.6 | | Q3:2019-20 | 775 | 37.2 | 11.1 | 51.7 | -26.1 | 37.0 | 6.2 | 56.8 | -30.8 | | Q4:2019-20 | 860 | 41.1 | 7.1 | 51.8 | -34.1 | 35.6 | 5.6 | 58.8 | -30.0 | | Q1:2020-21 | | | | | | 38.9 | 5.3 | 55.7 | -33.6 | | ‘Decrease’ in cost of raw materials is optimistic. Footnote ‘@’ given in Table 1 is applicable here. |
| Table 19: Assessment and Expectations for Salary/Other Remuneration | | (Percentage responses) | | Quarter | Total response | Assessment | Expectations | | Increase | Decrease | No change | Net response | Increase | Decrease | No change | Net response | | Q4:2018-19 | 1,258 | 28.5 | 1.8 | 69.7 | -26.7 | 22.8 | 1.4 | 75.8 | -21.4 | | Q1:2019-20 | 1,231 | 38.8 | 1.6 | 59.6 | -37.2 | 34.0 | 1.1 | 64.9 | -32.9 | | Q2:2019-20 | 481 | 38.6 | 2.6 | 58.8 | -36.0 | 34.5 | 0.9 | 64.6 | -33.7 | | Q3:2019-20 | 775 | 30.6 | 3.6 | 65.8 | -27.0 | 25.0 | 1.8 | 73.2 | -23.2 | | Q4:2019-20 | 860 | 27.1 | 2.3 | 70.6 | -24.8 | 25.1 | 3.0 | 71.9 | -22.1 | | Q1:2020-21 | | | | | | 35.8 | 2.7 | 61.5 | -33.1 | | ‘Decrease’ in Salary / other remuneration is optimistic. Footnote ‘@’ given in Table 1 is applicable here. |
| Table 20: Assessment and Expectations for Selling Price | | (Percentage responses) | | Quarter | Total response | Assessment | Expectations | | Increase | Decrease | No change | Net response | Increase | Decrease | No change | Net response | | Q4:2018-19 | 1,258 | 17.5 | 13.1 | 69.3 | 4.4 | 19.4 | 7.1 | 73.5 | 12.3 | | Q1:2019-20 | 1,231 | 17.1 | 10.5 | 72.4 | 6.6 | 19.5 | 8.5 | 72.0 | 11.0 | | Q2:2019-20 | 481 | 13.8 | 21.4 | 64.8 | -7.6 | 15.5 | 8.4 | 76.1 | 7.1 | | Q3:2019-20 | 775 | 12.0 | 21.6 | 66.4 | -9.6 | 18.6 | 14.0 | 67.3 | 4.6 | | Q4:2019-20 | 860 | 16.4 | 13.9 | 69.7 | 2.5 | 15.2 | 13.0 | 71.9 | 2.2 | | Q1:2020-21 | | | | | | 18.0 | 9.7 | 72.3 | 8.3 | | ‘Increase’ in selling price is optimistic. Footnote ‘@’ given in Table 1 is applicable here. |
| Table 21: Assessment and Expectations for Profit Margin | | (Percentage responses) | | Quarter | Total response | Assessment | Expectations | | Increase | Decrease | No change | Net response | Increase | Decrease | No change | Net response | | Q4:2018-19 | 1,258 | 16.2 | 25.5 | 58.3 | -9.3 | 18.7 | 16.7 | 64.5 | 2.0 | | Q1:2019-20 | 1,231 | 16.1 | 24.1 | 59.8 | -8.0 | 17.8 | 17.0 | 65.1 | 0.8 | | Q2:2019-20 | 481 | 13.5 | 36.1 | 50.4 | -22.6 | 21.9 | 14.5 | 63.6 | 7.4 | | Q3:2019-20 | 775 | 12.3 | 34.4 | 53.3 | -22.1 | 17.6 | 26.1 | 56.3 | -8.5 | | Q4:2019-20 | 860 | 15.8 | 27.4 | 56.8 | -11.6 | 16.3 | 26.4 | 57.3 | -10.2 | | Q1:2020-21 | | | | | | 17.5 | 20.4 | 62.1 | -2.9 | | ‘Increase’ in profit margin is optimistic. Footnote ‘@’ given in Table 1 is applicable here. |
| Table 22: Assessment and Expectations for Overall Business Situation | | (Percentage responses) | | Quarter | Total response | Assessment | Expectations | | Better | Worsen | No change | Net response | Better | Worsen | No change | Net response | | Q4:2018-19 | 1,258 | 33.9 | 11.5 | 54.7 | 22.4 | 43.2 | 6.5 | 50.3 | 36.7 | | Q1:2019-20 | 1,231 | 35.1 | 10.5 | 54.4 | 24.6 | 42.5 | 5.6 | 51.9 | 36.9 | | Q2:2019-20 | 481 | 24.5 | 25.4 | 50.1 | -0.8 | 41.1 | 6.0 | 52.9 | 35.2 | | Q3:2019-20 | 775 | 26.4 | 22.9 | 50.8 | 3.5 | 37.3 | 15.6 | 47.1 | 21.7 | | Q4:2019-20 | 860 | 31.6 | 15.8 | 52.6 | 15.7 | 35.8 | 13.2 | 50.9 | 22.6 | | Q1:2020-21 | | | | | | 38.6 | 10.4 | 50.9 | 28.2 | | ‘Better’ Overall Business Situation is optimistic. Footnote ‘@’ given in Table 1 is applicable here. |
| Table 23: Business Sentiments | | Quarter | Business Assessment Index (BAI) | Business Expectations Index (BEI) | | Q4:2018-19 | 107.2 | 116.2 | | Q1:2019-20 | 108.4 | 113.5 | | Q2:2019-20 | 92.5 | 112.8 | | Q3:2019-20 | 93.0 | 102.2 | | Q4:2019-20 | 102.2 | 105.0 | | Q1:2020-21 | | 108.8 | Special Tables: Summary Results of Quick Survey (48 respondents) during March 18-20, 2020:
Assessment for Q4:2019-20 and Expectations for Q1:2020-21 | Table 24: Comparison of net responses based on quick survey with full survey results of previous round | | Parameters | Assessment period | Expectations period | | Q3:2019-20 | Q4:2019-20 | Q4:2019-20 | Q1:2020-21 | | Production | 0.4 | -45.8 | 17.2 | -37.5 | | Order Books | 0.3 | -46.5 | 16.6 | -41.9 | | Employment | -1.6 | -10.4 | 1.8 | -14.6 | | Capacity utilisation | -8.3 | -34.0 | 7.9 | -40.4 | | Overall Business Situation | 3.5 | -31.3 | 22.6 | -35.4 |
| Table 25: Comparison of net responses based on quick survey with responses from same cohort of respondents for round 89 | | Parameters | Assessment period | Expectations period | Q4:2019-20
(based on responses to the regular IOS round 89) | Q4:2019-20
(based on responses to quick repeat survey) | Q1:2020-21
(based on responses to the regular IOS round 89) | Q1:2020-21
(based on responses to quick repeat survey) | | Production | 2.2 | -45.8 | 13.0 | -37.5 | | Order Books | 9.5 | -46.5 | 16.3 | -41.9 | | Employment | 0.0 | -10.4 | 4.3 | -14.6 | | Capacity utilisation | 2.2 | -34.0 | 22.2 | -40.4 | | Overall Business Situation | 0.0 | -31.3 | 26.1 | -35.4 |
|
 IST,
IST,