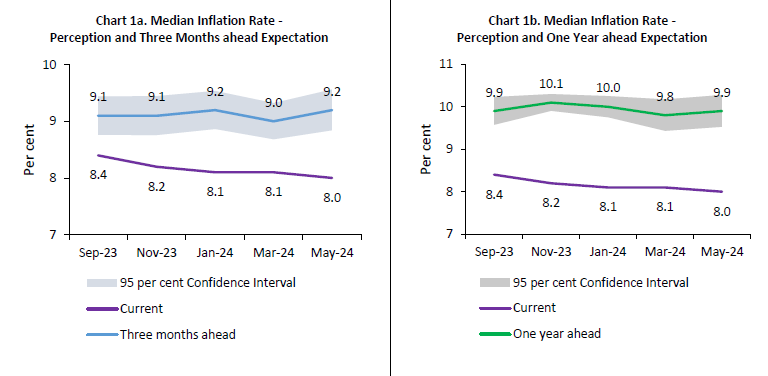
Today, the Reserve Bank released the results of May 2024 round of its bi-monthly inflation expectations survey of households (IESH)12. The survey was conducted during May 2-11, 2024 in 19 major cities, with responses from 5,943 urban households. Female respondents accounted for 52.6 per cent of this sample.
Highlights:
Households’ inflation expectations for the three months and one year ahead periods increased by 20 basis points (bps) and 10 bps, respectively, but remained in single digits; their perception on current inflation, however, moderated by 10 bps and stood at 8.0 per cent in the latest survey round [Charts 1a and 1b; Table 3].
Higher share of respondents expected prices and inflation to rise for all major product groups over the next three months as well as one-year periods [Tables 1(a) and 1(b)].
At the aggregate level, female respondents had marginally lower inflation assessment and expectations than their male counterparts [Table 2].
Among occupation categories, self-employed respondents group expected highest inflation [Table 2].
For one year horizon, households’ expectations on general prices remained closely aligned with their assessment related to food prices and housing [Table 4].
Table 1(a): Product-wise Expectations of Prices for Three Months ahead
(Percentage of Respondents)
Survey period ended
May-23
Nov-23
Jan-24
Mar-24
May-24
General
Estimate
SE
Estimate
SE
Estimate
SE
Estimate
SE
Estimate
SE
Prices will increase
81.2
0.82
74.1
0.93
78.2
0.84
76.5
0.85
80.6
0.81
Price increase more than current rate
59.7
1.08
50.8
1.13
54.4
1.09
53.1
1.08
59.1
1.13
Price increase similar to current rate
17.9
0.77
19.1
0.85
19.5
0.80
18.2
0.79
17.5
0.83
Price increase less than current rate
3.5
0.41
4.2
0.42
4.2
0.43
5.2
0.44
4.0
0.43
No changes in prices
15.7
0.77
21.2
0.88
18.3
0.79
19.6
0.80
16.6
0.77
Decline in prices
3.1
0.35
4.7
0.45
3.6
0.37
3.9
0.38
2.8
0.32
Food Product
Prices will increase
82.7
0.73
75.5
0.90
80.2
0.77
76.7
0.81
81.8
0.74
Price increase more than current rate
61.8
1.00
53.7
1.04
59.3
1.00
54.4
1.00
61.0
1.07
Price increase similar to current rate
16.2
0.71
16.1
0.74
15.6
0.72
15.7
0.69
15.3
0.74
Price increase less than current rate
4.7
0.42
5.8
0.47
5.4
0.45
6.6
0.50
5.5
0.46
No changes in prices
11.0
0.61
15.5
0.76
12.3
0.65
15.1
0.68
12.1
0.64
Decline in prices
6.3
0.48
9.0
0.57
7.5
0.51
8.2
0.54
6.1
0.46
Non- Food Product
Prices will increase
78.4
0.84
73.8
0.87
74.0
0.85
71.5
0.87
75.0
0.85
Price increase more than current rate
57.1
1.08
52.4
1.04
52.3
1.03
48.9
1.01
53.7
1.11
Price increase similar to current rate
16.6
0.70
16.1
0.72
16.4
0.71
16.2
0.71
15.6
0.72
Price increase less than current rate
4.6
0.43
5.3
0.46
5.2
0.45
6.4
0.48
5.7
0.50
No changes in prices
16.2
0.74
19.5
0.77
18.6
0.76
20.9
0.80
19.3
0.78
Decline in prices
5.4
0.45
6.7
0.48
7.4
0.52
7.7
0.51
5.7
0.43
Household Durables
Prices will increase
68.2
0.90
63.8
0.98
65.5
0.93
64.7
0.92
68.2
0.94
Price increase more than current rate
49.5
1.06
45.5
1.02
46.3
1.04
43.8
1.01
48.3
1.10
Price increase similar to current rate
14.8
0.67
13.4
0.68
14.5
0.65
15.5
0.70
15.2
0.74
Price increase less than current rate
3.9
0.38
4.9
0.43
4.7
0.42
5.4
0.44
4.7
0.44
No changes in prices
24.6
0.86
25.9
0.89
25.2
0.85
26.1
0.85
23.4
0.86
Decline in prices
7.2
0.51
10.3
0.59
9.4
0.57
9.2
0.57
8.5
0.53
Cost of Housing
Prices will increase
78.1
0.82
76.8
0.88
78.4
0.83
76.9
0.83
80.4
0.81
Price increase more than current rate
59.4
1.06
57.2
1.09
58.2
1.05
55.8
1.07
59.3
1.06
Price increase similar to current rate
15.1
0.74
15.5
0.72
16.1
0.72
16.4
0.74
16.7
0.77
Price increase less than current rate
3.7
0.35
4.1
0.37
4.0
0.41
4.7
0.40
4.3
0.44
No changes in prices
18.7
0.79
20.0
0.83
18.1
0.79
19.6
0.78
16.7
0.77
Decline in prices
3.2
0.36
3.2
0.36
3.6
0.34
3.5
0.36
3.0
0.34
Cost of Services
Prices will increase
70.6
0.89
63.3
0.96
65.0
0.93
65.0
0.97
68.6
0.98
Price increase more than current rate
51.3
1.00
43.7
1.09
46.1
1.02
45.5
1.09
49.2
1.12
Price increase similar to current rate
15.8
0.69
15.5
0.70
15.0
0.69
14.4
0.70
14.4
0.68
Price increase less than current rate
3.5
0.37
4.2
0.40
3.8
0.37
5.2
0.45
5.0
0.46
No changes in prices
26.2
0.87
31.5
0.93
30.5
0.91
30.1
0.92
27.3
0.94
Decline in prices
3.2
0.34
5.1
0.48
4.5
0.41
4.8
0.43
4.1
0.39
Note:
1. The table provides estimates and standard errors (SE) for qualitative responses.
2. Constituent items may not add up to the corresponding total, due to rounding off.
Table 1(b): Product-wise Expectations of Prices for One Year ahead
(Percentage of Respondents)
Survey period ended
May-23
Nov-23
Jan-24
Mar-24
May-24
General
Estimate
SE
Estimate
SE
Estimate
SE
Estimate
SE
Estimate
SE
Prices will increase
89.6
0.61
89.0
0.65
88.7
0.63
87.4
0.67
89.1
0.64
Price increase more than current rate
70.2
1.05
67.2
1.07
66.3
1.06
64.7
1.08
67.9
1.14
Price increase similar to current rate
16.7
0.77
18.4
0.87
19.1
0.83
18.5
0.83
17.8
0.90
Price increase less than current rate
2.7
0.32
3.4
0.38
3.3
0.36
4.2
0.41
3.5
0.41
No changes in prices
7.3
0.50
8.4
0.56
8.2
0.55
9.7
0.59
7.9
0.56
Decline in prices
3.1
0.35
2.7
0.35
3.0
0.36
2.9
0.35
3.0
0.34
Food Product
Prices will increase
86.9
0.66
86.1
0.71
86.4
0.68
84.5
0.73
86.0
0.68
Price increase more than current rate
64.6
0.99
63.2
1.06
63.6
1.03
59.5
1.10
62.8
1.10
Price increase similar to current rate
18.3
0.77
18.4
0.83
18.2
0.77
19.8
0.80
18.3
0.86
Price increase less than current rate
4.0
0.40
4.5
0.41
4.7
0.43
5.2
0.45
4.9
0.49
No changes in prices
8.0
0.51
8.8
0.56
8.7
0.53
10.1
0.61
9.3
0.58
Decline in prices
5.2
0.44
5.1
0.44
4.9
0.43
5.4
0.44
4.7
0.39
Non- Food Product
Prices will increase
84.1
0.72
82.6
0.78
82.0
0.80
81.1
0.76
82.1
0.79
Price increase more than current rate
62.0
1.05
60.7
1.09
59.1
1.11
56.3
1.09
59.8
1.13
Price increase similar to current rate
17.9
0.77
17.4
0.80
18.6
0.79
19.5
0.82
17.3
0.80
Price increase less than current rate
4.2
0.41
4.5
0.42
4.4
0.41
5.3
0.47
5.1
0.47
No changes in prices
11.1
0.61
12.9
0.65
13.1
0.66
14.1
0.69
12.9
0.68
Decline in prices
4.8
0.43
4.5
0.43
4.8
0.45
4.8
0.44
5.0
0.44
Household Durables
Prices will increase
76.9
0.83
75.5
0.89
74.8
0.84
74.5
0.83
76.8
0.83
Price increase more than current rate
57.0
1.07
55.3
1.07
54.0
1.06
52.3
1.06
56.0
1.12
Price increase similar to current rate
16.1
0.72
16.3
0.77
16.7
0.69
17.3
0.76
16.4
0.79
Price increase less than current rate
3.7
0.37
3.9
0.39
4.1
0.41
5.0
0.45
4.4
0.44
No changes in prices
16.7
0.71
17.7
0.76
18.3
0.75
18.1
0.76
16.6
0.72
Decline in prices
6.4
0.48
6.8
0.50
6.9
0.49
7.4
0.51
6.6
0.47
Cost of Housing
Prices will increase
87.9
0.63
87.9
0.68
88.0
0.65
87.2
0.66
89.2
0.64
Price increase more than current rate
67.4
1.00
68.5
1.02
67.7
0.96
65.6
1.01
68.7
1.02
Price increase similar to current rate
17.1
0.76
16.3
0.78
16.7
0.74
17.2
0.74
16.3
0.75
Price increase less than current rate
3.4
0.34
3.1
0.36
3.6
0.40
4.4
0.39
4.2
0.45
No changes in prices
9.1
0.54
9.4
0.61
9.1
0.55
9.5
0.57
8.4
0.57
Decline in prices
3.0
0.34
2.7
0.34
2.9
0.34
3.3
0.36
2.4
0.31
Cost of Services
Prices will increase
83.2
0.72
80.8
0.81
79.5
0.78
80.1
0.78
82.1
0.77
Price increase more than current rate
61.1
1.05
59.2
1.08
58.8
1.03
56.3
1.08
58.9
1.13
Price increase similar to current rate
18.2
0.81
17.6
0.80
16.6
0.72
18.9
0.78
18.6
0.83
Price increase less than current rate
3.9
0.36
4.0
0.40
4.1
0.40
4.9
0.45
4.6
0.44
No changes in prices
13.7
0.64
16.3
0.74
17.0
0.72
16.0
0.71
14.7
0.71
Decline in prices
3.1
0.34
2.9
0.36
3.5
0.37
3.9
0.38
3.2
0.34
Note:
1. The table provides estimates and standard errors (SE) for qualitative responses.
2. Constituent items may not add up to the corresponding total, due to rounding off.
Table 2: Inflation Expectations of Various Groups: May-24
Current Perception
Three Months ahead Expectation
One Year ahead Expectation
Mean
Median
Mean
Median
Mean
Median
Estimate
SE
Estimate
SE
Estimate
SE
Estimate
SE
Estimate
SE
Estimate
SE
Overall
8.7
0.10
8.0
0.13
9.8
0.10
9.2
0.19
9.6
0.12
9.9
0.19
Gender-wise
Male
8.9
0.13
8.3
0.19
9.9
0.13
9.5
0.27
9.7
0.16
10.0
0.23
Female
8.6
0.12
8.0
0.16
9.7
0.13
9.1
0.20
9.6
0.15
9.8
0.23
Category-wise
Financial Sector Employees
8.8
0.52
8.2
0.40
9.8
0.51
9.3
0.57
9.5
0.62
9.5
0.53
Other Employees
8.7
0.19
8.0
0.27
9.7
0.20
9.1
0.30
9.8
0.23
9.8
0.32
Self Employed
9.2
0.20
8.6
0.35
10.2
0.22
9.9
0.31
9.7
0.26
10.0
0.30
Homemaker
8.5
0.14
7.9
0.20
9.6
0.15
8.9
0.21
9.6
0.18
9.8
0.25
Retired Persons
9.2
0.36
8.7
0.67
10.4
0.37
9.7
0.75
9.9
0.44
9.9
0.74
Daily Workers
8.5
0.24
8.0
0.33
9.5
0.25
9.1
0.47
8.7
0.32
8.7
0.44
Other category
8.2
0.20
7.3
0.25
9.4
0.22
8.8
0.33
9.7
0.26
9.6
0.42
Age Group-wise
Up to 25 years
8.1
0.18
7.3
0.23
9.3
0.20
8.6
0.26
9.6
0.22
9.4
0.35
25 to 30 years
8.6
0.18
7.8
0.25
9.7
0.19
9.2
0.30
9.8
0.21
10.0
0.26
30 to 35 years
8.8
0.20
8.0
0.24
9.7
0.21
9.0
0.32
9.6
0.25
9.7
0.44
35 to 40 years
8.7
0.19
8.0
0.25
9.7
0.20
9.1
0.36
9.5
0.24
9.5
0.38
40 to 45 years
8.8
0.22
8.1
0.27
9.8
0.23
9.0
0.33
9.4
0.27
9.4
0.41
45 to 50 years
8.7
0.22
8.3
0.30
9.8
0.23
9.7
0.42
9.5
0.28
10.0
0.33
50 to 55 years
9.3
0.25
9.2
0.44
10.5
0.28
10.3
0.22
10.0
0.33
10.4
0.22
55 to 60 years
9.1
0.30
8.5
0.31
10.0
0.32
9.0
0.52
9.6
0.38
9.8
0.49
60 years and above
9.2
0.27
9.2
0.65
10.3
0.28
9.9
0.49
9.9
0.34
10.0
0.50
City-wise
Ahmedabad
7.4
0.44
6.3
0.39
8.8
0.55
7.6
0.61
8.2
0.65
7.4
0.54
Bengaluru
7.1
0.27
5.8
0.17
8.4
0.27
7.5
0.28
8.9
0.30
8.5
0.39
Bhopal
8.5
0.45
7.6
0.99
10.1
0.47
10.3
0.49
9.0
0.68
9.7
0.93
Bhubaneswar
8.6
0.48
7.8
1.02
10.3
0.52
10.0
1.11
10.5
0.61
10.5
1.11
Chennai
10.1
0.53
10.1
0.54
11.4
0.56
11.2
0.87
11.7
0.52
12.7
1.59
Delhi
8.9
0.23
8.6
0.47
10.0
0.26
9.7
0.41
10.0
0.30
10.1
0.39
Guwahati
8.0
0.44
7.5
0.77
8.7
0.57
8.1
0.85
9.6
0.95
9.5
1.02
Hyderabad
7.7
0.32
6.9
0.41
8.6
0.28
8.1
0.32
8.8
0.35
9.0
0.40
Jaipur
7.5
0.28
7.2
0.40
8.3
0.34
7.7
0.43
7.4
0.63
7.4
0.53
Jammu
10.2
0.65
9.4
0.97
12.4
0.84
12.8
1.30
12.5
0.75
12.9
1.26
Kolkata
10.6
0.29
10.3
0.16
11.7
0.28
11.2
0.58
11.6
0.30
11.8
0.77
Lucknow
9.2
0.60
8.6
0.90
9.6
0.50
9.3
0.79
9.7
0.51
9.6
0.65
Mumbai
8.9
0.24
8.2
0.23
9.9
0.25
9.3
0.35
9.2
0.29
9.8
0.37
Nagpur
8.4
0.48
8.0
0.71
9.7
0.46
9.3
0.75
9.1
0.69
10.1
0.62
Patna
7.4
0.38
7.2
0.46
8.0
0.53
7.5
0.52
7.6
0.43
7.6
0.58
Thiruvananthapuram
8.0
0.58
6.3
0.67
9.3
0.53
8.0
0.49
10.7
0.55
10.3
0.44
Chandigarh
10.8
0.71
10.0
0.62
10.9
0.78
10.4
0.65
10.7
0.78
10.4
0.98
Ranchi
8.5
0.35
7.9
0.29
8.8
0.35
8.1
0.45
7.8
0.59
8.3
0.77
Raipur
10.1
0.61
9.7
0.62
10.6
0.66
9.9
0.89
9.4
0.93
10.6
0.89
Note: The table provides estimates and standard errors (SE) for quantitative responses.
Table 3: Household Inflation Expectations – Current Perception, Three Months and One Year Ahead Expectations
Current Perception
Three Months ahead Expectation
One Year ahead Expectation
Mean
Median
Mean
Median
Mean
Median
Estimate
SE
Estimate
SE
Estimate
SE
Estimate
SE
Estimate
SE
Estimate
SE
May-23
9.3
0.09
8.8
0.13
10.3
0.10
10.1
0.08
10.2
0.11
10.4
0.08
Nov-23
8.9
0.09
8.2
0.12
9.7
0.09
9.1
0.18
9.6
0.10
10.1
0.10
Jan-24
8.8
0.09
8.1
0.12
9.7
0.09
9.2
0.17
9.6
0.10
10.0
0.13
Mar-24
8.7
0.09
8.1
0.13
9.6
0.09
9.0
0.16
9.5
0.10
9.8
0.19
May-24
8.7
0.10
8.0
0.13
9.8
0.10
9.2
0.19
9.6
0.12
9.9
0.19
Note: The table provides estimates and standard errors (SE) for quantitative responses.
Table 4: Households Expecting General Price Movements in Coherence with Movements in Price Expectations of Various Product Groups: Three Months Ahead and One Year Ahead
(Percentage of Respondents)
Survey period ended
Food
Non-Food
Households durables
Housing
Cost of services
Three Months Ahead
May-23
67.4
68.6
63.4
67.1
69.1
Nov-23
66.5
61.8
57.0
60.7
66.4
Jan-24
65.2
65.4
60.8
64.2
65.8
Mar-24
65.4
66.1
61.2
64.6
66.8
May-24
67.4
67.2
63.2
67.2
68.0
One Year Ahead
May-23
75.6
75.3
70.7
76.1
76.4
Nov-23
74.8
73.9
68.1
75.3
73.9
Jan-24
76.5
74.1
67.9
74.9
74.6
Mar-24
74.6
73.6
68.3
75.0
74.2
May-24
76.1
74.5
69.5
76.8
75.0
Table 5(a): Cross-tabulation of Number of Respondents by Current Inflation Perception and Three Months Ahead Inflation Expectations: May-24
Three Months Ahead Inflation Rate (per cent)
Current Inflation Rate (per cent)
<1
1-<2
2-<3
3-<4
4-<5
5-<6
6-<7
7-<8
8-<9
9-<10
10-<11
11-<12
12-<13
13-<14
14-<15
15-<16
>=16
No idea
Total
<1
7
2
0
1
0
0
0
0
0
0
1
0
0
0
0
0
0
0
11
1-<2
0
23
14
3
1
2
0
0
0
0
1
0
0
0
0
0
0
0
44
2-<3
1
13
100
68
41
10
1
1
0
2
1
0
0
1
0
0
0
0
239
3-<4
0
2
10
92
82
49
13
1
0
1
1
0
0
2
6
0
0
0
259
4-<5
0
0
10
15
119
94
49
9
9
3
4
0
1
5
6
0
0
0
324
5-<6
1
4
9
30
23
412
205
225
100
9
79
6
0
9
7
11
0
0
1130
6-<7
0
0
1
4
7
10
196
106
78
17
12
9
1
0
5
3
9
0
458
7-<8
0
1
0
1
2
14
14
194
123
60
59
2
9
6
4
0
1
0
490
8-<9
0
0
0
2
2
9
12
7
190
121
109
15
24
8
6
4
2
0
511
9-<10
0
0
0
1
2
4
3
5
3
96
89
36
24
9
17
5
3
0
297
10-<11
0
1
2
2
3
25
3
10
12
9
352
78
166
48
16
230
77
0
1034
11-<12
0
0
0
0
0
0
0
0
0
1
1
8
29
4
6
10
0
0
59
12-<13
0
0
0
2
2
4
0
1
3
1
3
0
35
15
32
34
9
0
141
13-<14
0
0
0
0
0
0
0
0
0
0
0
0
1
14
3
9
2
0
29
14-<15
0
0
1
0
0
0
0
0
0
0
1
0
0
0
9
4
6
0
21
15-<16
0
0
0
0
0
1
0
0
1
0
8
0
0
0
3
89
119
1
222
>=16
0
0
0
2
0
3
1
1
0
0
16
0
0
1
0
11
637
2
674
Total
9
46
147
223
284
637
497
560
519
320
737
154
290
122
120
410
865
3
5943
Table 5(b): Cross-tabulation of Number of Respondents by Current Inflation Perception and One Year Ahead Inflation Expectations: May-24
One Year Ahead Inflation Rate (per cent)
Current Inflation Rate (per cent)
<1
1-<2
2-<3
3-<4
4-<5
5-<6
6-<7
7-<8
8-<9
9-<10
10-<11
11-<12
12-<13
13-<14
14-<15
15-<16
>=16
No idea
Total
<1
5
1
1
1
0
1
0
0
0
0
2
0
0
0
0
0
0
0
11
1-<2
10
9
6
9
4
4
0
0
0
0
2
0
0
0
0
0
0
0
44
2-<3
38
3
41
59
51
27
5
5
3
2
0
1
1
1
1
0
1
0
239
3-<4
28
1
7
34
75
57
24
9
4
4
7
1
0
2
6
0
0
0
259
4-<5
47
0
1
7
71
70
47
22
23
6
14
9
2
3
2
0
0
0
324
5-<6
144
0
1
13
12
184
135
223
127
40
196
8
7
7
11
13
9
0
1130
6-<7
45
0
1
2
8
5
89
96
86
30
48
12
11
5
3
7
10
0
458
7-<8
55
0
0
1
0
4
7
101
104
64
91
15
22
8
7
10
1
0
490
8-<9
52
0
0
0
0
5
5
3
98
76
153
22
46
13
11
19
8
0
511
9-<10
21
0
0
0
0
0
0
2
2
63
69
52
45
11
9
14
9
0
297
10-<11
97
0
0
2
2
8
3
2
13
6
196
38
141
38
24
267
197
0
1034
11-<12
2
0
0
0
0
0
0
0
0
0
0
6
3
28
2
18
0
0
59
12-<13
9
0
0
1
1
1
0
0
3
0
7
0
16
8
22
49
24
0
141
13-<14
0
0
0
0
0
0
0
0
0
0
0
0
0
15
3
9
2
0
29
14-<15
1
0
0
0
0
0
0
0
0
0
0
0
0
0
9
4
7
0
21
15-<16
22
0
0
0
0
1
0
0
2
0
2
0
0
0
1
51
143
0
222
>=16
74
0
0
0
0
3
0
0
1
0
6
0
0
0
0
12
578
0
674
Total
650
14
58
129
224
370
315
463
466
291
793
164
294
139
111
473
989
0
5943
1 The survey is conducted at bi-monthly intervals by the Reserve Bank; it provides directional information on near-term inflationary pressures as expected by respondents and may reflect their own consumption patterns. Hence, survey results reflect respondents’ views, which are not necessarily shared by the Reserve Bank.
2 All estimates of inflation expectations are given in terms of median, unless stated otherwise.
3 Results of the previous survey round were released on the Bank’s website on April 05, 2024. Unit-level data for previous rounds of the survey are available on the Bank’s ‘Database on Indian Economy’ (DBIE) portal (weblink: https://dbie.rbi.org.in/#/dbie/home) under the head ‘Unit-level Data’.
RbiTtsCommonUtility
PLAYING
LISTEN
LOADING...
0:062:49
Related Assets
RBI-Install-RBI-Content-Global
RbiSocialMediaUtility
Share this page:
Install the RBI mobile application and get quick access to the latest news!
RbiWasItHelpfulUtility
Was this page helpful?Thanks!
Would like to give more details?
Thank you for your feedback!Thank you for your feedback!