I.1 The Indian economy registered strong growth during the second quarter of 2008-09. In the subsequent period, some moderation has since been evident in the wake of the global economic slowdown. According to the estimates released by the Central Statistical Organisation (CSO) in November 2008, real GDP growth during the second quarter of 2008-09 was lower at 7.6 per cent as compared with 9.3 per cent in the corresponding period of 2007-08 reflecting deceleration in growth of industry and services (Table 1). While the moderation in industrial growth was largely an outcome of some cyclical downturn, the services sector mainly reflected weakness in demand both at home and abroad, compounded by transmission of global factors through both the trade and financial channels. Structural drivers of the Indian growth process, however, remained strong as reflected in the acceleration in the real investment rate during the second quarter of 2008-09 supported by strong domestic saving.
Table 1: Growth Rates of Real GDP@ |
(Per cent) |
Sector |
2006-07* |
2007-08# |
2007-08 |
2008-09 |
2007-08 |
2008-09 |
|
|
|
Q1 |
Q2 |
Q3 |
Q4 |
Q1 |
Q2 |
April-September |
1 |
2 |
3 |
4 |
5 |
6 |
7 |
8 |
9 |
10 |
11 |
1. Agriculture and Allied Activities |
3.8 |
4.5 |
4.4 |
4.7 |
6.0 |
2.9 |
3.0 |
2.7 |
4.5 |
2.9 |
|
(18.5) |
(17.8) |
|
|
|
|
|
|
|
|
2. Industry |
10.6 |
8.1 |
9.6 |
8.6 |
8.6 |
5.8 |
5.2 |
4.7 |
9.1 |
5.0 |
|
|
(19.5) |
(19.4) |
|
|
|
|
|
|
|
|
2.1 |
Mining and Quarrying |
5.7 |
4.7 |
1.7 |
5.5 |
5.7 |
5.9 |
4.8 |
3.9 |
3.5 |
4.4 |
2.2 |
Manufacturing |
12.0 |
8.8 |
10.9 |
9.2 |
9.6 |
5.8 |
5.6 |
5.0 |
10.1 |
5.3 |
2.3 |
Electricity, Gas & Water Supply |
6.0 |
6.3 |
7.9 |
6.9 |
4.8 |
5.6 |
2.6 |
3.6 |
7.4 |
3.1 |
3. Services |
11.2 |
10.7 |
10.6 |
10.7 |
10.0 |
11.4 |
10.2 |
9.6 |
10.6 |
9.9 |
|
|
(61.9) |
(62.9) |
|
|
|
|
|
|
|
|
3.1 |
Trade, Hotels, Restaurants, |
|
|
|
|
|
|
|
|
|
|
|
Transport, Storage and |
|
|
|
|
|
|
|
|
|
|
|
Communication |
11.8 |
12.0 |
13.1 |
11.0 |
11.5 |
12.4 |
11.2 |
10.8 |
12.1 |
11.0 |
3.2 |
Financing, Insurance, Real |
|
|
|
|
|
|
|
|
|
|
|
Estate and Business Services |
13.9 |
11.8 |
12.6 |
12.4 |
11.9 |
10.5 |
9.3 |
9.2 |
12.5 |
9.2 |
3.3 |
Community, Social and |
|
|
|
|
|
|
|
|
|
|
|
Personal services |
6.9 |
7.3 |
5.2 |
7.7 |
6.2 |
9.5 |
8.4 |
7.6 |
6.5 |
8.0 |
3.4 |
Construction |
12.0 |
9.8 |
7.7 |
11.8 |
7.1 |
12.6 |
11.4 |
9.7 |
9.7 |
10.5 |
4. Real GDP at Factor Cost |
9.6 |
9.0 |
9.2 |
9.3 |
8.8 |
8.8 |
7.9 |
7.6 |
9.3 |
7.8 |
|
(100) |
(100) |
|
|
|
|
|
|
|
|
Memo: |
(Amount in Rupees crore) |
a) |
Real GDP at Factor Cost |
28,64,310 |
31,22,862 |
|
|
|
|
|
|
|
|
|
(1999-2000) |
|
|
|
|
|
|
|
|
|
|
b) |
GDP at current market prices |
41,45,810 |
47,13,148 |
|
|
|
|
|
|
|
|
@ : At 1999-2000 Prices. * : Quick Estimates. # : Revised Estimates.
Note : Figures in parenthesis indicate shares in real GDP.
Source: Central Statistical Organisation. |
Agricultural Situation
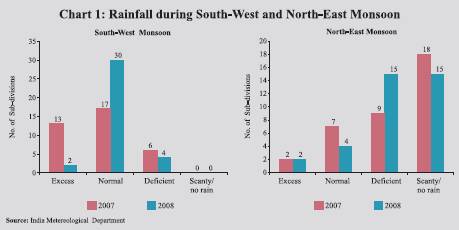
I.2 Cumulative rainfall during 2008 South West monsoon season (June 1 to September 30) was near normal, with rainfall over the entire country amounting to two per cent below normal as against five per cent above normal during the corresponding period of the previous year. Cumulative rainfall during the North-East monsoon season (October 1, 2008 to December 31, 2008) was, however, 31.0 per cent below normal as compared with 32.0 per cent below normal during the corresponding period of the previous year. Of the 36 meteorological sub-divisions, cumulative rainfall was deficient/scanty/ no rain in 30 sub-divisions (27 subdivisions last year) (Chart 1). As on January 15, 2009, the total live water storage was 49.0 per cent (56.0 per cent last year) of the Full Reservoir Level (FRL).
I.3 The sowing of kharif crops declined marginally during 2008-09 on account of moderate shortfall in rainfall during the South-West monsoon season (Table 2). On the other hand, area sown under rabi crops so far (up to January 9, 2009) has been about 4.8 per cent higher than a year ago. The increase in rabi sowing occurred in respect of all crops.
I.4 The Ministry of Agriculture has set a target for foodgrains production for 2008-09 at 233.0 million tonnes. According to the First Advance Estimates, kharif foodgrains production during 2008-09 at 115.3 million tonnes is likely to be lower than that of the previous year by around 5 per cent on account of fall in the production of both pulses and the coarse cereals (Table 3). However, rice production is expected to exhibit a marginal improvement over the previous year. Among the commercial crops, the output of kharif oilseeds, sugarcane and cotton is expected to decline.
Table 2: Progress of Area under |
Kharif and Rabi Crops – 2008-09 |
(Million hectares) |
Crop |
Normal Area |
Area Coverage |
|
|
2007 |
2008 |
Variation |
1 |
2 |
3 |
4 |
5 |
Kharif Crops |
Rice |
39.1 |
37.3 |
38.5 |
1.1 |
Coarse Cereals |
22.7 |
21.1 |
20.0 |
-1.2 |
of which: |
|
|
|
|
Bajra |
9.2 |
8.3 |
7.7 |
-0.6 |
Jowar |
4.2 |
3.5 |
3.0 |
-0.5 |
Maize |
6.4 |
7.4 |
7.1 |
-0.3 |
Total Pulses |
10.9 |
12.3 |
10.4 |
-1.9 |
Total Oilseeds |
15.9 |
17.5 |
18.3 |
0.8 |
of which: |
|
|
|
|
Groundnut |
5.4 |
5.4 |
5.3 |
-0.1 |
Soyabean |
7.3 |
8.7 |
9.6 |
0.9 |
Sugarcane |
4.1 |
5.3 |
4.4 |
-0.9 |
Cotton |
8.4 |
9.2 |
9.1 |
-0.1 |
All Crops |
101.9 |
103.9 |
101.5 |
-2.4 |
Crop |
Normal |
Area Coverage |
|
Area |
(as on January 9, 2009 |
|
|
2008 |
2009 |
Variation |
6 |
7 |
8 |
9 |
10 |
Rabi Crops |
Rice |
3.7 |
0.6 |
0.6 |
0.0 |
Wheat |
26.5 |
26.6 |
27.0 |
0.1 |
Coarse Cereals |
6.4 |
6.0 |
6.6 |
0.6 |
of which: |
|
|
|
|
Jowar |
4.9 |
4.4 |
4.8 |
0.5 |
Maize |
0.8 |
0.9 |
0.9 |
0.0 |
Total Pulses |
11.6 |
12.6 |
13.4 |
0.8 |
Total Oilseeds |
9.2 |
8.2 |
9.0 |
0.9 |
of which: |
|
|
|
|
Groundnut |
0.8 |
0.5 |
0.5 |
0.0 |
Rapeseed/ |
|
|
|
|
Mustard |
6.3 |
5.8 |
6.6 |
0.8 |
Sunflower |
1.3 |
0.9 |
1.0 |
0.1 |
All Crops |
57.4 |
53.9 |
56.5 |
2.6 |
Source: Ministry of Agriculture, Government of India. |
Food Management
I.5 The procurement of foodgrains (rice and wheat) during 2008-09 (up to January 19, 2009) was higher than that in the corresponding period of the previous year largely due to more than two-fold increase in wheat procurement (Table 4). The offtake of foodgrains (rice and wheat) during 2008-09 so far (up to October 31, 2008) was marginally lower as compared to corresponding period of the previous year. Consequently, the total stocks of foodgrains with the Food Corporation of India (FCI) and other government agencies nearly doubled to about 35.3 million tonnes as on November 1, 2008. The stocks of both rice and wheat are now higher than their norms.
Table 3: Agricultural Production |
(Million tonnes) |
Crop |
2007-08@ |
2008-09@@ |
|
|
Target |
Achievement |
1 |
2 |
3 |
4 |
Rice |
96.4 |
97.0 |
|
|
Kharif |
82.8 |
83.0 |
83.3 |
|
Rabi |
13.6 |
14.0 |
|
Wheat |
78.4 |
78.5 |
|
Coarse Cereals |
40.7 |
42.0 |
|
|
Kharif |
31.7 |
32.6 |
27.4 |
|
Rabi |
9.0 |
9.4 |
|
Pulses |
15.1 |
15.5 |
|
|
Kharif |
6.5 |
5.9 |
4.7 |
|
Rabi |
8.7 |
9.6 |
|
Total Foodgrains |
230.7 |
233.0 |
|
|
Kharif |
121.0 |
121.5 |
115.3 |
|
Rabi |
109.7 |
111.5 |
|
Total Oilseeds |
28.8 |
31.8 |
|
|
Kharif |
19.8 |
20.0 |
17.9 |
|
Rabi |
9.0 |
11.8 |
|
Sugarcane |
340.7 |
340.0 |
294.7 |
Cotton # |
26.0 |
26.0 |
23.9 |
Jute and Mesta ## |
11.2 |
11.0 |
11.1 |
@ : Fourth
Advance Estimates as on July 9, 2008.
@@ : First Advance Estimates for 2008-09.
# : Million bales of 170 kgs. each.
## : Million bales of 180 kgs. each.
Source : Ministry of Agriculture, Government of India. |
Table 4: Management of Food Stocks |
(Million tonnes) |
Month |
Opening Stock of Foodgrains |
Procurement of Foodgrains |
Foodgrains Offtake |
Closing Stock |
Norms |
|
Rice |
Wheat |
Total |
Rice |
Wheat |
Total |
PDS |
OWS |
OMS - Domestic |
Exports |
Total |
|
|
1 |
2 |
3 |
4 |
5 |
6 |
7 |
8 |
9 |
10 |
11 |
12 |
13 |
14 |
2007-08 |
13.2 |
4.7 |
17.9 |
26.3 |
11.1 |
37.4 |
33.5 |
3.9 |
0.0 |
0.0 |
37.4 |
19.8 |
|
2008-09@ |
13.8 |
5.8 |
19.8 |
25.0 |
22.6 |
47.6 |
19.4 |
1.7 |
0.0 |
0.0 |
21.1 |
.. |
|
|
(13.2) |
(4.7) |
(17.9) |
(20.7) |
(11.1) |
(31.8) |
(19.3) |
(2.1) |
(0.0) |
(0.0) |
(21.4) |
|
|
2007 |
|
|
|
|
|
|
|
|
|
|
|
|
|
April |
13.2 |
4.7 |
17.9 |
0.9 |
7.9 |
8.7 |
2.6 |
0.2 |
0.0 |
0.0 |
2.8 |
25.1 |
16.2 |
July |
11.0 |
12.9 |
23.9 |
0.8 |
0.0 |
0.8 |
2.9 |
0.4 |
0.0 |
0.0 |
3.2 |
21.2 |
26.9 |
October |
5.5 |
10.1 |
15.6 |
7.4 |
0.0 |
7.4 |
2.7 |
0.3 |
0.0 |
0.0 |
2.9 |
19.7 |
16.2 |
December |
10.1 |
8.4 |
18.5 |
3.5 |
0.0 |
3.5 |
2.7 |
0.3 |
0.0 |
0.0 |
3.0 |
19.2 |
|
2008 |
|
|
|
|
|
|
|
|
|
|
|
|
|
January |
11.5 |
7.7 |
19.2 |
4.5 |
0.0 |
4.5 |
2.9 |
0.3 |
0.0 |
0.0 |
3.2 |
21.4 |
20.0 |
April |
13.8 |
5.8 |
19.8 |
1.1 |
12.6 |
13.7 |
2.7 |
0.0 |
0.0 |
0.0 |
2.8 |
30.7 |
16.2 |
July |
11.3 |
24.9 |
36.3 |
0.1 |
0.2 |
0.3 |
2.8 |
0.3 |
0.0 |
0.0 |
3.1 |
34.3 |
26.9 |
September |
8.5 |
23.3 |
31.8 |
1.4 |
0.0 |
1.4 |
2.8 |
0.4 |
0.0 |
0.0 |
3.2 |
30.0 |
|
October |
7.9 |
22.0 |
30.0 |
8.1 |
0.0 |
8.1 |
2.6 |
0.1 |
0.0 |
0.0 |
2.8 |
35.3 |
16.2 |
November |
14.1 |
21.0 |
35.3 |
3.1 |
0.0 |
3.1 |
.. |
.. |
.. |
.. |
.. |
.. |
|
December |
.. |
.. |
.. |
4.2 |
0.0 |
4.2 |
.. |
.. |
.. |
.. |
.. |
.. |
|
2009 |
|
|
|
|
|
|
|
|
|
|
|
|
|
January* |
.. |
.. |
.. |
3.0 |
0.0 |
3.0 |
.. |
.. |
.. |
.. |
.. |
.. |
20.0 |
PDS: Public Distribution System. OWS: Other Welfare Schemes. OMS : Open Market Sales.
.. : Not Available.
@ : Procurement up to January 19, 2009 and offtake up to October 31, 2008.
* : Procurement up to January 19, 2009.
Note :
1. Closing stock figures may differ from those arrived at by adding the opening stocks and procurement and deducting offtake, as stocks include coarse grains also.
2. Figures in parentheses indicate procurement/offtake of foodgrains during the corresponding period of 2007-08.
3. Total minimum stocks are to be maintained, as on April 1, July 1, October 1, and January 1, by public agencies under the ‘new buffer stocking policy’ with effect from March 29, 2005.
Source : Ministry of Consumer Affairs, Food and Public Distribution, Government of India. |
Industrial Performance
I.6 Industrial activity decelerated during April-November 2008-09, with the year-on-year expansion in Index of Industrial Production (IIP) being 3.9 per cent as against 9.2 per cent during the corresponding period of the previous year reflecting slowdown in all the constituent sectors (Chart 2 and Table 5). The slowdown in manufacturing sector was largely on account of food, textiles and metals. Electricity sector recorded lower growth on account of decline in power generation in nuclear and hydro-plants. The mining sector growth also decelerated.
I.7 The slowdown in the growth of manufacturing was on account of 13 industry groups (with a combined weight of 67.5 per cent in the IIP), recording decelerated/negative growth during April-November 2008-09 (Table 6). In particular, while production declined in respect of ‘food products’, most of the textiles, leather and wood products, some industry groups such as textile products, chemical & chemical products, machinery & equipment and basic metal & alloy industries witnessed deceleration.
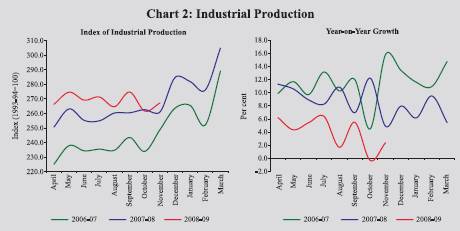
Table 5: Index of Industrial Production: Sectoral and |
Use-Based Classification of Industries |
(Per cent) |
Industry Group |
Weight in the |
Growth Rate |
Weighted Contribution # |
|
|
April-March |
April-November |
April-March |
April-November |
|
|
2007-08 |
2007-08 |
2008-09 P |
2007-08 |
2007-08 |
2008-09 P |
1 |
2 |
3 |
4 |
5 |
6 |
7 |
8 |
Sectoral |
|
|
|
|
|
|
|
Mining |
10.5 |
5.1 |
5.1 |
3.4 |
4.2 |
3.8 |
5.6 |
Manufacturing |
79.4 |
9.0 |
9.8 |
4.0 |
89.5 |
89.6 |
88.1 |
Electricity |
10.2 |
6.3 |
7.0 |
2.9 |
6.3 |
6.6 |
6.2 |
Use-Based |
|
|
|
|
|
|
|
Basic Goods |
35.6 |
7.0 |
8.4 |
3.5 |
24.7 |
27.7 |
27.1 |
Capital Goods |
9.3 |
18.0 |
20.9 |
7.5 |
25.0 |
25.6 |
24.0 |
Intermediate Goods |
26.5 |
8.9 |
9.8 |
0.1 |
27.4 |
28.5 |
0.7 |
Consumer Goods (a+b) |
28.7 |
6.1 |
5.3 |
6.0 |
22.9 |
18.5 |
46.5 |
a) Consumer Durables |
5.4 |
-1.0 |
-1.9 |
4.3 |
-1.0 |
-1.8 |
8.6 |
b) Consumer Non-durables |
23.3 |
8.5 |
8.1 |
6.4 |
24.0 |
20.3 |
37.8 |
|
|
|
|
|
|
|
|
General |
100.0 |
8.5 |
9.2 |
3.9 |
100.0 |
100.0 |
100.0 |
P : Provisional.
# : Figures may not add up to 100 due to rounding off.
Source: Central Statistical Organisation. |
Table 6: Growth of Manufacturing Groups |
(Per cent) |
Industry Group Weight |
Growth Rate |
Weighted Contribution # |
|
in the
IIP |
April-March
2007-08 |
April-November |
April-March |
April-November |
|
|
|
2007-08 |
2008-09 P |
2007-08 |
2007-08 |
2008-09 P |
1 |
2 |
3 |
4 |
5 |
6 |
7 |
8 |
1. |
Food products |
9.08 |
7.0 |
7.0 |
-0.4 |
6.3 |
4.5 |
-0.6 |
2. |
Beverages, tobacco and |
|
|
|
|
|
|
|
|
related products |
2.38 |
12.0 |
11.4 |
17.9 |
6.8 |
6.1 |
23.3 |
3. |
Cotton textiles |
5.52 |
4.3 |
5.1 |
-1.1 |
2.0 |
2.2 |
-1.1 |
4. |
Wool, silk and man-made fibre textiles |
2.26 |
4.8 |
3.9 |
-2.8 |
1.5 |
1.2 |
-2.0 |
5. |
Jute and other vegetable |
|
|
|
|
|
|
|
|
fibre textiles (except cotton) |
0.59 |
33.0 |
13.4 |
-3.9 |
0.9 |
0.4 |
-0.3 |
6. |
Textile products |
|
|
|
|
|
|
|
|
(including wearing apparel) |
2.54 |
3.7 |
4.3 |
3.9 |
1.4 |
1.6 |
3.2 |
7. |
Wood and wood products, |
|
|
|
|
|
|
|
|
furniture & fixtures |
2.70 |
40.5 |
72.5 |
-5.7 |
5.3 |
7.4 |
-2.2 |
8. |
Paper and paper products and printing, |
|
|
|
|
|
|
|
|
publishing and allied industries |
2.65 |
2.7 |
1.7 |
4.1 |
0.9 |
0.6 |
3.1 |
9. |
Leather and leather & fur products |
1.14 |
11.7 |
12.0 |
-5.7 |
1.1 |
1.0 |
-1.2 |
10. |
Chemicals and chemical products |
|
|
|
|
|
|
|
|
(except products of petroleum & coal) |
14.00 |
10.6 |
9.4 |
3.7 |
22.4 |
19.2 |
18.1 |
11. |
Rubber, plastic, petroleum and |
|
|
|
|
|
|
|
|
coal products |
5.73 |
8.9 |
10.6 |
1.3 |
6.1 |
6.8 |
2.0 |
12. |
Non-metallic mineral products |
4.40 |
5.7 |
8.2 |
0.2 |
4.1 |
5.4 |
0.3 |
13. |
Basic metal and alloy industries |
7.45 |
12.1 |
15.6 |
6.1 |
13.4 |
15.7 |
15.7 |
14. |
Metal products and parts |
|
|
|
|
|
|
|
|
(except machinery and equipment) |
2.81 |
-5.6 |
-4.6 |
0.5 |
-1.5 |
-1.1 |
0.3 |
15. |
Machinery and equipment other than |
|
|
|
|
|
|
|
|
transport equipment |
9.57 |
10.5 |
12.0 |
7.9 |
19.0 |
19.8 |
32.3 |
16. |
Transport equipment and parts |
3.98 |
2.9 |
2.7 |
6.7 |
2.3 |
2.0 |
11.1 |
17. |
Other manufacturing industries |
2.56 |
19.8 |
19.1 |
-2.1 |
8.0 |
7.2 |
-2.0 |
|
Manufacturing – Total |
79.36 |
8.6 |
9.8 |
4.0 |
100.0 |
100.0 |
100.0 |
P: Provisional. # : Figures may not add up to 100 due to rounding off.
Source : Central Statistical Organisation. |
I.8 In terms of use-based classification of the IIP, basic goods, capital goods and intermediate goods sectors recorded decelerated growth during April-November 2008-09 whereas the consumer goods sector recorded marginally higher growth. The performance of the basic goods sector reflected subdued growth in electricity sector and a fall in production of phosphatic fertilisers, steel and
aluminium products, and deceleration in production of caustic soda and structurals. The capital goods sector growth moderated on account of decline in production of H.T. insulators, agricultural implements, material handling equipment, machine tools, cutting tools, control panels, electric motors, computers & peripherals, commercial vehicles, and medical & surgical instruments. Production of consumer durables accelerated, while that of non-durables decelerated. The growth in intermediate goods sector contracted mainly because of decline in production of a number of textile’s items, PVC pipes & tubes, railway concrete sleepers, drums & barrels, spun pipes, yarns, hessian, sacking, particle board, corrugated boxes, filament yarn and viscose staple fibre.
Infrastructure
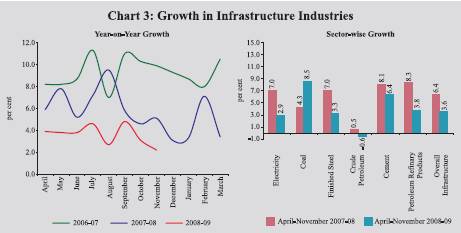
I.9 The core sector recorded a lower growth at 3.6 per cent during April- November 2008-09 as compared with 6.4 per cent during the corresponding period of the previous year (Chart 3). The sharp deceleration in electricity sector and decline in crude oil production impacted the performance of infrastructure. While coal production recovered, cement and steel sectors recorded decelerated growth due to capacity constraints.
Services Sector
I.10 After recording double-digit growth for fourteen consecutive quarters, the services sector growth decelerated to single digit at 9.6 per cent during the second quarter of 2008-09, thereby reducing its relative contribution to real GDP growth (Table 7). The deceleration in growth was mainly on account of lower growth recorded by ‘financing, insurance, real estate and business services’ and ‘construction’.
Table 7: Growth in Services Sector |
(Contribution to real GDP growth; percentage points) |
Year/Quarter |
Construction |
Trade, Hotels, Transport and Communication |
Financing, Insurance, Real Estate and Business Services |
Community, Social
and Personal
Services |
Total
Services |
1 |
2 |
3 |
4 |
5 |
6 |
2007-08 |
0.7 |
3.2 |
1.7 |
1.0 |
6.6 |
2007-08: Q1 |
0.6 |
3.4 |
1.8 |
0.7 |
6.5 |
2007-08: Q2 |
0.9 |
3.0 |
1.9 |
1.1 |
6.9 |
2007-08:Q3 |
0.5 |
3.0 |
1.6 |
0.8 |
5.9 |
2007-08:Q4 |
0.9 |
3.4 |
1.5 |
1.3 |
7.1 |
2008-09:Q1 |
0.8 |
3.0 |
1.4 |
1.1 |
6.4 |
2008-09:Q2 |
0.7 |
3.0 |
1.4 |
1.1 |
6.2 |
Source : Central Statistical Organisation. |
I.11 Most of the lead indicators of services sector activity for April-October 2008-09 indicate a sharp deceleration in growth. However, revenue earning railway freight traffic witnessed acceleration during April-November 2008-09 (Table 8).
Table 8: Indicators of Services Sector Activity |
(Growth rates in per cent) |
Sub-sector |
2007-08 |
|
April-October |
|
|
2007-08 |
2008-09 |
1 |
2 |
3 |
4 |
Tourist arrivals |
12.2 |
12.1 * |
8.9 * |
Commercial vehicles production |
4.8 |
4.8 @ |
-8.4 @ |
Railway revenue earning freight traffic |
9.0 |
11.0 @ |
14.3 @ |
New cell phone connections |
38.3 |
46.2 @ |
27.7 @ |
Cargo handled at major ports |
11.9 |
13.2 @ |
3.9 @ |
Civil aviation |
|
|
|
a) Export cargo handled |
7.5 |
7.0 |
7.0 |
b) Import cargo handled |
19.7 |
22.7 |
4.2 |
c) Passengers handled at international terminals |
11.9 |
12.5 |
7.5 |
d) Passengers handled at domestic terminals |
20.6 |
25.6 |
-8.5 |
Cement |
8.1 |
8.1 @ |
6.4 @ |
Steel |
5.1 |
7.0 @ |
3.3 @ |
Aggregate deposits of SCBs |
22.4 |
14.3 @@ |
13.2 @@ |
Non-food credit of SCBs |
23.0 |
11.6 @@ |
12.4 @@ |
* : April-September.
@ : April-November.
@@ : Up to January 2, 2009.
Source :Ministry of Tourism; Ministry of Commerce and Industry; Ministry of Statistics and Programme Implementation; Reserve Bank of India; and Centre for Monitoring Indian Economy. |
|
 IST,
IST,


