II.1 Aggregate demand in the Indian economy is primarily domestically driven, though exports have been progressively gaining higher importance in recent years. The economic slowdown during the second quarter vis-à-vis the first quarter of 2008-09 was primarily driven by a moderation of consumption growth and widening of trade deficit, offset partially by an acceleration in fixed investment demand. On the other hand, the government consumption expenditure accelerated during the same period. The key deficit indicators of the Central Government, viz., the gross fiscal deficit and revenue deficit widened during April-November 2008-09 as compared to a year ago.
Table 9: Disposition of GDP at Market Prices (at 1999-2000 Prices) – Shares |
(Per cent of GDP at market prices) |
Item |
2007-08 # |
2007-08 |
2008-09 |
2007-08 |
2008-09 |
|
|
Q1 |
Q2 |
Q3 |
Q4 |
Q1 |
Q2 |
April-September |
1 |
2 |
3 |
4 |
5 |
6 |
7 |
8 |
9 |
10 |
1. |
Total Final Consumption |
|
|
|
|
|
|
|
|
|
|
Expenditure |
67.8 |
70.1 |
68.2 |
69.0 |
64.6 |
70.1 |
66.7 |
69.1 |
68.4 |
|
(i) Private Final Consumption |
|
|
|
|
|
|
|
|
|
|
Expenditure |
58.2 |
59.8 |
59.5 |
60.7 |
53.4 |
59.8 |
58.0 |
59.6 |
58.9 |
|
(ii) Government Final |
|
|
|
|
|
|
|
|
|
|
Consumption Expenditure |
9.6 |
10.3 |
8.7 |
8.3 |
11.2 |
10.3 |
8.7 |
9.5 |
9.5 |
2. |
Gross Fixed Capital Formation |
31.9 |
32.0 |
33.4 |
31.0 |
31.6 |
32.3 |
35.3 |
32.7 |
33.8 |
3. |
Change in Stocks |
2.0 |
2.1 |
2.1 |
1.9 |
1.9 |
2.1 |
2.1 |
2.1 |
2.1 |
4. |
Valuables |
1.3 |
1.2 |
1.3 |
1.4 |
1.1 |
1.3 |
1.4 |
1.3 |
1.3 |
5. |
Exports |
20.3 |
23.8 |
16.8 |
19.0 |
21.6 |
26.0 |
17.6 |
20.2 |
21.8 |
6. |
Less Imports |
24.4 |
24.9 |
24.8 |
25.4 |
22.8 |
28.4 |
28.3 |
24.8 |
28.4 |
7. |
Discrepancies |
1.1 |
-4.3 |
3.1 |
3.0 |
1.9 |
-3.3 |
5.1 |
-0.5 |
1.0 |
Memo: |
(Rupees crore) |
Real GDP at market prices |
33,98,767 |
7,69,870 |
7,88,513 |
8,99,098 |
9,41,283 |
8,30,681 |
8,48,278 |
15,58,383 |
16,78,958 |
# : Revised Estimates.
Source: Central Statistical Organisation. |
Merchandise trade deficit recorded a sharp increase during April-November 2008 on account of higher oil imports. Domestic Demand
II.2 The share of total final consumption expenditure continued to decline in the second quarter of 2008-09 as compared with that of the corresponding quarter of the preceding year, mainly due to decline in private final consumption expenditure (PFCE). On the other hand, the share of real gross fixed capital formation (GFCF) increased during the second quarter of 2008-09 over the corresponding period of 2007-08 (Table 9).
II.3 The moderation of growth during the second quarter of 2008-09 vis-à-vis the second quarter of 2007-08 was driven by all the components of domestic demand. An analysis of the pattern of domestic demand shows that the growth in gross fixed investment was lower during the second quarter of 2008-09 than a year ago, but higher than in the first quarter of 2008-09. On the other hand, private final consumption expenditure growth during the second quarter of 2008-09 was lower than a year ago as well as that of the first quarter of 2008-09. The growth in government final consumption expenditure picked up during the second quarter of 2008-09 from that of the first quarter but was lower than that of the second quarter of 2007-08. On balance, the cumulative position during April-September 2008-09 shows that the economic slowdown was driven by both private consumption demand and gross fixed investment, while government
Table 10: Disposition of GDP at Market Prices (at 1999-2000 Prices) – Growth Rates |
(Per cent) |
Item |
2007-08 |
2008-09 |
2007-08 |
2008-09 |
|
Q1 |
Q2 |
Q3 |
Q4 |
Q1 |
Q2 |
April-September |
1 |
2 |
3 |
4 |
5 |
6 |
7 |
8 |
9 |
Total Final Consumption Expenditure |
6.1 |
8.0 |
8.5 |
9.7 |
7.9 |
5.5 |
7.0 |
6.7 |
of which: Private final consumption expenditure |
7.6 |
7.6 |
9.4 |
8.3 |
8.0 |
5.0 |
7.6 |
6.5 |
Government final consumption expenditure |
-2.2 |
10.3 |
2.2 |
16.7 |
7.7 |
8.6 |
3.2 |
8.1 |
Gross fixed capital formation |
13.3 |
16.7 |
14.3 |
11.2 |
9.0 |
13.8 |
15.0 |
11.4 |
Changes in stocks |
9.1 |
7.4 |
7.7 |
4.0 |
4.3 |
4.3 |
8.2 |
4.3 |
Valuables |
2.6 |
12.9 |
29.8 |
10.0 |
15.8 |
10.2 |
7.8 |
12.8 |
Exports |
6.0 |
-2.8 |
15.8 |
10.1 |
18.1 |
13.1 |
2.1 |
16.0 |
Less Imports |
6.0 |
0.4 |
14.2 |
9.6 |
23.4 |
22.6 |
3.1 |
23.0 |
GDP at 1999-2000 market prices |
9.2 |
9.2 |
8.9 |
8.8 |
7.9 |
7.6 |
9.2 |
7.7 |
Source : Central Statistical Organisation. |
consumption demand acted as a counter-cyclical stabiliser (Table 10).
Combined Budgeted Government Finances: 2008-09
II.4 The combined finances of the Central and State Governments for 2008-09 were budgeted to improve in line with the fiscal consolidation process. The key deficit indicators were budgeted to decline over the revised estimates for 2007-08, both in absolute terms and as percentage of GDP. Primary balance was budgeted to record a surplus in 2008-09 (BE) (Table 11). The envisaged improvement in the combined finances, in terms of budget estimates for 2008-09 is now unlikely, in view of slowing domestic economy that has necessitated fiscal stimulus, along with lower than expected revenue growth. In terms of Central Government finances, it is reflected in the substantial supplementary demand for grants resorted to by the Central Government.
Table 11: Key Fiscal Indicators |
(Per cent to GDP) |
Year |
Primary Deficit |
Revenue
Deficit |
Gross Fiscal
Deficit |
Outstanding
Liabilities* |
1 |
|
2 |
3 |
4 |
5 |
Centre |
2007-08 RE |
|
-0.6 |
1.4 |
3.1 |
61.5 |
|
|
(-0.9) |
(1.2) |
(2.8) |
|
2008-09 BE |
|
-1.1 |
1.0 |
2.5 |
57.7 |
|
|
|
|
|
|
States |
2007-08 RE |
|
0.1 |
-0.5 |
2.3 |
28.3 |
2008-09 BE |
|
0.1 |
-0.5 |
2.1 |
27.4 |
Combined |
2007-08 RE |
|
-0.3 |
0.9 |
5.3 |
76.9 |
2008-09 BE |
|
-0.8 |
0.5 |
4.6 |
73.4 |
RE: Revised Estimates.
BE: Budget Estimates.
*: Includes external liabilities at historical exchange rates.
Note :
1. Figures in parentheses relate to provisional accounts.
2. Negative sign indicates surplus.
3. Data in respect of States relate to 28 State Governments. |
Centre’s Fiscal Situation
II.5 According to the latest information on Central Government finances for 2008-09 (April-November), the revenue deficit was placed higher than that in April-November 2007 both in absolute terms and as per cent of budget estimates mainly on account of higher revenue expenditure (Table 12). As a result, fiscal deficit turned out to be higher than the preceding year (Chart 4).
II.6 It may be noted that in the supplementary demand for grants placed before the Parliament in October and December 2008, the Central Government has taken approval for gross expenditure of Rs.2,37,286 crore and Rs.55,605 crore, respectively, of which net cash outgo would be Rs.1,05,613 crore and Rs.42,480 crore, respectively. While expenditure is slated to increase, growth of tax revenue is likely to decelerate in the coming months of 2008-09 due to moderation in economic activity. This, in turn, will be reflected in the non-attainability of the deficit targets for 2008-09 as envisaged in the Union Budget 2008-09.
II.7 During April-November 2008, tax revenue as per cent of budget estimates was lower than a year ago on account of lower growth in income tax, corporation tax and customs duties owing to economic slowdown. Non-tax revenue, as per cent of budget estimates, was also lower than a year ago mainly on account of decline in interest receipts. Aggregate expenditure, as per cent of budget estimates, was higher than a year ago (adjusted for acquisition cost of Reserve Bank’s stake in SBI in 2007) on account of higher revenue expenditure, particularly, subsidies, defence, other economic services, social services and plan grants to States/UTs.
Table 12: Central Government Finances during April-November 2008 |
(Rupees crore) |
Items |
2008-09 |
April-November |
|
(BE) |
(Rupees crore) |
Per cent of BE |
|
|
2007 |
2008 |
2007 |
2008 |
1 |
2 |
3 |
4 |
5 |
6 |
1. |
Revenue Receipts (i + ii) |
6,02,935 |
2,74,633 |
3,14,974 |
56.5 |
52.2 |
|
i) |
Tax Revenue |
5,07,150 |
2,20,372 |
2,53,558 |
54.6 |
50.0 |
|
ii) |
Non-tax Revenue |
95,785 |
54,261 |
61,416 |
65.7 |
64.1 |
2. |
Non-Debt Capital Receipts |
14,662 |
40,468 |
2,640 |
93.8 |
18.0 |
|
|
|
|
(6,159) |
|
(195.5) |
|
3. |
Non-Plan Expenditure |
5,07,498 |
2,98,756 |
3,57,994 |
62.8 |
70.5 |
|
|
|
|
(2,63,225) |
|
(60.5) |
|
|
of which: |
|
|
|
|
|
|
i) |
Interest Payments |
1,90,807 |
1,03,648 |
1,11,680 |
65.2 |
58.5 |
|
ii) |
Defence |
1,05,600 |
40,328 |
52,557 |
42.0 |
49.7 |
|
iii) |
Subsidies |
67,037 |
46,222 |
98,739 |
90.2 |
147.2 |
|
iv) |
Grants to States and UTs |
43,294 |
22,428 |
21,068 |
58.4 |
48.7 |
4. |
Plan Expenditure |
2,43,386 |
1,12,619 |
1,36,130 |
54.9 |
55.9 |
5. |
Revenue Expenditure |
6,58,119 |
3,44,607 |
4,56,338 |
61.8 |
69.3 |
6. |
Capital Expenditure |
92,765 |
64,768 |
37,786 |
54.5 |
40.7 |
|
|
|
(31,237) |
|
(37.8) |
|
7. |
Total Expenditure |
7,50,884 |
4,11,375 |
4,94,124 |
60.5 |
65.8 |
|
|
|
(3,75,844) |
|
(58.7) |
|
8. |
Revenue Deficit |
55,184 |
69,974 |
1,41,364 |
97.9 |
256.2 |
9. |
Gross Fiscal Deficit |
1,33,287 |
96,274 |
1,76,510 |
63.8 |
132.4 |
|
|
|
(95,052) |
|
(63.0) |
|
10. |
Gross Primary Deficit |
-57,520 |
-7,374 |
64,830 |
– |
– |
|
|
|
(-8,596) |
|
|
|
Memo: |
|
|
|
|
|
1. Gross Tax Revenue |
6,87,715 |
3,04,105 |
3,57,441 |
52.0 |
55.5 |
|
Direct Taxes |
3,65,000 |
1,44,873 |
1,77,511 |
54.2 |
48.6 |
|
Indirect Taxes |
3,22,715 |
1,59,231 |
1,79,930 |
56.7 |
55.8 |
2. Extra-budgetary Items* |
– |
15,147 # |
58,000
# |
– |
– |
BE : Budget Estimates. UTs : Union Territories. * : Comprises oil and fertiliser bonds. # : Up to January 19.
Note : Figures in parentheses are net of transactions relating to transfer of Reserve Bank’s stake in State Bank of India to the Government.
Source : Controller General of Accounts, Ministry of Finance. |
Capital outlay during April-November 2008-09 increased by 23.0 per cent as against a decline of 3.0 per cent during April-November, 2007 (adjusted for acquisition cost of Reserve Bank’s stake in SBI in 2007). Non-plan expenditure as a per cent of budget estimates was higher than a year ago. Non-debt capital receipts were lower than that of the preceding year (adjusted for profit on sale of Reserve Bank’s stake in SBI) as the budgeted dilution of equities in power companies is yet to take place. 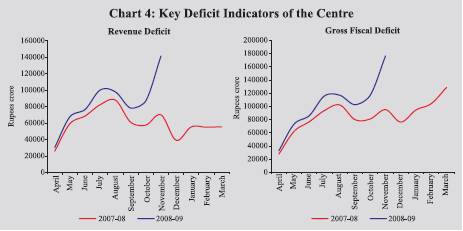
Mid-Year Review by the Government of India
II.8 The Mid-Year Review for 2008-09 by the Government of India noted that revenue deficit exceeded the target of 1.0 per cent of GDP in each of the first six months of 2008-09. The Review anticipated the expenditure to rise during the second half of the year on account of implementation of the Sixth Pay Commission recommendations, explicit food and fertiliser subsidies, farmers debt waiver and debt relief scheme and National Rural Guarantee Scheme included in the first batch of supplementary demand for grants. Actual headroom for additional committed expenditure would depend on the buoyancy of revenue. The Review hoped for some improvement in non-tax revenue on account of receipts from the telecom sector.
II.9 The Review recognised that continued momentum on fiscal consolidation is vital for the Government’s capacity to use fiscal policy as an active counter-cyclic instrument for promoting stability and growth in an uncertain global context. However, it was also indicated that Government’s conscious decision to increase public expenditure in order to maintain the higher trajectory of growth in the Indian Economy (Table 13) is likely to drive up the fiscal and revenue deficit for 2008-09 above the budgetary targets.
Extra-Budgetary Items
II.10 The Central Government, besides providing explicit subsidies on food, fertiliser and petroleum, has also been supporting Food Corporation of India (FCI), fertiliser companies and oil marketing companies through issuance of special bonds. These bonds are considered to be fiscal deficit neutral since they do not involve cash flow and are, therefore, not treated as part of budgetary expenditure/receipts. However, these bonds have fiscal implications as they add to the fiscal liabilities of the Government. Furthermore, as interest payments on such bonds are treated as part of the revenue expenditure, they affect the revenue deficit and, thereby, the fiscal deficit. During 2008-09 (up to January 19, 2009), special bonds amounting to Rs.44,000 crore and Rs.14,000 crore have been issued to oil marketing companies and fertiliser companies, respectively. Table 13: Major Post Budget Fiscal Stimulus Measures October 20, 2008 • The supplementary demand for grants provided for a gross expenditure amounting to Rs.2,37,286 crore with net cash outgo of Rs.1,05,613 crore mainly to finance schemes/plans announced in the Union Budget for 2008-09 but for which no provisions were made.
December 7, 2008
• The three major ad valorem rates of central excise duty, viz., 14 per cent, 12 per cent and 8 per cent applicable to non-petroleum products were reduced by 4 percentage points each.
• For promoting exports, pre-shipment and post-shipment export credit for labour intensive exports, i.e., textiles (including handlooms, carpets and handicrafts), leather, gems & jewellery, marine products and SME sector is being made more attractive by providing an interest subvention of 2 per cent up to March 31, 2009 subject to minimum rate of interest of 7 per cent per annum. An additional fund of Rs.1,100 crore to ensure full refund of terminal excise duty/central sales tax (CST) was announced. Furthermore, an additional allocation of Rs.350 crore for export incentive schemes was announced.
• In order to provide a contra-cyclical stimulus via plan expenditure, an additional Plan expenditure of up to Rs 20,000 crore in the current fiscal year was allocated.
• In the textile sector, an additional allocation of Rs.1,400 crore will be made to clear the entire backlog of Technology Up-gradation Fund (TUF) Scheme.
• In order to support the infrastructure schemes under Public Private partnership mode, India Infrastructure Finance Company Limited (IIFCL) was authorised to raise Rs.10,000 crore through tax-free bonds by March 31, 2009.
December 19, 2008
• The second supplementary demand for grants provided for a gross expenditure amounting to Rs.55,605 crore with net cash outgo of Rs.42,480 crore. State Finances
II.11 The State Governments committed to pursue fiscal correction and consolidation in their budgets for 2008-09. Notwithstanding some variations across the States, the consolidated revenue balance of 28 State Governments was budgeted to show further improvement in 2008-09, with the revenue surplus placed higher at 0.54 per cent of GDP as compared with 0.48 per cent during the previous year. GFD was budgeted lower at 2.1 per cent of GDP in 2008-09 BE as compared with 2.3 per cent in 2007-08 (RE). However, primary deficit was to be maintained at 0.1 per cent of GDP in 2008-09 (BE) as in the previous year. Corporate Performance
II.12 Sales performance of select non-Government non-financial public limited companies in the private corporate sector during the first two quarters of 2008-09 was impressive; however, profits performance was subdued as compared with 2007-08. Higher increase in expenditure in relation to sales growth was primarily on account of rising input costs, interest expenses and large provisioning towards mark to market (MTM) losses on foreign exchange related transactions which exerted pressure on profits. Consequently, net profits decelerated during the first quarter and declined marginally during the second quarter of 2008-09 as against sizeable increases in the corresponding quarters of 2007-08 (Table 14). Reflecting increase in interest
Table 14: Corporate Sector - Financial Performance |
(Per cent) |
|
|
2007-08 |
2008-09 |
Item |
2007-08 |
Q1 |
Q2 |
Q3 |
Q4 |
Q1 |
Q2 |
1 |
2 |
3 |
4 |
5 |
6 |
7 |
8 |
Sales |
18.3 |
19.2 |
16.0 |
18.0 |
20.6 |
29.3 |
31.8 |
Other income |
46.2 |
106.7 |
45.2 |
70.2 |
28.5 |
-8.4 |
-0.6 |
Expenditure |
18.4 |
18.0 |
15.3 |
18.9 |
23.3 |
33.5 |
37.5 |
Depreciation provision |
14.8 |
18.1 |
15.8 |
17.9 |
15.4 |
15.3 |
16.5 |
Gross profits |
22.8 |
31.9 |
22.5 |
20.4 |
16.8 |
11.9 |
8.7 |
Interest payments |
28.8 |
4.4 |
18.4 |
45.7 |
35.8 |
58.1 |
85.3 |
Profits after tax |
26.2 |
33.9 |
22.7 |
29.4 |
14.1 |
6.9 |
-2.6 |
|
|
Select Ratios |
|
|
|
|
Gross Profits to Sales |
16.3 |
16.7 |
16.3 |
16.2 |
15.0 |
14.5 |
13.5 |
Profits After Tax to Sales |
11.8 |
11.6 |
11.5 |
12.2 |
10.3 |
9.7 |
8.6 |
Interest to Sales |
2.2 |
2.0 |
2.1 |
2.5 |
2.2 |
2.4 |
2.9 |
Interest to Gross Profits |
13.8 |
11.8 |
12.8 |
15.3 |
14.6 |
16.8 |
21.5 |
Interest Coverage (Times) |
7.3 |
8.5 |
7.8 |
6.5 |
6.8 |
6.0 |
4.6 |
Memo: |
|
|
|
|
(Amount |
in Rupees crore) |
No of companies |
2,359 |
2,342 |
2,228 |
2,329 |
2,357 |
2,500 |
2,386 |
Sales |
11,41,711 |
2,80,814 |
2,97,110 |
3,06,238 |
3,50,917 |
3,65,303 |
3,93,626 |
Other income* |
30,958 |
9,151 |
8,057 |
9,221 |
10,082 |
7,666 |
7,943 |
Expenditure |
9,56,930 |
2,37,698 |
2,49,194 |
2,57,472 |
3,02,105 |
3,17,605 |
3,43,921 |
Depreciation provision |
40,664 |
10,173 |
10,576 |
10,961 |
11,805 |
11,590 |
12,075 |
Gross profits |
1,86,665 |
46,780 |
48,296 |
49,717 |
52,583 |
52,930 |
52,968 |
Interest Payments |
25,677 |
5,504 |
6,194 |
7,609 |
7,703 |
8,891 |
11,403 |
Profits after tax |
1,34,291 |
32,699 |
34,266 |
37,470 |
36,109 |
35,295 |
33,844 |
*: Other income excludes extraordinary income/expenditure if reported explicitly.
Notes :
1. Data for 2007-08 and 2008-09 are based on abridged financial results of the select non-government non- financial public limited companies.
2. Growth rates are percentage changes in the level for the period under reference over the corresponding period of the previous year for common set of companies.
3. The quarterly data may not add up to annual data due to differences in the number and composition of companies covered, in each period. |
payments coupled with deceleration in gross profits, interest burden (measured as interest to gross profits) increased during the second quarter of 2008-09.
II.13 The profits of select non-financial government companies also remained subdued during the first half of 2008-09 reflecting largely the performance of oil companies. Seven listed oil companies, despite posting a revenue growth of 55.1 per cent, suffered losses during the first half of 2008-09 as against profits during the corresponding previous period. In particular, the combined losses of three major oil marketing companies arose primarily on account of increase in net under-recovery on sale of petrol, diesel, kerosene and LPG as a result of non-revision of retail selling prices in line with rising international prices. These companies were issued oil bonds by the Government to partially compensate the under-realisation. In contrast to losses reported by oil companies, the performance of 49 non-oil non-financial Government companies showed that they posted a growth in net profits of 12.8 per cent during the first half of 2008-09 over the corresponding previous period.
External Demand
II.14 External demand as reflected in net exports (of goods and services) as a percentage of GDP, deteriorated to (-) 7.9 per cent during the first half of 2008-09 as compared with (-) 4.8 per cent in the corresponding period of the previous year. Merchandise trade deficit recorded a sharp increase during April-November 2008 on account of higher oil prices coupled with loss of momentum in exports since September 2008. Export growth decelerated in September 2008 and thereafter turned negative in October-November 2008. Merchandise trade deficit during April-November 2008 widened to US $ 84.4 billion from US $ 53.2 billion a year ago. A detailed discussion on the external demand conditions is set out in Chapter III. |


