 IST,
IST,
II. Fiscal Situation
Centre’s Fiscal Position: 2005-06
The revised estimates for 2005-06 placed the key deficit indicators of the Central Government lower than the budgeted levels (Table 11). This was enabled mainly by compression undertaken in non-Plan expenditures in respect of interest payments, subsidies, grants to the States and defence expenditure. The Government could contain the key deficit indicators in spite of the additional resource requirements for implementing the recommendations of the Twelfth Finance Commission (TFC), which had necessitated the Union Budget for 2005-06 to set a ‘pause’ in the fiscal correction process prescribed under the Fiscal Responsibility and Budget Management (FRBM) Rules, 2004.
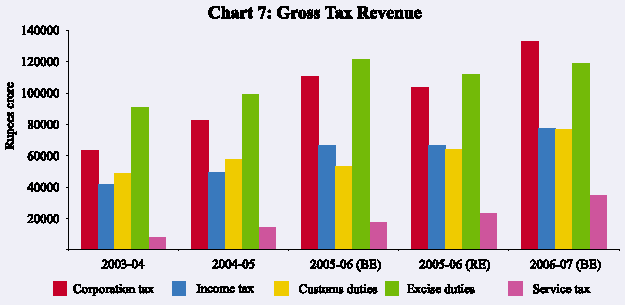
Revenue receipts in the revised estimates are placed at 9.9 per cent of GDP as compared with 10.1 per cent in budget estimates, showing a shortfall of 0.8 per cent over the budgeted level for 2005-06 on account of lower non-tax revenue (4.4 per cent less than the budgeted level). The gross tax revenue, on the other hand, remained almost at the same level as in the budget estimates as the shortfalls in the corporation tax, personal income tax and excise duties were offset by higher collections from customs duties, service tax and new taxes (Chart 7).
The shortfall in non-tax revenue was mainly on account of interest receipts, which were lower by Rs.4,256 crore (16.7 per cent) than the budget estimates reflecting the impact of rescheduling of loans of the Centre to the States under the TFC’s award. Among the non-debt capital receipts, recovery of loans was marginally lower (2.5 per cent) than the budgeted level. The revised estimates show an amount of Rs.2,356 crore under disinvestment proceeds (Table 12).
|
Table 11: Deficit Indicators of the Centre |
||||||
|
(Amount in Rupees crore) |
||||||
|
Item |
2004-05 |
2005-06 (BE) |
2005-06 (RE) |
Variation (4 over 3) |
||
|
Amount |
Per cent |
|||||
|
1 |
2 |
3 |
4 |
5 |
6 |
|
|
1. |
Gross Fiscal Deficit |
1,25,202 |
1,51,144 |
1,46,175 |
-4,969 |
-3.3 |
|
(4.0) |
(4.3) |
(4.1) |
||||
|
2. |
Revenue Deficit |
78,338 |
95,312 |
91,821 |
-3,491 |
-3.7 |
|
(2.5) |
(2.7) |
(2.6) |
||||
|
3. |
Gross Primary Deficit |
-1,732 |
17,199 |
16,143 |
-1,056 |
-6.1 |
|
(-0.1) |
(0.5) |
(0.5) |
||||
|
RE : Revised Estimates. BE : Budget Estimates. |
||||||
Aggregate expenditure in the revised estimates for 2005-06 was 1.1 per cent lower than the budgeted level, mainly on account of compression in non-Plan expenditure under interest payments, grants to States, food subsidy and defence. Plan expenditure was marginally higher than the budgeted level on account of the Central Assistance for State and Union Territory (UT) Plans, reflecting provision for pass-through of the loan component of externally aided projects (Table 13).
|
Table 12: Receipts of the Centre |
|||||||
|
(Amount in Rupees crore) |
|||||||
|
Item |
2004-05 |
2005-06 (BE) |
2005-06 (RE) |
Variation (4 over 3) |
|||
|
Amount |
Per cent |
||||||
|
1 |
2 |
3 |
4 |
5 |
6 |
||
|
1. Total Receipts (2+3) |
4,97,682 |
5,14,344 |
5,08,705 |
-5,639 |
-1.1 |
||
|
(15.9) |
(14.8) |
(14.4) |
|||||
|
2. Revenue Receipts (i+ii) |
3,06,013 |
3,51,200 |
3,48,474 |
-2,726 |
-0.8 |
||
|
(9.8) |
(10.1) |
(9.9) |
|||||
|
i. |
Tax Revenue |
2,24,798 |
2,73,466 |
2,74,139 |
673 |
0.2 |
|
|
(7.2) |
(7.9) |
(7.8) |
|||||
|
ii. |
Non-tax Revenue |
81,215 |
77,734 |
74,335 |
-3,399 |
-4.4 |
|
|
(2.6) |
(2.2) |
(2.1) |
|||||
|
3. |
Capital Receipts |
1,91,669 |
1,63,144 |
1,60,231 |
-2,913 |
-1.8 |
|
|
(6.1) |
(4.7) |
(4.5) |
|||||
|
of which: |
|||||||
|
i. |
Market Borrowings |
50,940 |
1,03,792 |
1,01,082 |
-2,710 |
-2.6 |
|
|
ii. |
Recovery of Loans |
62,043 |
12,000 |
11,700 |
-300 |
-2.5 |
|
|
iii. |
Disinvestment proceeds |
4,424 |
0 |
2,356 |
2,356 |
– |
|
|
BE : Budget Estimates. RE : Revised Estimates. |
|||||||
|
Table 13: Aggregate Expenditure of the Centre |
||||||
|
(Amount in Rupees crore) |
||||||
|
Item |
2004-05 |
2005-06 (BE) |
2005-06 (RE) |
Variation (4 over 3) |
||
|
Amount |
Per cent |
|||||
|
1 |
2 |
3 |
4 |
5 |
6 |
|
|
1. |
Total Expenditure |
4,97,682 |
5,14,344 |
5,08,705 |
-5,639 |
-1.1 |
|
( 2 + 3 = 4 + 5 ) |
(15.9) |
(14.8) |
(14.4) |
|||
|
2. |
Non-Plan Expenditure |
3,65,406 |
3,70,847 |
3,64,914 |
-5,933 |
-1.6 |
|
(11.7) |
(10.7) |
(10.3) |
||||
|
of which: |
||||||
|
Interest Payments |
1,26,934 |
1,33,945 |
1,30,032 |
-3,913 |
-2.9 |
|
|
(4.1) |
(3.8) |
(3.7) |
||||
|
Defence |
75,856 |
83,000 |
81,700 |
-1,300 |
-1.6 |
|
|
(2.4) |
(2.4) |
(2.3) |
||||
|
Subsidies |
43,653 |
47,432 |
46,874 |
-558 |
-1.2 |
|
|
(1.4) |
(1.4) |
(1.3) |
||||
|
3. |
Plan Expenditure |
1,32,276 |
1,43,497 |
1,43,791 |
294 |
0.2 |
|
(4.2) |
(4.1) |
(4.1) |
||||
|
4. |
Revenue Expenditure |
3,84,351 |
4,46,512 |
4,40,295 |
-6,217 |
-1.4 |
|
(12.3) |
(12.8) |
(12.5) |
||||
|
5. |
Capital Expenditure |
1,13,331 |
67,832 |
68,410 |
578 |
0.9 |
|
(3.6) |
(1.9) |
(1.9) |
||||
|
BE : Budget Estimates. RE : Revised Estimates. |
||||||
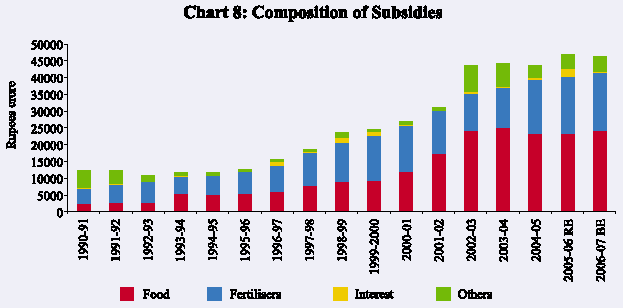
The total expenditure on subsidies in the revised estimates for 2005-06 at Rs.46,874 crore was lower by 1.2 per cent than budgeted, reflecting the Government’s policy of rationalising and containing expenditure through proper targeting (Chart 8). Expenditure on food subsidies could be contained mainly on account of lower carrying cost of foodgrain stocks. Expenditure on interest subsidies, however, exceeded the budget estimates by Rs.1,799 crore on account of provision for interest subsidy to farmers.
Financing of the Union Budget
Gross and net market borrowings (dated securities and 364-day Treasury Bills) of the Centre for 2005-06 were budgeted at Rs.1,65,467 crore and Rs.1,03,791 crore, respectively. In the revised estimates, the net market borrowings were placed lower at Rs.1,01,082 crore, reflecting mainly a reduction in the gross fiscal deficit (GFD). At this level, net market borrowings financed 69.2 per cent of GFD as compared with 68.7 per cent in the budget estimates. Apart from market borrowings, draw down of cash balances financed 10.3 per cent of GFD as compared with 2.3 per cent of GFD in the budget estimates. In the public account, while reserve funds and State provident funds financed a higher proportion of GFD than the budgeted level, deposits and advances financed a lower proportion.
The Central Government continued to maintain surplus cash balances with the Reserve Bank during 2005-06 – Rs.48,928 crore as on March 31, 2006 as compared with Rs.26,202 crore a year ago. This reflected essentially the parking of surplus cash by the State Governments in the 14-day intermediate Treasury Bills during the greater part of the year. Reflecting the comfortable liquidity position, the Centre availed ways and means advances (WMA) from the Reserve Bank only twice during 2005-06 (May 3, 2005 and June 4, 2005).
During 2005-06, the Government of India raised Rs.1,31,000 crore through the issuances of dated securities (excluding issuances under the Market Stabilisation Scheme) as compared with Rs.1,41,000 crore scheduled in the calendar for 2005-06 (Table 14). This was on account of (i) a reduction in the notified amount from Rs.4,000 crore (as per the issuance auction calendar) to Rs.2,000 crore for maturity of 29.27
|
Table 14: Central Government Dated Securities Issued during 2005-06 |
|||||||
|
Date of Notified Amount |
Residual |
Cut-off Yield |
Date of Notified Amount |
Residual |
Cut-off Yield |
||
|
Auction |
(Rupees crore) |
Maturity |
(Per cent) |
Auction (Rupees crore) |
Maturity |
(Per cent) |
|
|
(Years) |
(Years) |
||||||
|
1 |
2 |
3 |
4 |
1 |
2 |
3 |
4 |
|
April 5, 2005 |
5,000 |
6.98 |
6.80 |
August 18, 2005 |
5,000 |
8.66 |
7.04 |
|
April 5, 2005 |
3,000 |
27.39 |
7.79 |
August 18, 2005 |
3,000 |
28.98 |
7.55 |
|
April 19, 2005 |
5,000 |
11.74 |
7.48 |
September 8, 2005 |
5,000 |
13.04 |
7.23 |
|
April 19, 2005 |
2,000 |
29.31 |
7.94 |
September 8, 2005 |
3,000 |
30.00 |
7.40 |
|
May 3, 2005 |
6,000 |
5.03 |
6.99 |
October 6, 2005 |
3,000 |
29.92 |
7.66 |
|
May 3, 2005 |
2,000 |
29.27 |
7.98 |
November 8, 2005 |
5,000 |
11.44 |
7.33 |
|
May 24, 2005 |
4,000 |
16.05 |
7.28 |
November 8, 2005 |
3,000 |
29.83 |
7.73 |
|
June 6, 2005 |
4,000 |
15.98 |
7.47 |
November 24, 2005 |
5,000 |
16.47 |
7.43 |
|
June 6, 2005 |
6,000 |
8.86 |
6.91 |
December 6, 2005 |
5,000 |
11.11 |
7.24 |
|
June 23, 2005 |
5,000 |
10.81 |
6.91 |
December 6, 2005 |
3,000 |
29.76 |
7.55 |
|
July 5, 2005 |
6,000 |
8.16 |
7.06 |
January 9, 2006 |
6,000 |
5.48 |
6.70 |
|
July 5, 2005 |
4,000 |
15.90 |
7.57 |
January 9, 2006 |
4,000 |
29.66 |
7.43 |
|
July 18, 2005 |
5,000 |
15.86 |
7.81 |
February 7, 2006 |
3,000 |
11.56 |
7.38 |
|
August 11, 2005 |
3,000 |
28.99 |
7.44 |
February 7, 2006 |
3,000 |
29.59 |
7.63 |
|
August 11, 2005 |
5,000 |
11.43 |
7.14 |
March 6, 2006 * |
10,000 |
29.51 |
7.77 |
|
* : Privately placed with the Reserve Bank. |
|||||||
years in the auction of May 3, 2005; (ii) rejection of bids for an issue of Rs.6,000 crore on October 6, 2005; (iii) cancellation of the auction of dated securities scheduled for October 18-25, 2005 for an amount of Rs.4,000 crore based on review of the then borrowing requirements of the Government of India; (iv) reduction in the notified amount from Rs.6,000 crore to Rs.3,000 crore in the auction of a dated security with a tenor of 11.56 years on February 7, 2006; and (v) cancellation of the auction of dated securities scheduled for February 14-22, 2006 for an amount of Rs.5,000 crore. As against this, the Government privately placed dated securities for an amount of Rs.10,000 crore with the Reserve Bank on March 6, 2006 which was outside the issuance calendar. According to the Reserve Bank records, gross and net market borrowings (including dated securities, 364-day Treasury Bills and 182-day Treasury Bills) of the Centre amounted to 97.3 per cent and 94.3 per cent of the budget estimates as compared with 70.6 per cent and 51.0 per cent, respectively, a year ago.
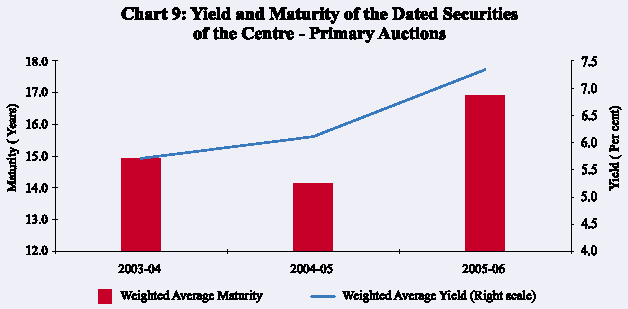
The weighted average maturity of dated securities issued by the Central Government increased from 14.13 years in 2004-05 to 16.90 years in 2005-06. The weighted average yield of the dated securities issued during the year increased from 6.11 per cent in 2004-05 to 7.34 per cent in 2005-06 (Chart 9). In this context, it may be noted that secondary market yield on 10-year Central Government securities increased from 6.65 per cent as at end-March 2005 to 7.52 per cent as at end-March 2006.
State Finances: 2005-06
The budget estimates for 2005-06 reveal an endeavour of the State Governments to carry forward fiscal correction and consolidation through progressive implementation of fiscal and institutional reforms at the State level. The submission of the Report by the Twelfth Finance Commission (TFC) and
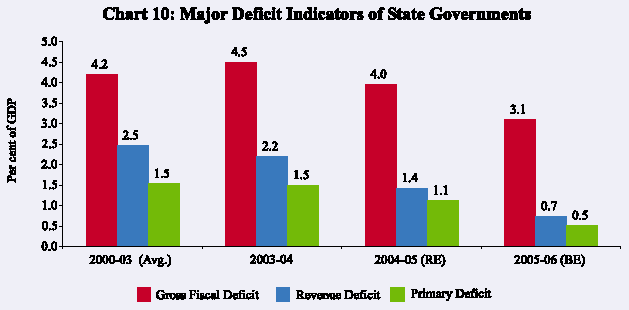
general acceptance of its recommendations by the Government of India was a major development, as it would form the basis of fiscal federal relations over the five-year period beginning 2005-06. Implementation of the Value Added Tax (VAT) by a majority of States with effect from April 1, 2005 was also a landmark development in respect of tax reform at the State level. In their budgets for 2005-06, many State Governments have envisaged carrying forward the process of fiscal correction and consolidation through the enactment of fiscal responsibility legislation (FRL), introduction of new taxes and modification of the existing ones, expenditure rationalisation, institutional reforms and introduction of new pension scheme based on defined contributions. Accordingly, the revenue deficit (RD) and gross fiscal deficit (GFD) are budgeted to decline by 44.0 per cent and 11.0 per cent, respectively, during 2005-06 over the previous year. The RD and GFD as ratio to gross domestic product (GDP) are placed at 0.7 per cent and 3.1 per cent, respectively, in 2005-06 – a reduction of 0.7 and 0.9 percentage points, respectively, over the previous year (Chart 10).
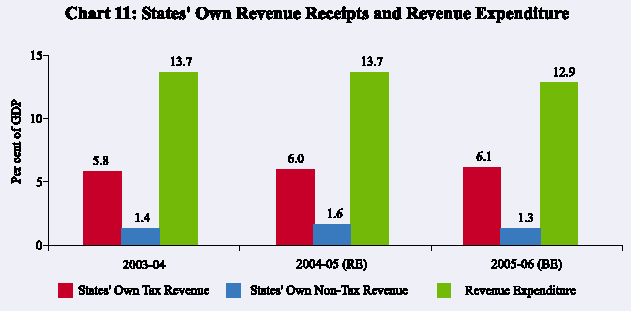
The correction in the revenue account in 2005-06 is sought to be achieved primarily through containment of non-interest revenue expenditure which, as a ratio to GDP, is budgeted to decline by 0.6 percentage points over the previous year. This, in turn, will be through the containment of the developmental expenditure (budgeted to grow by 3.0 per cent), while non-developmental expenditure will grow at a relatively higher rate of 9.2 per cent. Growth in the revenue receipts is, however, budgeted to decelerate from 21.5 per cent in 2004-05 to 11.9 per cent in 2005-06. Accordingly, in terms of GDP, revenue receipts have been envisaged to decline marginally. This would be on account of States’ own non-tax revenue, which is budgeted to decline by 0.3 percentage points of GDP, mainly as a result of a sharp decline in interest receipts (Chart 11).
The decomposition of GFD indicates that the share of the revenue deficit is expected to decline further during 2005-06, while that of capital outlay is expected to increase further. On the financing side, small savings (NSSF) will remain the largest financing source for GFD followed by loans from the Centre and market borrowings (Table 15).
|
Table 15: Decomposition and Financing Pattern of GFD of States |
||||||||
|
(Per cent) |
||||||||
|
1990-95 |
1995-2000 |
2000-03 |
2003-04 |
2004-05 |
2005-06 |
|||
|
(Average) |
(Average) |
(Average) |
(RE) |
(BE) |
||||
|
1 |
2 |
3 |
4 |
5 |
6 |
7 |
||
|
Decomposition (1+2+3) |
100.0 |
100.0 |
100.0 |
100.0 |
100.0 |
100.0 |
||
|
1. |
Revenue Deficit |
24.7 |
44.7 |
58.5 |
49.7 |
35.8 |
22.5 |
|
|
2. |
Capital Outlay |
55.3 |
43.2 |
34.7 |
42.6 |
55.2 |
69.7 |
|
|
3. |
Net Lending |
20.0 |
12.1 |
6.8 |
7.7 |
9.0 |
7.8 |
|
|
Financing (1 to 11) |
100.0 |
100.0 |
100.0 |
100.0 |
100.0 |
100.0 |
||
|
1. |
Market Borrowings |
16.0 |
16.1 |
19.9 |
38.4 |
26.4 |
14.6 |
|
|
2. |
Loans from Centre |
49.0 |
40.6 |
6.6 |
11.5 |
4.7 |
15.8 |
|
|
3. |
Loans against Securities issued to NSSF |
– |
28.9 * |
41.6 |
16.9 |
43.4 |
47.8 |
|
|
4. |
Loans from LIC, NABARD, NCDC, |
|||||||
|
SBI and other banks |
1.8 |
2.8 |
5.5 |
3.4 |
2.3 |
7.3 |
||
|
5. |
State Provident Funds |
14.3 |
13.4 |
9.2 |
5.8 |
7.8 |
7.2 |
|
|
6. |
Reserve Funds |
6.8 |
5.5 |
4.3 |
5.2 |
5.0 |
3.8 |
|
|
7. |
Deposits and Advances |
9.8 |
9.8 |
4.6 |
-0.3 |
-1.0 |
-2.5 |
|
|
8. |
Suspense and Miscellaneous |
4.3 |
2.7 |
0.4 |
-4.4 |
0.5 |
-1.3 |
|
|
9. |
Remittances |
-1.4 |
-3.6 |
0.3 |
1.5 |
-0.8 |
1.5 |
|
|
10.Increase (+)/Decrease (-) in Cash Balances |
4.4 |
-2.6 |
1.2 |
-0.9 |
-5.5 |
1.0 |
||
|
11.Others |
-5.0 |
9.5 |
6.4 |
23.0 |
17.1 |
4.7 |
||
|
BE : Budget Estimates. RE : Revised Estimates. – : Not applicable. |
||||||||
Market Borrowings
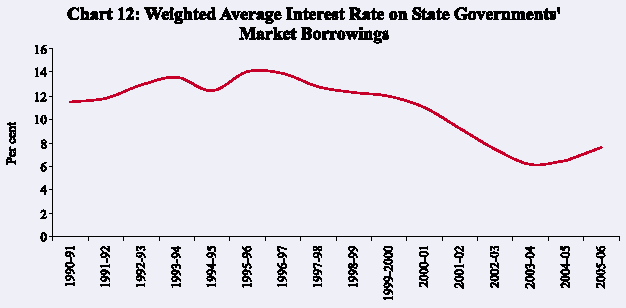
The net allocation under market borrowing programme for State Governments was provisionally placed at Rs.16,112 crore during 2005-06. Taking into account the repayments of Rs.6,274 crore and additional borrowing allocation of Rs.3,522 crore, the gross allocation amounted to Rs.25,909 crore. During 2005-06, the States raised Rs.21,729 crore, i.e., 84 per cent of their gross allocation (Table 16). The weighted average interest rate of market loans firmed up to 7.63 per cent during 2005-06 from 6.45 per cent during the previous year (Chart 12).
|
Table 16: Market Borrowings of State Governments during 2005-06 |
||||||
|
Item |
Date |
Cut-off Rate |
Tenor |
Amount Raised |
||
|
(per cent) |
(Years) |
(Rupees crore) |
||||
|
1 |
2 |
3 |
4 |
5 |
||
|
A. |
Tap Issues (i to iii) |
11,185 |
||||
|
i. |
First Tranche |
May 17-18, 2005 |
7.77 |
10 |
7,554 |
|
|
ii. |
Second Tranche |
September 13, 2005 |
7.53 |
10 |
2,931 |
|
|
iii. |
Third Tranche |
January 16, 2006 |
7.61 |
10 |
700 |
|
|
B. |
Auctions (i to xxiv) |
10,544 |
||||
|
i. |
First |
April 20, 2005 |
7.45 |
10 |
300 |
|
|
ii. |
Second |
June 14, 2005 |
7.39 |
10 |
2,181 |
|
|
iii. |
Second |
June 14, 2005 |
7.35 |
10 |
210 |
|
|
iv. |
Third |
August 4, 2005 |
7.32 |
10 |
250 |
|
|
v. |
Fourth |
September 27, 2005 |
7.45 |
10 |
367 |
|
|
vi. |
Fourth |
September 27, 2005 |
7.42 |
10 |
146 |
|
|
vii. |
Fourth |
September 27, 2005 |
7.50 |
10 |
327 |
|
|
viii. |
Fifth |
November 17, 2005 |
7.34 |
10 |
375 |
|
|
ix. |
Sixth |
December 15, 2005 |
7.33 |
10 |
361 |
|
|
x. |
Seventh |
January 19, 2006 |
7.32 |
10 |
317 |
|
|
xi. |
Seventh |
January 19, 2006 |
7.33 |
10 |
166 |
|
|
xii. |
Eighth |
February 27, 2006 |
7.65 |
10 |
950 |
|
|
xiii. |
Eighth |
February 27, 2006 |
7.67 |
10 |
619 |
|
|
xiv. |
Eighth |
February 27, 2006 |
7.68 |
10 |
600 |
|
|
xv. |
Eighth |
February 27, 2006 |
7.70 |
10 |
628 |
|
|
xvi. |
Eighth |
February 27, 2006 |
7.75 |
10 |
328 |
|
|
xvii. |
Eighth |
February 27, 2006 |
7.85 |
10 |
599 |
|
|
xviii.Ninth |
March 27, 2006 |
7.69 |
10 |
45 |
||
|
xix. |
Ninth |
March 27, 2006 |
7.70 |
10 |
50 |
|
|
xx. |
Ninth |
March 27, 2006 |
7.71 |
10 |
50 |
|
|
xxi. |
Ninth |
March 27, 2006 |
7.72 |
10 |
226 |
|
|
xxii. |
Ninth |
March 27, 2006 |
7.74 |
10 |
85 |
|
|
xxiii.Ninth |
March 27, 2006 |
7.75 |
10 |
175 |
||
|
xxiv. |
Ninth |
March 27, 2006 |
7.79 |
10 |
1,189 |
|
|
Grand Total (A+B) |
21,729 |
|||||
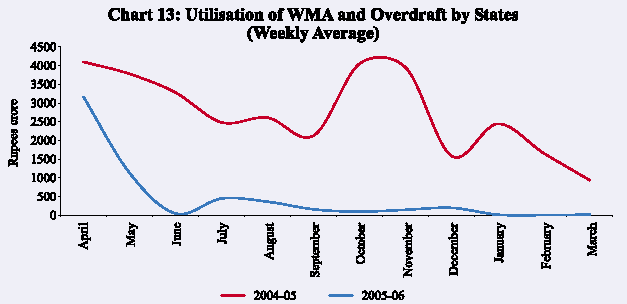
The weekly average utilisation of WMA and overdraft by the States during 2005-06 amounted to Rs.482 crore, significantly lower than that of Rs.2,749 crore in the previous year (Chart 13). Nine States resorted to overdraft during 2005-06 as compared with 13 States during 2004-05.
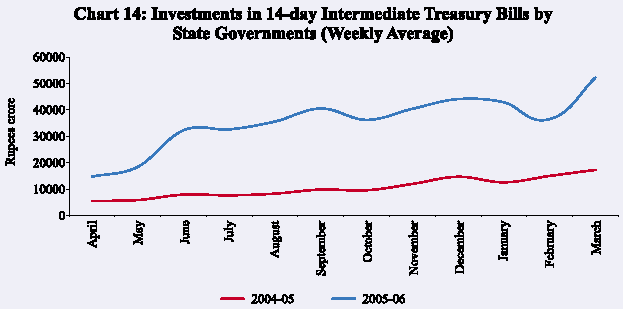
The improvement in the overall cash position of the States was also reflected in their investments in 14-day intermediate Treasury Bills which increased sharply to Rs.35,559 crore (weekly average) during 2005-06 from Rs.10,561 crore in the previous year (Chart 14).
Combined Government Finances: 2005-06
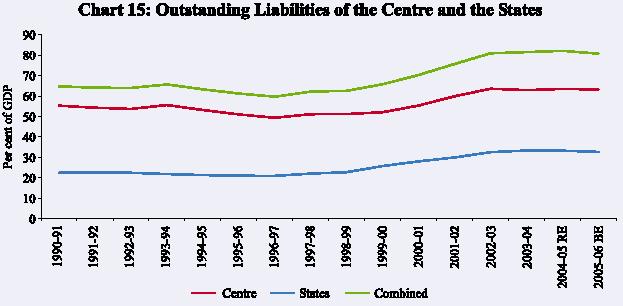
Reflecting the improvement in the fiscal position of the States, combined Government finances were budgeted to improve in 2005-06, with all key fiscal ratios placed lower than 2004-05 (Table 17). Reduction in the various deficit indicators was envisaged to be achieved through higher revenue mobilisation and moderation in the growth of expenditure. Concomitantly, the combined debt-GDP ratio of the Centre and the States was budgeted to decline from 82.1 per cent in 2004-05 to 80.7 per cent in 2005-06 (Chart 15).
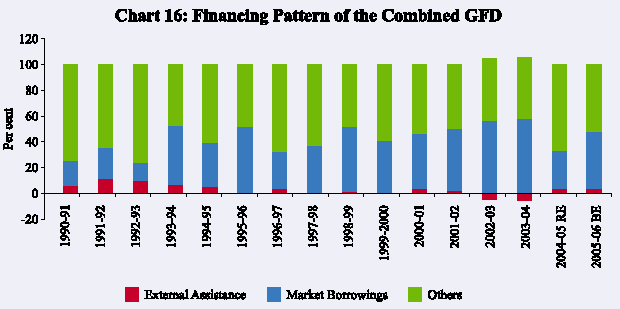
The combined fiscal deficit during 2005-06 was budgeted to be financed primarily from domestic sources. Market borrowings were budgeted to finance 44.3 per cent of the GFD during 2005-06 (29.9 per cent a year ago), while ‘other liabilities’ (small savings, provident funds and deposits) were budgeted to finance 52.2 per cent (66.6 per cent in 2004-05). External sources in the form of external assistance were budgeted to finance 3.6 per cent of the combined fiscal deficit during 2005-06 as compared with 3.4 per cent in 2004-05 (Chart 16).
|
Table 17: Combined Government Finances: Key Fiscal Indicators |
||||
|
(Per cent to GDP) |
||||
|
Year |
Primary Deficit |
Revenue Deficit |
Gross Fiscal Deficit |
|
|
1 |
2 |
3 |
4 |
|
|
2002-03 |
3.1 |
6.7 |
9.6 |
|
|
2003-04 |
2.1 |
5.8 |
8.5 |
|
|
2004-05 (RE) |
2.3 |
4.1 |
8.4 |
|
|
2005-06 (BE) |
1.8 |
3.4 |
7.7 |
|
|
RE : Revised Estimates. BE : Budget Estimates. |
||||
Fiscal Outlook: 2006-07
The Union Budget 2006-07 committed to resume the path of fiscal consolidation under the FRBM so as to eliminate the revenue deficit by 2008-09. The Budget sought to adopt a strategy of fiscal correction with substantial reductions in revenue deficit slated for 2007-08 and 2008-09. While it is admitted in the Budget that it is a ‘challenging’ task, it is nevertheless indicated that continued buoyancy in revenues on the back of higher growth trajectory and consolidating efforts in further containment of non-developmental revenue expenditure will facilitate the achievement of the FRBM Rules target. The key deficit indicators, viz., gross fiscal deficit (GFD), revenue deficit (RD) and primary
deficit (PD), as per cent of GDP, are budgeted to be lower in 2006-07 than the previous year’s level (Table 18). The order of the budgeted reductions is similar to the minimum threshold limits stipulated under the FRBM Rules, 2004. The roadmap envisages a revenue-led correction along with reprioritisation of expenditure to augment allocation for improvement in the social and physical infrastructure, particularly in the rural areas. The fiscal deficit is budgeted to be lower than the Plan Expenditure in 2006-07, reflecting the Government’s commitment not to finance the Plan entirely through borrowings.
The gross tax-GDP ratio (including transfers to the States) is budgeted to improve to 11.2 per cent in 2006-07 from 10.5 per cent in 2005-06 (RE), reflecting continued growth momentum as well as the impact of measures taken for widening the tax base, rationalising exemptions and efforts to improve tax compliance. The gross tax-GDP ratio during 2006-07 will be the highest since 1990-91, reflecting the improvement in direct tax revenues (Table 19). A salient feature of
|
Table 18: Union Budget 2006-07 at a Glance |
|||||||
|
(Amount in Rupees crore) |
|||||||
|
Item |
2005-06(RE) |
2006-07(BE) |
Growth rate (per cent) |
||||
|
2005-06 |
2006-07 |
||||||
|
1 |
2 |
3 |
4 |
5 |
|||
|
1. |
Revenue Receipts (i+ii) |
3,48,474 |
4,03,465 |
13.9 |
15.8 |
||
|
(9.9) |
(10.2) |
||||||
|
i) |
Tax Revenue |
2,74,139 |
3,27,205 |
21.9 |
19.4 |
||
|
(7.8) |
(8.3) |
||||||
|
ii) |
Non-tax Revenue |
74,335 |
76,260 |
-8.5 |
2.6 |
||
|
(2.1) |
(1.9) |
||||||
|
2. |
Non-Plan Expenditure |
3,64,914 |
3,91,263 |
-0.1 |
7.2 |
||
|
of which: |
(10.3) |
(9.9) |
[9.7] |
||||
|
i) |
Interest Payments |
1,30,032 |
1,39,823 |
2.4 |
7.5 |
||
|
(3.7) |
(3.5) |
||||||
|
ii) |
Defence |
81,700 |
89,000 |
7.7 |
8.9 |
||
|
(2.3) |
(2.3) |
||||||
|
iii) |
Subsidies |
46,874 |
46,213 |
7.4 |
-1.4 |
||
|
(1.3) |
(1.2) |
||||||
|
3. |
Plan Expenditure |
1,43,791 |
1,72,728 |
8.7 |
20.1 |
||
|
(4.1) |
(4.4) |
||||||
|
4. |
Revenue Expenditure |
4,40,295 |
4,88,192 |
14.6 |
10.9 |
||
|
(12.5) |
(12.4) |
||||||
|
5. |
Capital Expenditure |
68,410 |
75,799 |
-39.6 |
10.8 |
||
|
(1.9) |
(1.9) |
[-15.2] |
|||||
|
6. |
Revenue Deficit |
91,821 |
84,727 |
17.2 |
-7.7 |
||
|
(2.6) |
(2.1) |
||||||
|
7. |
Gross Fiscal Deficit |
1,46,175 |
1,48,686 |
16.8 |
1.7 |
||
|
(4.1) |
(3.8) |
||||||
|
8. |
Gross Primary Deficit |
16,143 |
8,863 |
||||
|
(0.5) |
(0.2) |
||||||
|
Note :1.Figures
in ( ) in columns 2 and 3 are percentages to GDP. |
|||||||
|
Table 19: Gross Tax Revenues of the Centre |
|||
|
(Per cent to GDP) |
|||
|
Year |
Direct Tax |
Indirect Tax |
Total |
|
1 |
2 |
3 |
4 |
|
1990-91 |
1.9 |
8.2 |
10.1 |
|
1991-92 |
2.3 |
8.0 |
10.3 |
|
1992-93 |
2.4 |
7.5 |
10.0 |
|
1993-94 |
2.4 |
6.5 |
8.8 |
|
1994-95 |
2.7 |
6.5 |
9.1 |
|
1995-96 |
2.8 |
6.5 |
9.4 |
|
1996-97 |
2.8 |
6.6 |
9.4 |
|
1997-98 |
3.2 |
6.0 |
9.1 |
|
1998-99 |
2.7 |
5.6 |
8.3 |
|
1999-2000 |
3.0 |
5.8 |
8.8 |
|
2000-01 |
3.2 |
5.7 |
8.9 |
|
2001-02 |
3.0 |
5.2 |
8.2 |
|
2002-03 |
3.4 |
5.4 |
8.8 |
|
2003-04 |
3.8 |
5.4 |
9.2 |
|
2004-05 |
4.3 |
5.5 |
9.8 |
|
2005-06 (RE) |
4.8 |
5.7 |
10.5 |
|
2006-07 (BE) |
5.3 |
5.9 |
11.2 |
|
RE : Revised Estimates. BE : Budget Estimates. |
|||
the budget estimates is the deceleration in revenue expenditure, both non-Plan and Plan components. The total capital expenditure is budgeted to increase by 10.8 per cent in 2006-07 as against a reduction of 39.6 per cent (15.2 per cent over its level adjusted for repayments to National Small Savings Fund in 2004-05) in 2005-06.
During 2006-07, net market borrowings (dated securities and 364-day Treasury Bills) are budgeted to increase from Rs.1,01,082 crore in 2005-06 (RE) to Rs.1,13,778 crore. Inclusive of repayments of Rs.65,939 crore, gross market borrowings are placed at Rs.1,79,716 crore. Net market borrowings would finance 76.5 per cent of the GFD in 2006-07 as compared with 69.2 per cent in the revised estimates for 2005-06. Deposits and advances would finance 7.4 per cent of GFD in 2006-07 as compared with 3.2 per cent in the revised estimates for 2005-06. Financing pattern from other sources would broadly remain similar during 2006-07.
Page Last Updated on:


