IV.1 Monetary and liquidity aggregates that expanded at a strong pace during the first half of 2008-09 showed some moderation during the third quarter reflecting the decline in capital flows and consequent foreign exchange intervention by the Reserve Bank. Decline in net foreign exchange assets with the Reserve Bank during 2008-09 so far has also resulted in the moderation of expansion of base money. Expansion in bank credit to the commercial sector during 2008-09 so far has remained high. In response to the unfolding global financial market turmoil and its knock-on effect on the domestic financial market, and downturn in headline inflation, the Reserve Bank has taken a number of measures of monetary easing since mid-September 2008. The aim of these measures was to augment domestic and foreign exchange liquidity and to enable banks to continue to lend for productive purposes while maintaining credit quality so as to sustain the growth momentum.
Monetary Survey
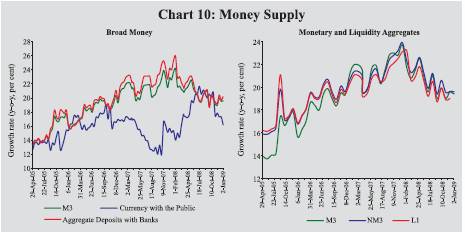
IV.2 Broad money (M3) growth, on a year-on-year (y-o-y) basis, was placed at 19.6 per cent as on January 2, 2009, which was lower than 22.6 per cent a year ago, reflecting moderation in expansion in time deposits. Expansion in the residency-based new monetary aggregate (NM3) - which does not directly reckon non-resident foreign currency deposits such as FCNR(B) deposits – was lower at 19.4 per cent as on January 2, 2009 than 22.7 per cent a year ago. Similarly growth in liquidity aggregate, L1, at end-December 2008 was lower at 19.0 per cent than 22.5 per cent a year ago (Table 29 and Chart 10).
IV.3 Deterioration in global financial conditions since September 2008 resulted in drying up of capital inflows. In response to the consequent pressure on the domestic money and foreign exchange markets, the Reserve Bank augmented rupee and dollar liquidity and strengthened the credit delivery mechanisms for sustaining the growth momentum. Accordingly, inter alia, the cash reserve ratio (CRR) has been reduced by a cumulative 4.0 percentage points to 5.0 per cent of net demand and time liabilities (NDTL) since October 11, 2008. This measure released primary liquidity into the system of the order of Rs.1,60,000 crore. The statutory liquidity ratio (SLR) was reduced by one percentage point, from 25 per cent of NDTL to 24 per cent along with relaxation in the SLR maintenance for term repo facility by 1.5 per cent of NDTL. A special refinance facility was also introduced for SCBs (excluding regional rural banks) with the limit of 1.0 per cent of each bank’s NDTL as on October 24, 2008 at the LAF repo rate up to a maximum period of 90 days (with flexibility to draw and repay during this period). This facility would be available till June 30, 2009. In addition, since October 2008, the Reserve Bank has reduced the repo rate from 9.0 per cent to 5.5 per cent and the reverse repo rate from 6.0 per cent to 4.0 per cent.
Table 29: Monetary Indicators |
(Amount in Rupees crore) |
Item |
Outstanding as on |
Variation (year-on-year) |
|
January 2, 2009 |
January 4, 2008 |
March 31, 2008 |
January 2, 2009 |
|
|
Absolute |
Per cent |
Absolute |
Per cent |
Absolute |
Per cent |
1 |
2 |
3 |
4 |
5 |
6 |
7 |
8 |
I. Reserve Money* |
8,93,565 |
1,96,524 |
30.6 |
2,19,427 |
30.9 |
55,361 |
6.6 |
(Adjusted Reserve Money Growth#*) |
|
|
(21.6) |
|
(25.3) |
|
(18.0) |
II. Narrow Money (M1) |
11,35,057 |
1,32,896 |
15.1 |
1,84,864 |
19.1 |
1,23,307 |
12.2 |
III. Broad Money (M3) |
44,91,953 |
6,91,768 |
22.6 |
6,90,629 |
20.8 |
7,36,777 |
19.6 |
a) Currency with the Public |
6,21,997 |
70,242 |
15.1 |
84,571 |
17.5 |
86,809 |
16.2 |
b) Aggregate Deposits |
38,64,229 |
6,21,944 |
24.0 |
6,04,485 |
21.4 |
6,49,152 |
20.2 |
i) Demand Deposits |
5,07,333 |
63,072 |
15.4 |
98,721 |
20.8 |
35,682 |
7.6 |
ii) Time Deposits |
33,56,896 |
5,58,872 |
25.6 |
5,05,765 |
21.5 |
6,13,470 |
22.4 |
of which: |
|
|
|
|
|
|
|
Non-Resident Foreign Currency Deposits |
63,417 |
-8,090 |
-12.3 |
-10,525 |
-15.6 |
5,756 |
10.0 |
IV. NM3 |
45,04,294 |
6,98,726 |
22.7 |
7,08,101 |
21.3 |
7,33,329 |
19.4 |
of which: Call Term Funding from FIs |
1,05,212 |
8994 |
10.7 |
20,668 |
24.1 |
12,356 |
13.3 |
V. a) L1 |
45,70,251 |
7,04,333 |
22.5 |
707403 |
20.6 |
7,29,894 |
19.0 |
of which: Postal Deposits |
1,15,157 |
2,536 |
2.2 |
-698 |
-0.6 |
-1,744 |
-1.5 |
b) L2 |
45,73,183 |
7,04,333 |
22.4 |
707403 |
20.5 |
7,29,894 |
19.0 |
c) L3 |
45,97,830 |
7,04,380 |
22.3 |
708236 |
20.4 |
7,29,871 |
18.9 |
VI. Major Sources of Broad Money |
|
|
|
|
|
|
|
a) Net Bank Credit to the Government (i+ii) |
11,38,992 |
52,233 |
6.5 |
72,842 |
8.7 |
2,79,785 |
32.6 |
i) Net Reserve Bank Credit to Government |
-56,450 |
-1,49,280 |
– |
-1,15,632 |
– |
93,142 |
– |
of which: to the Centre |
-56,468 |
-1,49,358 |
– |
-1,16,772 |
– |
93,810 |
– |
ii) Other Banks’ Credit to Government |
11,95,442 |
2,01,513 |
25.0 |
1,88,474 |
22.7 |
1,86,643 |
18.5 |
b) Bank Credit to the Commercial Sector |
28,86,004 |
3,91,183 |
20.0 |
4,39,834 |
20.6 |
5,34,658 |
22.7 |
c) Net Foreign Exchange Assets of the Banking Sector |
12,62,039 |
2,70,786 |
32.1 |
3,81,952 |
41.8 |
1,47,297 |
13.2 |
d) Government Currency Liability to Public |
9,787 |
838 |
10.3 |
1,064 |
12.9 |
795 |
8.8 |
e) Net Non-Monetary Liabilities of |
|
|
|
|
|
|
|
the Banking Sector |
8,04,870 |
23,273 |
4.2 |
2,05,063 |
36.0 |
2,25,758 |
39.0 |
Memo: |
|
|
|
|
|
|
|
Aggregate Deposits of SCBs |
36,18,763 |
5,98,499 |
25.1 |
5,85,006 |
22.4 |
6,32,817 |
21.2 |
Non-food Credit of SCBs |
26,04,379 |
3,79,655 |
22.0 |
4,32,846 |
23.0 |
5,01,645 |
23.9 |
*: Data pertain to January 16, 2009.
# : Adjusted for changes in cash reserve ratio (CRR) of banks.
SCBs : Scheduled Commercial Banks. FIs: Financial Institutions. NBFCs: Non-Banking Financial Companies.
are liquidity aggregates compiled on the recommendations of the
NM3 is the residency-based money aggregate and L1 L2 and L3. Working Group on Money Supply
(Chairman: Dr. Y.V. Reddy, 1998). + Select deposits with the post office saving banks.
L1 = NM3 +Term deposits with term lending institutions and refinancing institutions + Term borrowing
by FIs + Certificates of deposit L2 = L1 issued by FIs. + Public deposits of NBFCs.
L3 = L2
Note :
1. Data are provisional. Wherever data are not available, the data for last available month is repeated as estimates.
2. Data on postal deposits pertain to November 2008. |
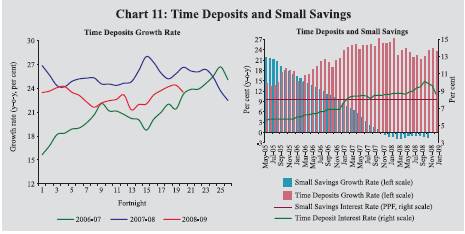
IV.4 The growth in broad money (M3) mainly reflected a continued strong increase in time deposits during 2008-09 so far although with some moderations. Growth in time deposits (y-o-y) as on January 2, 2009 was 22.4 per cent as compared with 25.6 per cent a year ago. This could be attributed, inter alia, to higher interest rates on bank deposits relative to postal deposits and extension of tax benefits under Section 80C for bank deposits. During 2007-08, accretion to postal deposits decelerated significantly up to November 2007 and beginning December 2007, there were net outflows from small savings schemes. This trend continued up to November 2008, the latest period for which data are available (Chart 11). Currency with the public that grew by 16.2 per cent (y-o-y) as on January 2, 2009 as compared with 15.1 per cent a year ago was the other major component in the expansion of broad money.
IV.5 On a financial year basis, growth in during 2008-09 (up to January 2, M3 2009) was 12.1 per cent as compared with 13.2 per cent during the corresponding period of the previous year (Table 30).
Table 30: Monetary Aggregates – Variations |
(Rupees crore) |
Item |
2007-08 |
2008-09 |
2007-08 |
2008-09 |
|
(up to |
(up to |
|
|
|
|
|
|
|
|
Jan 4) |
Jan 2) |
Q1 |
Q2 |
Q3 |
Q4 |
Q1 |
Q2 |
Q3 |
1 |
|
2 |
3 |
4 |
5 |
6 |
7 |
8 |
9 |
10 |
M3 |
(1+2+3 = 4+5+6+7-8) |
4,39,083 |
4,85,231 |
73,824 |
1,99,008 |
1,16,440 |
3,01,356 |
87,696 |
1,72,939 |
1,62,910 |
|
|
(13.2) |
(12.1) |
|
|
|
|
|
|
|
1. |
Currency with the Public |
52,283 |
54,521 |
18,237 |
-14,856 |
47,723 |
33,466 |
36,300 |
-17,570 |
40,349 |
|
|
(10.8) |
(9.6) |
|
|
|
|
|
|
|
2. |
Aggregates Deposits with Banks |
3,89,387 |
4,34,053 |
56,023 |
2,15,344 |
69,536 |
2,63,583 |
55,521 |
1,89,993 |
1,15,464 |
|
|
(13.8) |
(12.7) |
|
|
|
|
|
|
|
|
2.1 Demand Deposits with Banks |
-4,036 |
-67,075 |
-44,030 |
58,180 |
-7,275 |
91,847 |
-79,771 |
52,275 |
-59,531 |
|
|
(-0.8) |
(-11.7) |
|
|
|
|
|
|
|
|
2.2 Time Deposits with Banks |
3,93,422 |
5,01,127 |
1,00,053 |
1,57,164 |
76,811 |
1,71,736 |
1,35,292 |
1,37,718 |
1,74,994 |
|
|
(16.7) |
(17.5) |
|
|
|
|
|
|
|
3. |
‘Other’ Deposits with Banks |
-2,586 |
-3,343 |
-436 |
-1,479 |
-819 |
4,307 |
-4,125 |
516 |
7,097 |
|
|
(-34.5) |
(-36.9) |
|
|
|
|
|
|
|
4. |
Net Bank Credit to Government |
24,973 |
2,31,915 |
28,117 |
15,618 |
-36,493 |
65,601 |
35,676 |
29,511 |
1,27,500 |
|
|
(3.0) |
(25.6) |
|
|
|
|
|
|
|
|
4.1 RBI’s Net Credit to Government |
-1,52,015 |
56,759 |
-22,154 |
-54,695 |
-65,787 |
27,004 |
-13 |
51,360 |
30,230 |
|
4.1.1 RBI’s Net credit to the Centre |
-1,52,413 |
58,169 |
-21,825 |
-55,588 |
-65,078 |
25,719 |
1,430 |
51,379 |
29,932 |
|
4.2 Other Banks’ Credit to Government |
1,76,987 |
1,75,156 |
50,270 |
70,313 |
29,294 |
38,597 |
35,689 |
-21,850 |
97,270 |
5. |
Bank Credit to the Commercial Sector |
2,21,269 |
3,16,092 |
-30,547 |
1,45,442 |
86,877 |
2,38,062 |
36,541 |
1,61,505 |
1,00,668 |
|
|
(10.4) |
(12.3) |
|
|
|
|
|
|
|
6. |
NFEA of Banking Sector |
2,01,563 |
-33,092 |
-17,945 |
1,18,249 |
94,204 |
1,87,444 |
66,858 |
7,271 |
-1,56,330 |
|
6.1 NFEA of the RBI |
2,18,422 |
7047 |
-2,745 |
1,19,430 |
94,681 |
1,58,610 |
1,03,932 |
10,336 |
-1,56,330 |
7. |
Government’s Currency Liabilities |
732 |
463 |
166 |
254 |
312 |
332 |
125 |
206 |
132 |
|
to the Public |
|
|
|
|
|
|
|
|
|
8. |
Net Non-Monetary Liabilities of the |
9,452 |
30,147 |
-94,033 |
80,553 |
28,461 |
1,90,082 |
51,503 |
25,554 |
-90,940 |
|
Banking Sector |
|
|
|
|
|
|
|
|
|
|
Memo: |
|
|
|
|
|
|
|
|
|
1. |
Non-resident Foreign Currency |
|
|
|
|
|
|
|
|
|
|
Deposits with SCBs |
-9,800 |
6,482 |
-4,202 |
-1,181 |
-3,490 |
-1,653 |
2,048 |
3,898 |
-2,536 |
2. |
SCB’ Call-term Borrowing from |
|
|
|
|
|
|
|
|
|
|
Financial Institutions |
7,021 |
-1,292 |
-2,984 |
5,756 |
7,441 |
10,455 |
-1,116 |
7,015 |
-591 |
3. |
Overseas Borrowing by SCBs |
1,940 |
5,801 |
-6,928 |
7,830 |
1,734 |
9,909 |
9,494 |
4,600 |
-5,185 |
SCBs: Scheduled Commercial Banks.
NFEA: Net Foreign Exchange Assets.
Note : 1. Data are provisional.
2. Figures in parentheses are percentage variations. |
IV.6 On the sources side, bank credit to commercial sector remained the driver of broad money (M3) while expansion in net foreign exchange assets of the banking sector moderated to a large extent. Bank credit to the commercial sector increased by 22.7 per cent (y-o-y) as on January 2, 2009 as compared with 20.0 per cent a year ago. Non-food credit growth (y-o-y) of scheduled commercial banks (SCBs) picked up during 2008-09, on the backdrop of sizeable rise in credit to petroleum sector due to the funding requirements of oil companies and substitution of funds raised by corporates from non-banking to banking sources. It peaked during October-November 2008 but moderated somewhat thereafter. Non-food credit by SCBs expanded by 23.9 per cent, y-o-y, as on January 2, 2009, which was higher than 22.0 per cent a year ago. The higher expansion in credit relative to the expansion in deposit resulted in an increase in the incremental credit-deposit ratio (y-o-y) of SCBs to 81.4 per cent as on January 2, 2009 from 63.1 per cent a year ago (Chart 12). Net foreign exchange assets of the banking sector expanded by 13.2 per cent (y-o-y) as on January 2, 2009 much lower than 32.1 per cent a year ago.
IV.7 Credit flow from scheduled commercial banks recorded a high growth of 24.0 per cent (y-o-y) as on January 2, 2009 as compared with 21.4 per cent a year ago. The expansion in credit during 2008-09 so far was mainly on account of public sector banks, while credit growth decelerated in respect of private and foreign banks (Table 31).
IV.8 Disaggregated data on sectoral deployment of gross bank credit available up to December 19, 2008 showed that about 48.2 per cent of incremental non-food credit (y-o-y) was absorbed by industry as compared with 44.0 per cent in the corresponding period of the previous year. The expansion of incremental non-food credit to industry during this period was led by infrastructure, petroleum, iron & steel, chemicals & chemical products, textiles, engineering, construction and vehicles industries. The infrastructure sector alone accounted for 28.0 per cent of the incremental credit to industry as compared with 29.7 per cent in the corresponding period of the previous year. Credit to petroleum and fertiliser industries grew by 101.8 per cent (y-o-y) by December 2008 as compared with a growth of 11.8 per cent in the corresponding period of the previous year. Also, the share of incremental credit to petroleum and fertiliser industries increased to 19.9 per cent of the total incremental non-food credit in December 2008 from 3.1 per cent a year ago. The total non-food credit excluding credit to petroleum and fertiliser industries also recorded a high growth of 22.9 per cent as compared with 22.1 per cent in the previous year. The agricultural sector absorbed around 10.9 per cent of the incremental non-food bank credit expansion as compared with 10.7 per cent in the corresponding period of the previous year. Personal loans accounted for nearly 14.7 per cent of incremental non-food credit; within personal loans, the share of incremental housing loans was at 30.4 per cent. The outstanding credit under credit card receivables witnessed a sharp increase. Growth in loans to commercial real estate remained high in recent months (Table 32). In order to facilitate bank lending, several counter-cyclical measures taken earlier were reviewed in view of the prevailing macroeconomic, monetary and credit conditions, and measures were announced on November 15, 2008 to strengthen credit delivery while maintaining credit quality. Accordingly, the provisioning requirements for all types of standard assets (except in case of direct advances to agricultural and SME sector which was retained at 0.25 per cent, as hitherto) and risk weights on banks’ exposures to certain sectors were revised downwards.
IV.9 Apart from banks, commercial sector mobilises resources from a variety of other sources such as issuances through capital markets, commercial paper, non-banking financial companies (NBFCs), financial institutions, external commercial borrowings, issuances of American Depository Receipts (ADRs)/ Global Depository Receipts (GDRs) and foreign direct investment. During 2008-09, so far, flow of resources from other sources to the commercial sector declined reflecting subdued conditions in the domestic capital markets and deceleration of funds flow from external sources. On the other hand, increase in bank credit during 2008-09, so far, has been significantly higher, partly reflecting increased credit demand of corporates emanating from deceleration in credit flow from other sources. Overall, total flow of resources to the commercial sector during 2008-09, so far, has been somewhat lower than that in the comparable period of 2007-08 (Table 33).
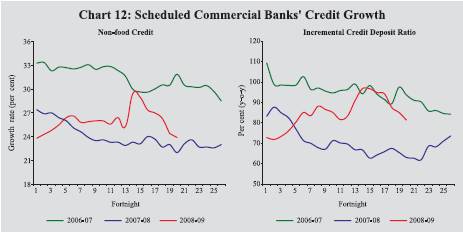
Table 31: Credit Flow from Scheduled Commercial Banks |
(Amount in Rupees crore) |
Item |
Outstanding as on
January 2, 2009 |
Variation (year-on-year) |
|
|
As on |
Jan. 4, 2008 |
As on Jan. 2, 2009 |
|
|
Amount |
Per cent |
Amount |
Per cent |
1 |
2 |
3 |
4 |
5 |
6 |
1. Public Sector Banks |
19,23,953 |
2,47,633 |
19.8 |
4,28,302 |
28.6 |
2. Foreign Banks |
1,73,451 |
34,834 |
30.7 |
25,016 |
16.9 |
3. Private Banks |
4,98,107 |
86,731 |
24.2 |
52,375 |
11.8 |
4. All Scheduled Commercial Banks* |
26,58,997 |
3,77,855 |
21.4 |
5,14,980 |
24.0 |
* : Includes Regional Rural Banks.
Note: Data are provisional. |
Table 32: Non-food Bank Credit - Sectoral Deployment |
(Amount in Rupees crore) |
Sector/Industry |
Outstanding
as on
December
19,19, 2008 |
Year-on-Year Variations |
|
|
December 21, 2007 |
December 19, 2008 |
|
|
Absolute |
Per cent |
Absolute |
Per cent |
1 |
2 |
3 |
4 |
5 |
6 |
Non-food Gross Bank Credit (1 to 4) |
24,70,164 |
3,54,802 |
21.8 |
4,90,199 |
24.8 |
1. Agriculture and Allied Activities |
2,89,501 |
38,139 |
19.3 |
53,612 |
22.7 |
2. Industry (Small, Medium and Large) |
10,18,564 |
1,56,192 |
24.9 |
2,36,064 |
30.2 |
Small Enterprises |
1,46,833 |
35,916 |
35.6 |
10,156 |
7.4 |
3. Personal Loans |
5,68,474 |
68,079 |
15.9 |
72,245 |
14.6 |
Housing |
2,71,683 |
31,780 |
14.6 |
21,989 |
8.8 |
Advances against Fixed Deposits |
50,055 |
4,605 |
12.8 |
9,563 |
23.6 |
Credit Cards |
29,359 |
5,393 |
45.3 |
12,053 |
69.6 |
Education |
26,760 |
6,123 |
45.7 |
7,233 |
37.0 |
Consumer Durables |
9,122 |
508 |
5.9 |
50 |
0.6 |
4. Services |
5,93,625 |
92,389 |
24.8 |
1,28,278 |
27.6 |
Transport Operators |
38,145 |
6,725 |
29.9 |
8,941 |
30.6 |
Professional & Other Services |
40,653 |
6,682 |
34.3 |
14,518 |
55.6 |
Trade |
1,40,142 |
17,713 |
17.8 |
23,057 |
19.7 |
Real Estate Loans |
76,463 |
13,621 |
35.8 |
24,827 |
48.1 |
Non-Banking Financial Companies |
86,120 |
22,953 |
59.6 |
24668 |
40.1 |
Memo: |
|
|
|
|
|
Priority Sector |
7,64,060 |
1,10,768 |
19.6 |
87,910 |
13.0 |
Industry (Small, Medium and Large) |
10,18,564 |
1,56,192 |
24.9 |
2,36,064 |
30.2 |
Food Processing |
52,661 |
10,399 |
30.2 |
7,880 |
17.6 |
Textiles |
1,02,009 |
16,644 |
24.0 |
15,888 |
18.4 |
Paper & Paper Products |
15,752 |
2,419 |
23.9 |
3,191 |
25.4 |
Petroleum, Coal Products & Nuclear Fuels |
79,681 |
5,821 |
18.6 |
42,542 |
114.5 |
Chemicals and Chemical Products |
74,694 |
7,039 |
13.7 |
16,346 |
28.0 |
Rubber, Plastic & their Products |
12,767 |
1,508 |
18.8 |
3,241 |
34.0 |
Iron and Steel |
96,832 |
18,723 |
31.8 |
19,179 |
24.7 |
Other Metal & Metal Products |
29,070 |
1,826 |
9.3 |
7,507 |
34.8 |
Engineering |
63,705 |
11,161 |
29.0 |
14,052 |
28.3 |
Vehicles, Vehicle Parts and Transport
Equipments |
35,794 |
7,622 |
37.6 |
7,897 |
28.3 |
Gems & Jewellery |
28,131 |
3,101 |
14.2 |
3,234 |
13.0 |
Construction |
34,901 |
6,037 |
37.3 |
12,671 |
57.0 |
Infrastructure |
2,37,236 |
46,345 |
37.1 |
65,987 |
38.5 |
Note: 1. Data are provisional and relate to select scheduled commercial banks.
2. Data also include the figures of Bharat Overseas Bank which was merged with Indian Overseas Bank, American
Express Bank with Standard Chartered Bank and State Bank of Saurashtra with State Bank of India. |
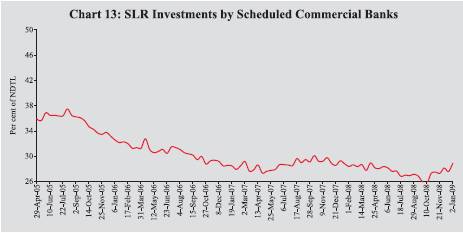
IV.10 Scheduled commercial banks’ investment in SLR securities expanded by 19.2 per cent (y-o-y) on January 2, 2009 as compared with 25.8 per cent a year ago (Table 34). Commercial banks’ holdings of such securities as on January 2, 2009 at 28.9 per cent of their net demand and time liabilities (NDTL) were higher than 27.8 per cent at end-March 2008 but lower than 29.3 per cent a year ago (Chart 13). Excess SLR investments of SCBs increased to Rs.1,95,112 crore as on January 2, 2009 from Rs. 98,033 crore at end-March 2008; excess investments in SLR securities were placed at Rs.1,41,684 crore a year ago. Adjusted for LAF collateral securities on an outstanding basis, SCB’s holding of SLR securities amounted to Rs.10,74,924 crore or 27.1 per cent of NDTL on January 2, 2009 implying an excess of Rs.1,21,792 crore or 3.1 per cent of NDTL over the prescribed SLR of 24 per cent of NDTL.
Table 33: Flow of Resources to the Commercial Sector |
(Rupees crore) |
|
2007-08(Comparable
period) |
2008-09(So far) |
1 |
2 |
3 |
A. |
Adjusted non-food Bank Credit by Commercial Banks (1+2) @ |
2,24,921 |
2,93,243 |
|
1. |
Non-Food Credit |
2,18,065 |
2,86,864 |
|
2. |
Non-SLR Investment by SCBs |
6,856 |
6,379 |
B. |
Flow from Other Major Sources (B1+B2) |
2,74,563 |
1,91,470 |
|
B1.Domestic Sources |
1,25,893 |
93,348 |
|
|
1. |
Public issues by non-financial entities # |
34,413 |
13,559 |
|
|
2. |
Gross private placements by non-financial entities * |
32,306 |
39,113 |
|
|
3. |
Net Issuance of CPs subscribed to by non-banks # |
31,351 |
20,004 |
|
|
4. |
Net Credit by housing finance companies * |
8,693 |
16,438 |
|
|
5. |
Total gross accommodation by all-India Financial Institutions - |
|
|
|
|
|
NABARD, NHB, SIDBI & EXIM Bank * |
-1,174 |
7,246 |
|
|
6. |
Systemically Important non-deposit taking NBFCs net of bank credit * |
20,304 |
-3,012 |
|
B2. Foreign Sources |
1,48,670 |
98,122 |
|
|
1 |
External Commercial Borrowings / FCCB ** |
63,008 |
27,588 |
|
|
2 |
ADR/GDR Issues (excluding by banks and financial institutions) # |
24,972 |
4,687 |
|
|
3 |
Short-term Credit from abroad ** |
41,565 |
12,252 |
|
|
4 |
Foreign Direct Investment to India ** |
19,125 |
53,595 |
C. |
Total Credit (A+B) |
4,99,484 |
4,84,713 |
@ : Up to early January. # : Up to December. * : Up to September. ** : Up to November.
Note:
Data are shown for latest information available for various items during 2008-09, so
far, and for the corresponding period of 2007-08. |
Table 34: Scheduled Commercial Bank Survey |
(Amount in Rupees crore) |
Item |
Outstanding as on
January 2, 2009 |
Variation (year-on-year) |
|
|
As on Jan. 4, 2008 |
As on Jan. 2, 2009 |
|
|
Amount |
Per cent |
Amount |
Per cent |
1 |
2 |
3 |
4 |
5 |
6 |
Sources of Funds |
|
|
|
|
|
1. Aggregate Deposits |
36,18,763 |
5,98,499 |
25.1 |
6,32,817 |
21.2 |
2. Call/Term Funding from Financial Institutions |
1,05,212 |
8,994 |
10.7 |
12,356 |
13.3 |
3. Overseas Foreign Currency Borrowings |
50251 |
8,098 |
31.5 |
16,407 |
48.5 |
4. Capital |
46,303 |
6,513 |
20.1 |
7,324 |
18.8 |
5. Reserves |
2,77,247 |
57,615 |
34.7 |
53,693 |
24.0 |
Uses of Funds |
|
|
|
|
|
1. Bank Credit |
26,58,997 |
3,77,855 |
21.4 |
5,14,980 |
24.0 |
of which: Non-food Credit |
26,04,379 |
3,79,655 |
22.0 |
5,01,645 |
23.9 |
2. Investments in Government and Other Approved
Securities |
11,48,244 |
1,97,511 |
25.8 |
1,85,192 |
19.2 |
a) Investments in Government Securities |
11,30,517 |
1,99,750 |
26.6 |
1,80,713 |
19.0 |
b) Investments in Other Approved Securities* |
17,726 |
-2,238 |
-14.5 |
4,479 |
33.8 |
3. Investments in non-SLR Securities |
1,98,278 |
35,776 |
25.9 |
24,376 |
14.0 |
4. Foreign Currency Assets |
37,280 |
-18,937 |
-36.8 |
4738 |
14.6 |
5. Balances with the RBI |
1,97,861 |
99,241 |
76.1 |
-31,721 |
-13.8 |
* : Refer to investment in SLR securities as notified in the Reserve Bank notification DBOD No. Ref. BC. 61/12.02.001/
2007-08 dated February 13, 2008.
Note: Data are provisional. |
Reserve Money Survey
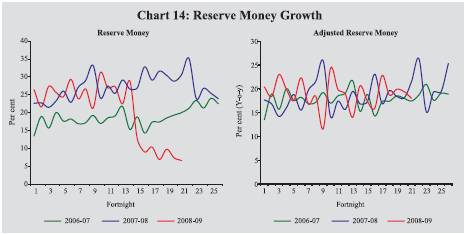
IV.11 Reserve money growth at 6.6 per cent, y-o-y, as on January 16, 2009 was lower than that of 30.6 per cent a year ago. Intra-year movements in reserve money largely reflected the Reserve Bank’s market operations and movements in bankers’ deposits with the Reserve Bank in the wake of changes in the CRR and large expansion in demand and time liabilities. In the wake of inflationary pressures during the first half of 2008-09, monetary policy was tightened, partly reflected in the hike of CRR by 150 basis points to 9.0 per cent during April-August 2008-09. Subsequently, intensification of global financial turmoil and its knock-on impact on the domestic financial market, and downturn in headline inflation, necessitated the Reserve Bank to ease its monetary policy since mid-September 2008. The CRR was reduced by 400 basis points to 5.0 per cent since October 11, 2008. Adjusted for the first round effect of the changes in CRR, reserve money growth (y-o-y) as on January 16, 2009 was 18.0 per cent as compared with 21.6 per cent a year ago (Chart 14).
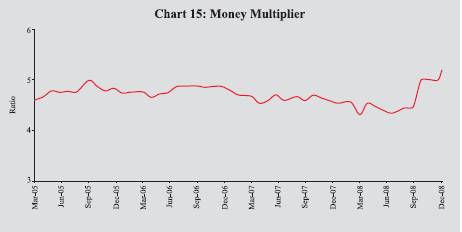
IV.12 The changes in CRR have also affected the money multiplier, i.e., the ratio between broad money and reserve money. Accordingly, the money multiplier, which had declined from 4.7 at end-March 2007 to 4.3 at end-March 2008 in the wake of CRR hikes, increased to 5.2 as on January 2, 2009, reflecting subsequent lowering of CRR (Chart 15).
IV.13 During the financial year 2008-09 (up to January 16, 2009), reserve money decreased by 3.8 per cent as against an increase of 18.2 per cent in the corresponding period of the previous year (Table 35). On the sources side, net Reserve Bank’s credit to the Centre increased by Rs. 86,141 crore as against a decrease of Rs. 1,57,815 crore during the corresponding period of the previous year. The Reserve Bank’s foreign currency assets (adjusted for revaluation) declined by Rs.99,701 crore as against an increase of Rs.3,11,941 crore during the corresponding period of the previous year (Chart 16). Adjusted for the first round impact of the changes in CRR (up to January 16, 2009), reserve money expanded by 5.6 per cent as compared with 12.1 per cent during the corresponding period f the previous year.
IV.14 Movements in the Reserve Bank’s net credit to the Central Government during 2008-09, so far, (up to January 16, 2009) largely reflected the liquidity management operations by the Reserve Bank and changes in Central Government deposits with the Reserve Bank. The Centre’s surplus cash balances with the Reserve Bank declined (Rs.76,586 crore). Furthermore, the Centre resorted to WMA/ OD facilities (Rs.9,263 crore). The unwinding of MSS securities led to a decline in Central Government deposits (Rs.54,742 crore) with the Reserve Bank and, therefore further increased net Reserve Bank credit to Centre. Net open market purchases under OMO/special market operations (SMO) led to higher holding of Central Government securities/ bonds (Rs. 33,521 crore) by the Reserve Bank. In view of the global financial crisis and its possible impact on Indian financial market, the Reserve Bank has taken various measures to augment rupee and dollar liquidity. Consequently, liquidity condition that remained tight during the first half of 2008-09, eased from mid-November 2008 and LAF, on average, shifted to absorption mode. The Reserve Bank’s holding of government securities (up to January 16, 2009) declined on account of an increase in absorption under LAF (Rs.82,145 crore). Reflecting these developments, the Reserve Bank’s net credit to the Centre increased during 2008-09 so far (up to January 16, 2009) as against a decline during the corresponding period of the previous year.
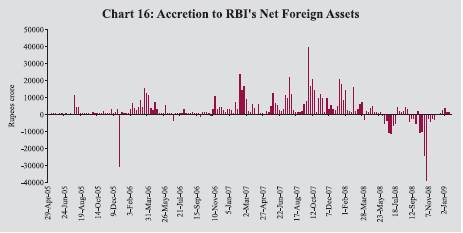
Table 35: Reserve Money - Variations |
(Amount in Rupees crore) |
Item |
2007-08 |
2007-08 |
2008-09 |
2007-08 |
2008-09 |
|
(April- |
(Up to |
(Up to |
|
|
|
|
|
|
|
|
March) |
Jan 18) |
Jan 16) |
Q1 |
Q2 |
Q3 |
Q4 |
Q1 |
Q2 |
Q3 |
1 |
2 |
3 |
4 |
5 |
6 |
7 |
8 |
9 |
10 |
11 |
Reserve Money |
2,19,427 |
1,29,213 |
-34,852 |
11,630 |
60,587 |
26,593 |
1,20,617 |
3,301 |
25,220 |
-70,453 |
|
(30.9) |
(18.2) |
(-3.8) |
|
|
|
|
|
|
|
Components (1+2+3) |
|
|
|
|
|
|
|
|
|
|
1. Currency in Circulation |
86,702 |
62,190 |
71,952 |
16,866 |
-13,397 |
46,781 |
36,452 |
36,759 |
-14,516 |
38,223 |
|
(17.2) |
(12.3) |
(12.2) |
|
|
|
|
|
|
|
2. Bankers’ Deposits with RBI |
1,31,152 |
69,760 |
-1,03,028 |
-4,800 |
75,464 |
-19,369 |
79,857 |
-29,333 |
39,219 |
-1,15,773 |
|
(66.5) |
(35.4) |
(-31.4) |
|
|
|
|
|
|
|
3. ‘Other’ Deposits with the RBI |
1,573 |
-2,736 |
-3,777 |
-436 |
-1,479 |
-819 |
4,307 |
-4,125 |
516 |
7,097 |
|
(21.0) |
(-36.5) |
(-41.6) |
|
|
|
|
|
|
|
Sources (1+2+3+4-5) |
|
|
|
|
|
|
|
|
|
|
1. RBI’s net credit to Government |
-1,15,632 |
-1,58,302 |
85,072 |
-22,154 |
-54,695 |
-65,787 |
27,004 |
-13 |
51,360 |
30,230 |
of which: to Centre (i+ii+iii+iv-v) |
-1,16,772 |
-1,57,815 |
86,141 |
-21,825 |
-55,588 |
-65,078 |
25,719 |
1,430 |
51,379 |
29,932 |
i. Loans and Advances |
0 |
0 |
9,263 |
0 |
0 |
0 |
0 |
0 |
0 |
0 |
ii. Treasury Bills held by the RBI |
0 |
0 |
0 |
0 |
0 |
0 |
0 |
0 |
0 |
0 |
iii. RBI’s Holdings of Dated Securities |
17,421 |
-52,149 |
-38,676 |
-34,284 |
4,019 |
20,874 |
26,812 |
-39,239 |
56,975 |
-44,206 |
iv. RBI’s Holdings of Rupee Coins |
121 |
94 |
-56 |
128 |
20 |
3 |
-31 |
-1 |
-26 |
27 |
v. Central Government Deposits |
1,34,314 |
1,05,759 |
-1,15,611 |
-12,330 |
59,627 |
85,956 |
1,062 |
-40,670 |
5,570 |
-74,111 |
2. RBI’s Credit to Banks and |
|
|
|
|
|
|
|
|
|
|
Commercial Sector |
-2,794 |
-3,282 |
5,557 |
-6,450 |
-1,256 |
848 |
4,064 |
-3,358 |
4,963 |
5,032 |
3. NFEA of RBI |
3,69,977 |
2,51,026 |
-10,670 |
-2,745 |
1,19,430 |
94,681 |
1,58,610 |
1,03,932 |
10,336 |
-1,56,330 |
|
(42.7) |
( 29.0) |
(-0.9) |
|
|
|
|
|
|
|
of which : |
|
|
|
|
|
|
|
|
|
|
FCA, adjusted for revaluation |
3,70,550 |
3,11,941 |
-99,701 |
47,728 |
1,18,074 |
1,00,888 |
1,03,860 |
15,535 |
-31,641 |
-92,102 |
4. Governments’ Currency Liabilities |
|
|
|
|
|
|
|
|
|
|
to the Public |
1,064 |
790 |
463 |
166 |
254 |
312 |
332 |
125 |
206 |
132 |
5. Net Non-Monetary liabilities of RBI |
33,187 |
-38,981 |
1,15,274 |
-42,812 |
3,145 |
3,461 |
69,393 |
97,384 |
41,646 |
-50,484 |
Memo: |
|
|
|
|
|
|
|
|
|
|
Net Domestic assets |
-1,50,550 |
-1,21,813 |
-24,182 |
14,375 |
-58,843 |
-68,088 |
-37,994 |
-1,00,631 |
14,883 |
85,877 |
LAF- Repos (+) / Reverse Repos(-) |
21,165 |
-41,120 |
-82,145 |
-32,182 |
9,067 |
16,300 |
27,980 |
-45,350 |
51,480 |
-62,170 |
Net Open Market Sales # * |
-5,923 |
-1,793 |
-33,521 |
1,246 |
1,560 |
-3,919 |
-4,810 |
-8,696 |
-10,535 |
-7,669 |
Centre’s Surplus |
26,594 |
9,658 |
-76,586 |
-34,597 |
15,376 |
54,765 |
-8,950 |
-42,427 |
6,199 |
-32,830 |
Mobilisation under the
MSS |
1,05,419 |
98,084 |
-54,742 |
19,643 |
48,855 |
31,192 |
5,728 |
6,040 |
-628 |
-53,754 |
Net Purchases(+)/Sales(-) from |
|
|
|
|
|
|
|
|
|
|
Authorised Dealers |
3,12,054 |
2,69,355 |
-1,56,460^ |
38,873 |
1,01,814 |
87,596 |
83,771 |
3,956 |
-52,760 |
-1,07,656^ |
NFEA/Reserve Money @ |
133.1 |
133.3 |
137.1 |
119.8 |
125.8 |
133.4 |
133.1 |
143.8 |
141.1 |
134.7 |
NFEA/Currency @ |
209.2 |
197.2 |
184.9 |
165.7 |
193.6 |
194.3 |
209.2 |
213.5 |
220.2 |
183.3 |
NFEA: Net Foreign Exchange Assets. FCA: Foreign Currency Assets.
LAF: Liquidity Adjustment Facility. *: At face value. # : Excludes Treasury Bills
@ : Per cent; end of period ^ : up to November 28, 2008.
Note:
1. Data are based on March 31 for Q4 and last reporting Friday for all other quarters.
2. Figures in parentheses are percentage variations during the fiscal year.
3. Government Balances as on March 31, 2008 are after closure of accounts. |
|
 IST,
IST,


