Services and Infrastructure Outlook Survey for Q4:2022-23
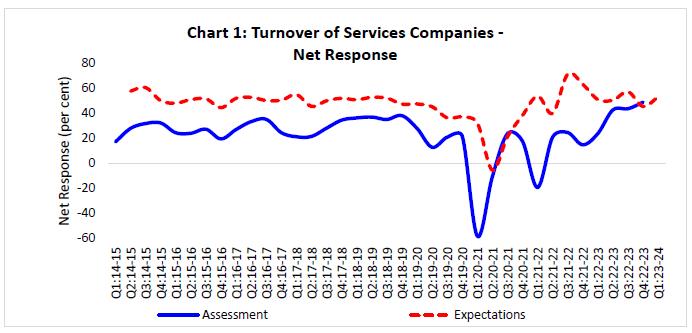
Today, the Reserve Bank released the results of 36th round of its quarterly services and infrastructure outlook survey (SIOS) conducted during Q4:2022-23. This forward-looking survey1 captures qualitative assessment and expectations of Indian companies in the services and infrastructure sectors on a set of business parameters relating to demand conditions, price situation and other business conditions. In the latest round of the survey, 638 companies provided their assessment for Q4:2022-23 and expectations for Q1:2023-24 as well as outlook on key parameters for the subsequent two quarters.
Highlights:
A. Services Sector
Assessment for Q4:2022-23
Services sector enterprises assessed improvement in overall business situation and their turnover during Q4:2022-23 (Chart 1 and Table A).
Sentiments on employment conditions remained optimistic though they tempered albeit from the previous survey round.
Cost burden remained at an elevated level although some moderation is assessed as compared to the previous quarter.
Firms expressed guarded optimism for both selling prices and profit margin in Q4:2022-23. Their assessment of physical Investment was positive but lower than that in the last survey round.
Expectations for Q1:2023-24
Respondents were upbeat about overall business situation and the turnover during Q1:2023-24; they expect favourable employment conditions for both full-time and part-time employees though the pace of expansion is likely to be somewhat slower (Chart 1 and Table A).
Input cost pressures are likely to continue for services firms, with some easing in Q1:2023-24, and their selling prices are expected to rise at a slower pace; profit margin growth is likely to be maintained during the quarter.
Expectations for Q2:2023-24 and Q3:2023-24
Demand for services is likely to grow sequentially till Q3:2023-24 (Table C).
Input cost pressures are likely to persist in the near term and selling prices are expected to rise.
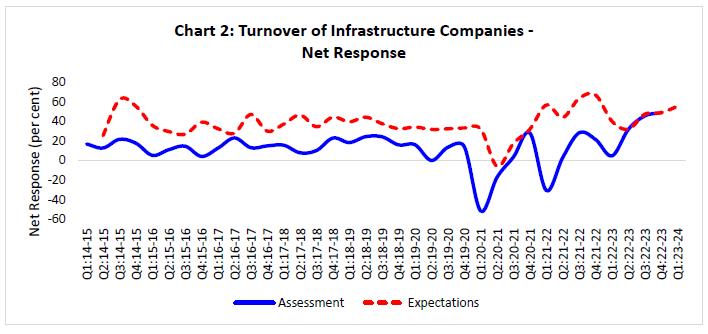
B. Infrastructure Sector
Assessment for Q4:2022-23
Infrastructure companies gauged improvement in the overall business situation and their own turnover (Chart 2 and Table B).
Respondents reported positive sentiments on both full-time employment and part-time employment.
Respondents assessed easing of input cost pressures and lower growth in selling prices for Q4:2022-23; their sentiments on physical investment in infrastructure, however, remained highly positive.
Expectations for Q1:2023-24
Demand parameters in the infrastructure sector are expected to improve in Q1:2023-24 and the job landscape is expected to expand (Chart 2 and Table B).
Infrastructure firms expressed lower optimism for both selling price growth and profit margin in Q1:2023-24.
Expectations for Q2:2023-24 and Q3:2023-24
Firms expressed high optimism on overall business situation and turnover till Q3:2023-24 (Table D).
Job landscape in the infrastructure sector is expected to improve sequentially.
After some moderation in Q1:2023-24, respondents expect the cost of inputs and selling prices to move in the next two quarters.
Table S1: Assessment and Expectation for Overall Business Situation
(Percentage responses)@
Quarter
Assessment
Expectation
Better
No Change
Worse
Net response#
Better
No Change
Worse
Net response
Q4:21-22
40.7
36.0
23.4
17.3
68.3
28.2
3.5
64.8
Q1:22-23
47.0
38.3
14.7
32.2
56.6
40.1
3.3
53.4
Q2:22-23
45.9
48.7
5.4
40.5
59.6
36.7
3.7
55.9
Q3:22-23
52.4
43.3
4.3
48.1
57.4
38.1
4.4
53.0
Q4:22-23
59.8
30.0
10.3
49.5
55.0
40.0
5.0
50.1
Q1:23-24
64.2
27.4
8.4
55.8
‘Increase’ in Overall business situation is optimistic. @: Due to rounding off percentage may not add up to 100. #: Net Response (NR) is the difference of percentage of the respondents reporting optimism and that reporting pessimism. The range is -100 to 100. Any value greater than zero indicates expansion/ optimism and any value less than zero indicates contraction/ pessimism.
Table S2: Assessment and Expectation for Turnover
(Percentage responses)
Quarter
Assessment
Expectation
Increase
No Change
Decrease
Net response
Increase
No Change
Decrease
Net response
Q4:21-22
41.0
32.9
26.1
14.9
67.2
28.6
4.1
63.1
Q1:22-23
43.1
37.7
19.2
23.9
55.5
40.2
4.3
51.1
Q2:22-23
51.2
40.3
8.5
42.7
54.6
41.4
4.0
50.6
Q3:22-23
49.2
45.2
5.5
43.7
61.6
34.0
4.4
57.1
Q4:22-23
57.4
34.0
8.5
48.9
51.5
42.5
6.0
45.5
Q1:23-24
60.0
33.1
6.9
53.1
‘Increase’ in Turnover is optimistic. Footnotes @ and # given in Table 1 are applicable here.
Table S3: Assessment and Expectation for Full-time Employees
(Percentage responses)
Quarter
Assessment
Expectation
Increase
No Change
Decrease
Net response
Increase
No Change
Decrease
Net response
Q4:21-22
20.1
61.5
18.4
1.7
49.7
47.9
2.4
47.2
Q1:22-23
28.2
57.5
14.3
13.8
27.0
68.6
4.4
22.6
Q2:22-23
35.6
57.7
6.7
28.9
29.1
67.8
3.1
26.0
Q3:22-23
42.9
52.5
4.6
38.4
38.4
55.9
5.8
32.6
Q4:22-23
45.1
48.0
7.0
38.1
47.1
48.0
4.8
42.3
Q1:23-24
47.8
45.9
6.3
41.6
‘Increase’ in Full-time Employees is optimistic. Footnotes @ and # given in Table 1 are applicable here.
Table S4: Assessment and Expectation for Part-time Employees
(Percentage responses)
Quarter
Assessment
Expectation
Increase
No Change
Decrease
Net response
Increase
No Change
Decrease
Net response
Q4:21-22
18.5
70.4
11.1
7.4
57.5
39.7
2.7
54.8
Q1:22-23
25.2
65.9
8.9
16.3
25.0
67.8
7.2
17.8
Q2:22-23
22.2
71.8
6.0
16.2
29.0
64.5
6.6
22.4
Q3:22-23
40.1
54.8
5.1
34.9
27.8
67.3
5.0
22.8
Q4:22-23
36.2
58.5
5.3
30.9
41.8
53.1
5.1
36.7
Q1:23-24
35.3
60.6
4.2
31.1
‘Increase’ in Part-time Employees is optimistic. Footnotes @ and # given in Table 1 are applicable here.
Table S5: Assessment and Expectation for Availability of Finance
(Percentage responses)
Quarter
Assessment
Expectation
Improve
No Change
Worsen
Net response
Improve
No Change
Worsen
Net response
Q4:21-22
32.2
46.2
21.6
10.5
50.7
45.9
3.4
47.3
Q1:22-23
28.5
54.9
16.5
12.0
33.5
61.3
5.2
28.2
Q2:22-23
26.9
65.8
7.3
19.6
33.2
61.7
5.1
28.2
Q3:22-23
42.1
53.4
4.6
37.5
32.9
61.0
6.2
26.7
Q4:22-23
34.9
61.6
3.6
31.3
42.3
52.4
5.4
36.9
Q1:23-24
36.0
61.4
2.6
33.4
‘Improve’ in Availability of Finance is optimistic. Footnotes @ and # given in Table 1 are applicable here.
Table S6: Assessment and Expectation for Cost of Finance
(Percentage responses)
Quarter
Assessment
Expectation
Increase
No Change
Decrease
Net response
Increase
No Change
Decrease
Net response
Q4:21-22
15.5
75.0
9.5
-6.0
43.6
54.0
2.4
-41.2
Q1:22-23
34.4
58.5
7.1
-27.3
17.3
79.9
2.8
-14.5
Q2:22-23
35.1
59.5
5.4
-29.7
31.5
66.0
2.5
-29.1
Q3:22-23
40.7
54.7
4.6
-36.1
39.7
57.1
3.2
-36.5
Q4:22-23
36.7
60.1
3.2
-33.5
41.6
53.2
5.2
-36.5
Q1:23-24
35.4
62.0
2.6
-32.8
‘Decrease’ in Cost of Finance is optimistic. Footnotes @ and # given in Table 1 are applicable here.
Table S7: Assessment and Expectation for Salary/Wages
(Percentage responses)
Quarter
Assessment
Expectation
Increase
No Change
Decrease
Net response
Increase
No Change
Decrease
Net response
Q4:21-22
24.1
71.6
4.3
-19.8
49.6
49.3
1.1
-48.5
Q1:22-23
40.4
55.1
4.5
-35.9
37.0
62.4
0.6
-36.3
Q2:22-23
46.1
51.0
2.9
-43.3
28.4
70.5
1.1
-27.3
Q3:22-23
47.9
48.4
3.7
-44.2
42.4
56.0
1.6
-40.9
Q4:22-23
47.6
48.4
3.9
-43.7
43.3
52.1
4.6
-38.7
Q1:23-24
45.9
46.7
7.5
-38.4
‘Decrease’ in Salary/Wages is optimistic. Footnotes @ and # given in Table 1 are applicable here.
Table S8: Assessment and Expectation for Cost of Inputs
(Percentage responses)
Quarter
Assessment
Expectation
Increase
No Change
Decrease
Net response
Increase
No Change
Decrease
Net response
Q4:21-22
63.5
32.9
3.6
-59.9
73.1
26.1
0.8
-72.4
Q1:22-23
67.0
29.9
3.2
-63.8
61.0
36.6
2.3
-58.7
Q2:22-23
46.0
50.3
3.6
-42.4
62.0
36.1
1.9
-60.2
Q3:22-23
46.1
49.2
4.7
-41.4
49.4
45.6
4.9
-44.5
Q4:22-23
41.9
53.4
4.7
-37.2
50.1
44.5
5.3
-44.8
Q1:23-24
43.8
53.6
2.7
-41.1
‘Decrease’ in Cost of Inputs is optimistic. Footnotes @ and # given in Table 1 are applicable here.
Table S9: Assessment and Expectation for Selling Price
(Percentage responses)
Quarter
Assessment
Expectation
Increase
No Change
Decrease
Net response
Increase
No Change
Decrease
Net response
Q4:21-22
24.2
65.7
10.2
14.0
54.1
43.1
2.8
51.4
Q1:22-23
31.9
60.1
8.0
23.9
29.5
65.9
4.6
24.9
Q2:22-23
19.1
74.9
5.9
13.2
33.3
63.1
3.6
29.8
Q3:22-23
40.8
54.4
4.8
36.0
25.7
68.3
6.1
19.6
Q4:22-23
34.4
62.2
3.5
30.9
38.9
55.6
5.5
33.4
Q1:23-24
35.7
60.0
4.3
31.3
‘Increase’ in Selling Price is optimistic. Footnotes @ and # given in Table 1 are applicable here.
Table S10: Assessment and Expectation for Profit Margin
(Percentage responses)
Quarter
Assessment
Expectation
Increase
No Change
Decrease
Net response
Increase
No Change
Decrease
Net response
Q4:21-22
21.2
46.4
32.4
-11.1
46.5
47.0
6.5
40.1
Q1:22-23
19.0
49.3
31.7
-12.7
28.9
61.3
9.8
19.1
Q2:22-23
21.9
58.3
19.9
2.0
30.1
58.1
11.8
18.3
Q3:22-23
41.9
52.0
6.1
35.8
36.3
54.3
9.5
26.8
Q4:22-23
43.6
46.7
9.7
33.9
44.8
49.7
5.4
39.4
Q1:23-24
48.4
42.3
9.3
39.1
‘Increase’ in Profit Margin is optimistic. Footnotes @ and # given in Table 1 are applicable here.
Table S11: Assessment and Expectation for Inventories
(Percentage responses)
Quarter
Assessment
Expectation
Increase
No Change
Decrease
Net response
Increase
No Change
Decrease
Net response
Q4:21-22
18.9
70.6
10.6
8.3
54.9
41.8
3.4
51.5
Q1:22-23
25.4
66.7
8.0
17.4
22.9
72.5
4.7
18.2
Q2:22-23
33.7
62.7
3.6
30.1
27.5
68.9
3.6
24.0
Q3:22-23
48.3
46.9
4.8
43.5
40.5
56.8
2.7
37.8
Q4:22-23
38.1
58.1
3.8
34.2
48.8
46.0
5.2
43.5
Q1:23-24
38.6
57.7
3.7
34.8
‘Increase’ in Inventories is optimistic. Footnotes @ and # given in Table 1 are applicable here.
Table S12: Assessment and Expectation for Technical/Service Capacity
(Percentage responses)
Quarter
Assessment
Expectation
Increase
No Change
Decrease
Net response
Increase
No Change
Decrease
Net response
Q4:21-22
23.7
71.6
4.7
18.9
65.1
34.1
0.8
64.3
Q1:22-23
25.8
71.9
2.3
23.5
31.3
66.9
1.8
29.4
Q2:22-23
24.0
73.8
2.2
21.8
33.9
63.8
2.3
31.7
Q3:22-23
41.7
53.6
4.7
37.1
29.5
68.8
1.7
27.7
Q4:22-23
36.4
60.9
2.7
33.7
41.5
53.9
4.6
37.0
Q1:23-24
36.4
61.1
2.5
34.0
‘Increase’ in Technical/Service Capacity is optimistic. Footnotes @ and # given in Table 1 are applicable here.
Table S13: Assessment and Expectation for Physical Investment
(Percentage responses)
Quarter
Assessment
Expectation
Increase
No Change
Decrease
Net response
Increase
No Change
Decrease
Net response
Q4:21-22
20.5
74.3
5.3
15.2
61.5
37.4
1.1
60.3
Q1:22-23
25.0
72.5
2.5
22.5
27.7
69.9
2.4
25.3
Q2:22-23
21.4
76.7
2.0
19.4
32.5
66.5
1.0
31.5
Q3:22-23
41.3
54.4
4.3
37.0
22.8
75.8
1.5
21.3
Q4:22-23
32.2
65.5
2.3
30.0
41.4
53.9
4.7
36.7
Q1:23-24
33.0
64.3
2.7
30.3
‘Increase’ in Physical Investment is optimistic. Footnotes @ and # given in Table 1 are applicable here.
Infrastructure Sector
Table I1: Assessment and Expectation for Overall Business Situation
(Percentage responses)@
Quarter
Assessment
Expectation
Better
No Change
Worse
Net response#
Better
No Change
Worse
Net response
Q4:21-22
46.9
29.6
23.5
23.5
75.7
19.9
4.4
71.3
Q1:22-23
46.9
26.9
26.2
20.8
59.3
34.6
6.2
53.1
Q2:22-23
41.9
46.8
11.3
30.6
53.1
36.9
10.0
43.1
Q3:22-23
55.5
38.0
6.5
49.0
49.2
46.7
4.1
45.1
Q4:22-23
60.9
28.7
10.4
50.4
56.8
37.2
6.0
50.9
Q1:23-24
60.5
34.2
5.3
55.3
‘Increase’ in Overall business situation is optimistic. @: Due to rounding off percentage may not add up to 100. #: Net Response (NR) is the difference of percentage of the respondents reporting optimism and that reporting pessimism. The range is -100 to 100. Any value greater than zero indicates expansion/ optimism and any value less than zero indicates contraction/ pessimism.
Table I2: Assessment and Expectation for Turnover
(Percentage responses)
Quarter
Assessment
Expectation
Increase
No Change
Decrease
Net response
Increase
No Change
Decrease
Net response
Q4:21-22
45.0
31.3
23.8
21.3
73.3
20.0
6.7
66.7
Q1:22-23
37.2
30.2
32.6
4.7
51.3
37.5
11.3
40.0
Q2:22-23
45.5
40.7
13.8
31.7
43.0
46.1
10.9
32.0
Q3:22-23
52.6
40.2
7.2
45.4
56.1
35.0
8.9
47.2
Q4:22-23
60.9
27.0
12.2
48.7
55.8
37.2
7.0
48.8
Q1:23-24
61.4
32.5
6.1
55.3
‘Increase’ in Turnover is optimistic. Footnotes @ and # given in Table 1 are applicable here.
Table I3: Assessment and Expectation for Full-time Employees
(Percentage responses)
Quarter
Assessment
Expectation
Increase
No Change
Decrease
Net response
Increase
No Change
Decrease
Net response
Q4:21-22
12.5
80.0
7.5
5.0
54.5
39.6
6.0
48.5
Q1:22-23
22.7
62.5
14.8
7.8
23.1
71.8
5.1
17.9
Q2:22-23
31.5
60.5
8.1
23.4
20.6
74.6
4.8
15.9
Q3:22-23
51.2
42.3
6.5
44.7
36.4
57.0
6.6
29.8
Q4:22-23
47.0
47.8
5.2
41.7
52.4
40.7
6.9
45.5
Q1:23-24
50.9
44.7
4.4
46.5
‘Increase’ in Full-time Employees is optimistic. Footnotes @ and # given in Table 1 are applicable here.
Table I4: Assessment and Expectation for Part-time Employees
(Percentage responses)
Quarter
Assessment
Expectation
Increase
No Change
Decrease
Net response
Increase
No Change
Decrease
Net response
Q4:21-22
4.4
88.9
6.7
-2.2
73.2
24.7
2.1
71.1
Q1:22-23
17.2
75.9
6.9
10.3
20.5
75.0
4.5
15.9
Q2:22-23
19.7
71.3
9.0
10.7
21.8
72.7
5.5
16.4
Q3:22-23
50.3
43.2
6.5
43.8
24.6
68.6
6.8
17.8
Q4:22-23
46.4
50.0
3.6
42.9
52.1
41.7
6.2
45.9
Q1:23-24
43.8
55.4
0.9
42.9
‘Increase’ in Part-time Employees is optimistic. Footnotes @ and # given in Table 1 are applicable here.
Table I5: Assessment and Expectation for Availability of Finance
(Percentage responses)
Quarter
Assessment
Expectation
Improve
No Change
Worsen
Net response
Improve
No Change
Worsen
Net response
Q4:21-22
31.3
46.3
22.5
8.8
66.4
29.1
4.5
61.9
Q1:22-23
29.5
49.6
20.9
8.5
28.8
67.5
3.8
25.0
Q2:22-23
30.9
60.2
8.9
22.0
33.9
59.8
6.3
27.6
Q3:22-23
50.5
43.7
5.8
44.7
43.4
50.8
5.7
37.7
Q4:22-23
45.1
49.6
5.3
39.8
52.2
41.9
5.8
46.4
Q1:23-24
46.8
50.5
2.7
44.1
‘Improve’ in Availability of Finance is optimistic. Footnotes @ and # given in Table 1 are applicable here.
Table I6: Assessment and Expectation for Cost of Finance
(Percentage responses)
Quarter
Assessment
Expectation
Increase
No Change
Decrease
Net response
Increase
No Change
Decrease
Net response
Q4:21-22
27.4
67.1
5.5
-21.9
59.4
38.3
2.3
-57.0
Q1:22-23
43.0
51.2
5.8
-37.2
26.8
71.8
1.4
-25.4
Q2:22-23
43.8
48.8
7.4
-36.4
39.8
58.5
1.7
-38.1
Q3:22-23
51.0
42.8
6.2
-44.9
47.5
46.7
5.8
-41.7
Q4:22-23
43.4
49.6
7.1
-36.3
49.7
44.5
5.8
-43.8
Q1:23-24
43.8
53.6
2.7
-41.1
‘Decrease’ in Cost of Finance is optimistic. Footnotes @ and # given in Table 1 are applicable here.
Table I7: Assessment and Expectation for Salary/Wages
(Percentage responses)
Quarter
Assessment
Expectation
Increase
No Change
Decrease
Net response
Increase
No Change
Decrease
Net response
Q4:21-22
23.8
72.5
3.8
-20.0
59.0
41.0
0.0
-59.0
Q1:22-23
38.5
55.4
6.2
-32.3
38.8
60.0
1.3
-37.5
Q2:22-23
31.1
64.8
4.1
-27.0
20.8
76.9
2.3
-18.5
Q3:22-23
56.3
39.2
4.4
-51.9
35.0
62.4
2.6
-32.5
Q4:22-23
47.0
49.6
3.5
-43.5
50.5
43.6
5.8
-44.7
Q1:23-24
46.5
50.9
2.6
-43.9
‘Decrease’ in Salary/Wages is optimistic. Footnotes @ and # given in Table 1 are applicable here.
Table I8: Assessment and Expectation for Cost of Inputs
(Percentage responses)
Quarter
Assessment
Expectation
Increase
No Change
Decrease
Net response
Increase
No Change
Decrease
Net response
Q4:21-22
77.5
19.7
2.8
-74.6
83.1
15.4
1.5
-81.5
Q1:22-23
79.5
19.7
0.8
-78.7
80.3
18.3
1.4
-78.9
Q2:22-23
50.0
44.2
5.8
-44.2
76.0
23.1
0.8
-75.2
Q3:22-23
52.2
41.6
6.2
-46.0
53.0
42.7
4.3
-48.7
Q4:22-23
46.9
50.4
2.7
-44.2
55.3
37.8
6.9
-48.5
Q1:23-24
49.6
48.7
1.8
-47.8
‘Decrease’ in Cost of Inputs is optimistic. Footnotes @ and # given in Table 1 are applicable here.
Table I9: Assessment and Expectation for Selling Price
(Percentage responses)
Quarter
Assessment
Expectation
Increase
No Change
Decrease
Net response
Increase
No Change
Decrease
Net response
Q4:21-22
21.4
73.2
5.4
16.1
66.4
32.7
0.9
65.5
Q1:22-23
32.2
54.0
13.8
18.4
25.0
73.2
1.8
23.2
Q2:22-23
27.5
60.0
12.5
15.0
34.1
62.4
3.5
30.6
Q3:22-23
51.4
41.8
6.8
44.5
32.2
62.6
5.2
27.0
Q4:22-23
46.8
48.6
4.5
42.3
50.3
43.1
6.6
43.8
Q1:23-24
43.5
53.7
2.8
40.7
‘Increase’ in Selling Price is optimistic. Footnotes @ and # given in Table 1 are applicable here.
Table I10: Assessment and Expectation for Profit Margin
(Percentage responses)
Quarter
Assessment
Expectation
Increase
No Change
Decrease
Net response
Increase
No Change
Decrease
Net response
Q4:21-22
19.0
35.4
45.6
-26.6
57.4
33.1
9.6
47.8
Q1:22-23
13.8
34.6
51.5
-37.7
27.8
57.0
15.2
12.7
Q2:22-23
22.0
54.5
23.6
-1.6
22.5
62.0
15.5
7.0
Q3:22-23
52.2
40.1
7.6
44.6
34.7
47.1
18.2
16.5
Q4:22-23
46.0
44.2
9.7
36.3
52.8
39.6
7.6
45.1
Q1:23-24
47.3
45.5
7.1
40.2
‘Increase’ in Profit Margin is optimistic. Footnotes @ and # given in Table 1 are applicable here.
Table I11: Assessment and Expectation for Inventories
(Percentage responses)
Quarter
Assessment
Expectation
Increase
No Change
Decrease
Net response
Increase
No Change
Decrease
Net response
Q4:21-22
19.1
74.5
6.4
12.8
64.9
31.6
3.5
61.4
Q1:22-23
20.9
70.1
9.0
11.9
24.4
71.1
4.4
20.0
Q2:22-23
36.4
55.9
7.6
28.8
25.8
71.2
3.0
22.7
Q3:22-23
52.4
41.0
6.6
45.9
45.8
47.5
6.8
39.0
Q4:22-23
48.7
46.0
5.3
43.4
53.6
39.2
7.2
46.4
Q1:23-24
48.2
50.0
1.8
46.4
‘Increase’ in Inventories is optimistic. Footnotes @ and # given in Table 1 are applicable here.
Table I12: Assessment and Expectation for Technical/Service Capacity
(Percentage responses)
Quarter
Assessment
Expectation
Increase
No Change
Decrease
Net response
Increase
No Change
Decrease
Net response
Q4:21-22
28.6
60.7
10.7
17.9
76.7
22.2
1.1
75.6
Q1:22-23
23.5
73.5
2.9
20.6
32.1
64.3
3.6
28.6
Q2:22-23
25.5
68.2
6.4
19.1
29.4
67.6
2.9
26.5
Q3:22-23
50.2
43.9
6.0
44.2
27.7
70.5
1.8
25.9
Q4:22-23
45.9
50.5
3.7
42.2
50.5
43.5
6.0
44.6
Q1:23-24
45.0
53.2
1.8
43.1
‘Increase’ in Technical/Service Capacity is optimistic. Footnotes @ and # given in Table 1 are applicable here.
Table I13: Assessment and Expectation for Physical Investment
(Percentage responses)
Quarter
Assessment
Expectation
Increase
No Change
Decrease
Net response
Increase
No Change
Decrease
Net response
Q4:21-22
17.2
75.9
6.9
10.3
77.4
20.4
2.2
75.3
Q1:22-23
27.0
67.6
5.4
21.6
24.1
69.0
6.9
17.2
Q2:22-23
22.0
72.5
5.5
16.5
38.9
58.3
2.8
36.1
Q3:22-23
49.7
44.1
6.3
43.4
26.9
70.4
2.8
24.1
Q4:22-23
45.9
50.5
3.7
42.2
49.8
43.6
6.6
43.2
Q1:23-24
43.9
52.3
3.7
40.2
‘Increase’ in Physical Investment is optimistic. Footnotes @ and # given in Table 1 are applicable here.
1 The survey results reflect the respondents’ views, which are not necessarily shared by the Reserve Bank. Results of the previous survey round were released on the Bank’s website on February 08, 2023.
2 Net Response (NR) is the difference between the percentage of respondents reporting optimism and those reporting pessimism. It ranges between -100 to 100. Positive value indicates expansion/optimism and negative value indicates contraction/pessimism. In other words, NR = (I – D); where, I is the percentage response of ‘Increase/optimism’, D is the percentage response of ‘Decrease/pessimism’ and E is the percentage response as ‘no change/ equal’ (i.e., I+D+E=100). For example, increase in turnover is optimism whereas decrease in cost of inputs is optimism.
RbiTtsCommonUtility
PLAYING
LISTEN
LOADING...
0:062:49
Related Assets
RBI-Install-RBI-Content-Global
RbiSocialMediaUtility
Share this page:
Install the RBI mobile application and get quick access to the latest news!
RbiWasItHelpfulUtility
Was this page helpful?Thanks!
Would like to give more details?
Thank you for your feedback!Thank you for your feedback!