 IST,
IST,
VI. The External Economy
India’s balance of payments position remained comfortable during 2005-06, despite record high international crude oil prices. Growth of merchandise exports continued to be robust. The surplus on the invisibles account remained buoyant led by exports of services and private remittances, thereby financing a large part of the trade deficit. Nonetheless, the current account deficit widened during the first nine months of 2005-06, in line with the growth in investment demand in the economy. Capital flows continued to remain large, reflecting increased appetite for domestic financial assets. As a result, the overall balance of payments remained comfortable with foreign exchange reserves increasing by US $ 10.1 billion during the fiscal 2005-06, despite an outgo of US $ 7.1 billion during December 2005 from the reserves on account of the redemption of India Millennium Deposits (IMDs). External debt recorded a decline reflecting the IMD redemption.
International Developments
The world economy exhibited strong growth in 2005 supported by benign financial market conditions and conducive macroeconomic policies. After experiencing relatively robust growth in 2004, the US economy witnessed a moderate deceleration in 2005, reflecting the adverse one-off effects of the late summer hurricanes. The growth momentum attained in the Japanese economy during the first quarter of 2005 got broad-based during the year. The recovery, initially driven by exports and fixed investment, is now being supported by household spending, including residential investment. The Euro area also exhibited some modest pick-up in the second half of 2005, although growth was lower than in 2004, driven by slowdown in Germany and France. Developing countries led by China and India continued to witness a strong momentum in GDP growth, which spurred global growth in 2005 (Table 46). According to estimates by the Asian Development Bank, developing Asia recorded a growth of 7.4 per cent during 2005 on top of 7.8 per cent growth during 2004.
The world economy is projected to continue with its growth momentum in 2006. The global growth prospects are, however, vulnerable to the growing concerns relating to high oil prices and global imbalances. Oil prices continue to remain high and volatile. After easing from Katrina-induced record high, crude oil prices again rebounded in early 2006 on account of geo-political uncertainties. Persistence of global financial imbalances continues to be another key risk to global growth. The most visible aspect of the global imbalances has been the growing deficit in the current account of the balance of payments of the US and correspondingly large surpluses in the external accounts of other countries, including oil exporters such as Russia and Saudi Arabia, Japan and the countries
|
Table 46: Growth Rates |
||||||
|
(Per cent) |
||||||
|
Country |
2004 |
2005 |
2005-Q1 |
2005-Q2 |
2005-Q3 |
2005-Q4 |
|
1 |
2 |
3 |
4 |
5 |
6 |
7 |
|
Advanced Economies |
||||||
|
Euro Area |
2.1 |
1.3 |
1.4 |
1.1 |
1.6 |
1.6 |
|
Japan |
1.7 |
2.7 |
1.4 |
2.6 |
2.9 |
4.3 |
|
OECD Countries |
3.3 |
2.7 |
2.6 |
2.6 |
2.9 |
2.9 |
|
UK |
3.1 |
1.8 |
2.1 |
1.5 |
1.7 |
1.8 |
|
US |
4.2 |
3.5 |
3.6 |
3.6 |
3.6 |
3.2 |
|
Emerging Economies@ |
||||||
|
Argentina |
9.0 |
9.1 |
8.0 |
10.1 |
9.2 |
9.1 |
|
Brazil |
5.2 |
2.2 |
2.6 |
3.9 |
1.0 |
1.4 |
|
China |
9.5 |
9.6 |
9.4 |
9.5 |
9.4 |
9.9 |
|
India |
7.5* |
8.1# |
7.0 |
8.1 |
8.0 |
7.6 |
|
Indonesia |
5.1 |
5.5 |
6.4 |
5.5 |
5.3 |
4.9 |
|
Malaysia |
7.1 |
5.1 |
5.7 |
4.1 |
5.3 |
5.2 |
|
South Korea |
4.6 |
4.0 |
2.7 |
3.3 |
4.5 |
5.3 |
|
Thailand |
6.9 |
4.4 |
3.3 |
4.4 |
5.3 |
4.7 |
|
* : FY 2004-05. # : FY 2005-06. |
||||||
of emerging Asia, and most particularly China. The US current account deficit widened from 5.7 per cent of GDP in 2004 to 6.4 per cent in 2005 and is estimated by the Organisation of Economic Cooperation and Development (OECD) to reach 7.0 per cent in 2007. A disorderly adjustment of the financial imbalances may prove to be costly and disruptive to global growth. More recently, Avian flu is another potential risk to the global economy, particularly the Asian region. The World Bank estimates that a year-long pandemic could cost the world economy US $ 800 billion (equivalent to 2.0 per cent of global GDP).
According to the Institute of International Finance (IIF), net private capital flows to emerging market economies increased from US $ 329 billion in 2004 to all time high of US $ 400 billion in 2005. The increase in capital flows during 2005 was led by portfolio equity flows and commercial bank lending, while direct equity investment and bond flows maintained the high levels of 2004. The IIF has estimated that capital flows will remain robust at US $ 357 billion in 2006. The moderation over the previous year is largely on account of the opportunity taken by many borrowers to pre-finance their obligations due in 2006 in the year 2005 itself.
World exports in US dollar terms are estimated to have increased by 12.1 per cent during 2005 as compared with 21.2 per cent last year (Table 47). Developing countries registered higher growth (18.1 per cent) than the industrial countries (7.9 per cent), although the growth decelerated in both the economies. According to the United Nation’s World Economic Situation and Prospects 2006, world trade in volume terms is projected to grow by 7.2 per cent in 2006 as compared with 6.6 per cent growth in 2005. During 2006, export volume growth of developing countries (8.7 per cent) is projected to be higher than that of developed countries (6.0 per cent).
|
Table 47: Growth in Exports: Global Scenario |
||
|
(Per cent) |
||
|
Region/ Country |
2004 |
2005 |
|
1 |
2 |
3 |
|
World |
21.2 |
12.1 |
|
Industrial Countries |
17.3 |
7.9 |
|
USA |
12.9 |
10.8 |
|
Germany |
21.3 |
7.3 |
|
Japan |
19.9 |
5.2 |
|
Developing Countries |
27.3 |
18.1 |
|
China |
35.5 |
28.4 |
|
India |
28.2 |
25.9 |
|
Korea |
31.0 |
12.0 |
|
Singapore |
24.6 |
17.6 |
|
Malaysia |
26.5 |
12.0 |
|
Thailand |
19.8 |
14.4 |
|
Source : International
Financial Statistics |
||
Merchandise Trade
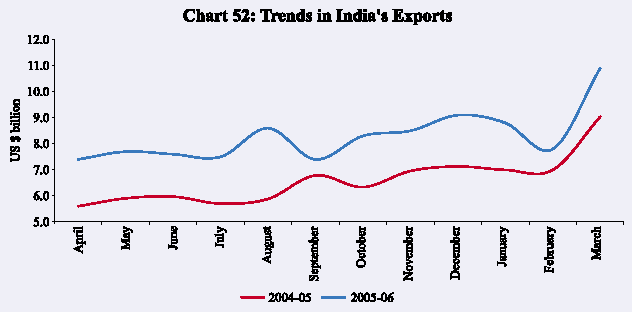
During 2005-06, India’s exports continued to maintain the momentum of high growth for the fourth year in succession in an environment of favourable global demand conditions and growing competitiveness of the domestic manufacturing. According to the Directorate General of Commercial Intelligence and Statistics (DGCI&S), India’s exports registered a strong growth of 24.7 per cent in 2005-06 on top of 26.4 per cent growth a year ago (Chart 52).
Export growth was broad-based across major commodity sectors and destinations. Engineering goods, textiles, chemicals, gems and jewellery and
|
Table 48: Exports of Principal Commodities (April-December) |
||||||
|
US $ billion |
Variation (per cent) |
|||||
|
Commodity Group |
2004-05 |
2005-06 |
2004-05 |
2005-06 |
||
|
1 |
2 |
3 |
4 |
5 |
||
|
1. |
Primary Products |
8.6 |
11.1 |
31.7 |
28.8 |
|
|
of which: |
||||||
|
a) |
Agriculture and Allied Products |
5.8 |
7.1 |
13.8 |
22.6 |
|
|
b) |
Ores and Minerals |
2.8 |
4.0 |
94.9 |
41.8 |
|
|
2. |
Manufactured Goods |
41.4 |
50.5 |
21.2 |
22.1 |
|
|
of which: |
||||||
|
a) |
Chemicals and Related Products |
8.5 |
10.1 |
29.7 |
19.4 |
|
|
b) |
Engineering Goods |
11.5 |
14.9 |
35.3 |
28.9 |
|
|
c) |
Textiles and Textile Products |
9.4 |
11.4 |
6.0 |
21.7 |
|
|
d) |
Gems and Jewellery |
9.4 |
11.1 |
19.2 |
18.0 |
|
|
3. |
Petroleum Products |
5.0 |
8.1 |
95.2 |
63.4 |
|
|
4. |
Total Exports |
56.5 |
72.2 |
27.1 |
27.9 |
|
|
Source : DGCI&S. |
||||||
petroleum products were the key drivers of export growth (Table 48). Within primary products, exports of agricultural and allied commodities accelerated, led by rice, cotton, coffee and marine products. Within engineering goods, technology intensive products such as machinery and instruments, transport equipments and manufactures of metals were the mainstay. Acceleration in exports of textiles and textile products was due to a pick-up in demand in the major markets such as the US and EU – readymade garments accounted for 73.2 per cent of the expansion in textile exports during April-December 2005. Gems and jewellery exports maintained the growth momentum led by demand from the major markets. Exports of petroleum products increased by 63.4 per cent during April-December 2005 on top of 95.2 per cent increase a year ago, mainly reflecting the impact of elevated international prices of petroleum products.
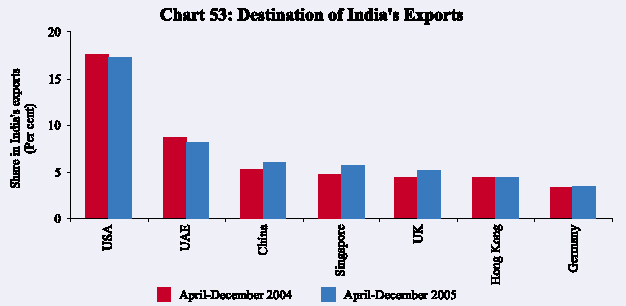
Country-wise, the US continued to be a significant market for India with a share of 17.2 per cent in total exports during 2005-06 (April-December), followed by the UAE (8.2 per cent) and China (6.0 per cent) (Chart 53). Amongst these top three markets, exports to China increased by 45.9 per cent followed by the US (25.8 per cent) and the UAE (20.4 per cent). Amongst major regions, the European Union maintained the dominant position, with a share of 21.7 per cent in India’s total exports. India’s exports to developing countries continued to grow sharply, which was reflected in the share of exports to this group increasing to 38.5 per cent during April-December 2005 from 36.8 per cent a year ago. Latin America was the fastest growing destination of India’s exports during April-December 2005, with a growth of 48.5 per cent.
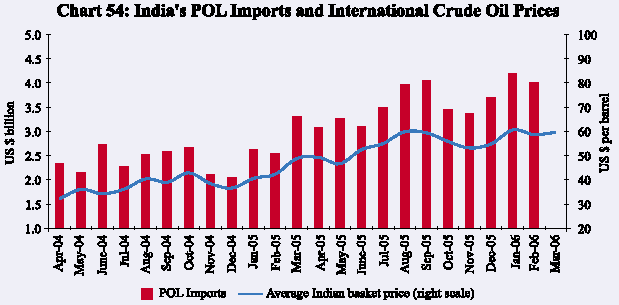
Imports maintained the tempo of high growth at 31.5 per cent during 2005-06, led by both oil and non-oil imports, in an environment of buoyant economy. The
increase in petroleum, oil and lubricants (POL) imports (46.8 per cent) in 2005-06 reflected the impact of sharp increase in international crude oil prices (Chart 54). The Indian basket crude oil price averaged US $ 55.4 per barrel during 2005-06, witnessing a rise of 42.4 per cent. In volume terms, oil import growth, however, slowed down to 3.2 per cent during April-December 2005 from 5.5 per cent a year ago.
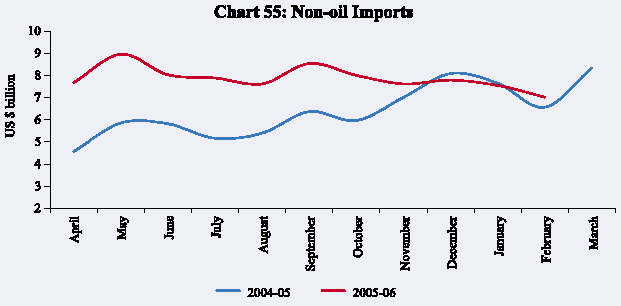
Non-oil imports posted a growth of 25.6 per cent during 2005-06, maintaining the momentum of growth of 33.3 per cent a year ago in tandem with the sustained investment demand in the economy (Chart 55). Capital goods imports remained buoyant, led by an acceleration in imports of machinery (except electrical and electronics), transport equipments, manufactures of metals and
machine tools. Imports of ‘mainly’ industrial inputs (non-oil imports net of gold and silver, bulk consumption goods, manufactured fertilisers and professional instruments) maintained high growth in April-December 2005 at 36.6 per cent as compared with 35.7 per cent a year ago. Gold and silver imports, on the other hand, witnessed a deceleration, which could be attributed, inter alia, to the surge in international gold prices (Table 49).
During April-December 2005, China was the major source of imports with a share of 7.4 per cent in India’s total imports, followed by the US (5.6 per cent), Switzerland (4.8 per cent), Germany (4.1 per cent) and Belgium (3.6 per cent).
|
Table 49: Imports of Principal Commodities (April-December) |
||||
|
US $ billion |
Variation (per cent) |
|||
|
Commodity Group |
2004-05 |
2005-06 |
2004-05 |
2005-06 |
|
1 |
2 |
3 |
4 |
5 |
|
POL |
21.4 |
31.5 |
45.7 |
46.9 |
|
Edible Oils |
1.8 |
1.5 |
-7.1 |
-14.9 |
|
Iron and Steel |
1.8 |
3.5 |
68.7 |
93.4 |
|
Capital Goods |
16.1 |
22.7 |
32.3 |
41.0 |
|
Pearls, Precious and Semi-Precious Stones |
6.2 |
7.4 |
23.9 |
19.9 |
|
Chemicals |
3.9 |
5.0 |
35.3 |
28.8 |
|
Gold and Silver |
7.4 |
8.5 |
46.9 |
15.7 |
|
Total Imports |
76.3 |
104.3 |
37.4 |
36.8 |
|
Memo : |
||||
|
Non-oil Imports excluding Gold and Silver |
47.5 |
64.3 |
32.7 |
35.5 |
|
Mainly Industrial Imports* |
43.5 |
59.5 |
35.7 |
36.6 |
|
* : Non oil imports net of gold and silver, bulk consumption goods, |
||||
|
Table 50: India’s Merchandise Trade |
||
|
(US $ billion) |
||
|
Item |
2004-05 |
2005-06 |
|
1 |
2 |
3 |
|
Exports |
80.7 |
100.6 |
|
(26.4) |
(24.7) |
|
|
Imports |
106.6 |
140.2 |
|
(36.4) |
(31.5) |
|
|
Oil |
29.9 |
43.8 |
|
(45.2) |
(46.8) |
|
|
Non-oil |
76.8 |
96.4 |
|
(33.3) |
(25.6) |
|
|
Trade Balance |
-26.0 |
-39.6 |
|
Memo : |
||
|
Non-oil Trade Balance* |
-3.3 |
-8.7 |
|
* : April-December. Note : Figures in parentheses show percentage change |
||
Reflecting higher imports, trade deficit at US $ 39.6 billion during 2005-06 was higher by 52.7 per cent than the previous year (Table 50). Non-oil trade balance was in deficit at US $ 8.7 billion during April-December 2005 as compared with a deficit of US $ 3.3 billion a year ago.
Current Account
Net surplus under the invisibles account continued to remain sizeable during April-December 2005 (Table 51). Gross invisible receipts during April-December 2005 recorded a rise of 28.1 per cent over the position a year ago due to sustained growth in travel earnings and continuing pace of export of software and other business and professional services and stable remittances from overseas Indians. Private transfers contributed about 28 per cent of gross invisible receipts.
|
Table 51: Invisibles Account (Net) |
|||||||||
|
(US $ million) |
|||||||||
|
Item |
2004-05 |
2004-05 |
2005-06 |
||||||
|
April- |
April- |
July- |
Oct.- |
April- |
April- |
July- |
Oct. |
April- |
|
|
March |
June |
Sept. |
Dec. |
Dec. |
June |
Sept. |
Dec. |
Dec. |
|
|
1 |
2 |
3 |
4 |
5 |
6 |
7 |
8 |
9 |
10 |
|
Travel |
985 |
-62 |
24 |
453 |
415 |
154 |
219 |
578 |
951 |
|
Transportation |
259 |
272 |
-21 |
26 |
277 |
-141 |
-101 |
-49 |
-291 |
|
Insurance |
187 |
-32 |
50 |
77 |
95 |
13 |
253 |
-51 |
215 |
|
Government, not included elsewhere |
67 |
61 |
5 |
19 |
85 |
-15 |
-51 |
32 |
-34 |
|
Software Services |
16,526 |
3,710 |
3,859 |
4,157 |
11,726 |
4,853 |
4,989 |
5,236 |
15,078 |
|
Other Services |
-3,825 |
-927 |
-959 |
-1,745 |
-3,631 |
531 |
671 |
-1,267 |
-65 |
|
Transfers |
20,844 |
5,890 |
4,330 |
4,204 |
14,424 |
5,727 |
4,990 |
6,436 |
17,153 |
|
Investment Income |
-2,669 |
-527 |
-903 |
-560 |
-1,990 |
-682 |
-1,240 |
-2,421 |
-4,343 |
|
Compensation of Employees |
-1,145 |
-231 |
-256 |
-341 |
-828 |
-143 |
-146 |
-319 |
-608 |
|
Total |
31,229 |
8,154 |
6,129 |
6,290 |
20,573 |
10,297 |
9,584 |
8,175 |
28,056 |
|
Table 52: India’s Balance of Payments |
|||||||||
|
(US $ million) |
|||||||||
|
Item |
2004-05 |
2004-05 |
2005-06 |
||||||
|
April- |
April- |
July- |
Oct.- |
April- |
April- |
July- |
Oct. |
April- |
|
|
March |
June |
Sept. |
Dec. |
Dec. |
June |
Sept. |
Dec. |
Dec. |
|
|
1 |
2 |
3 |
4 |
5 |
6 |
7 |
8 |
9 |
10 |
|
Exports |
82,150 |
17,840 |
18,875 |
20,888 |
57,603 |
23,180 |
24,001 |
26,400 |
73,581 |
|
Imports |
1,18,779 |
22,980 |
28,503 |
32,620 |
84,103 |
38,040 |
38,643 |
38,429 |
1,15,112 |
|
Trade Balance |
-36,629 |
-5,140 |
-9,628 |
-11,732 |
-26,500 |
-14,860 |
-14,642 |
-12,029 |
-41,531 |
|
Invisible Receipts |
71,854 |
16,708 |
14,635 |
17,714 |
49,057 |
19,910 |
19,673 |
23,261 |
62,844 |
|
Invisible Payments |
40,625 |
8,554 |
8,506 |
11,424 |
28,484 |
9,613 |
10,089 |
15,086 |
34,788 |
|
Invisibles, net |
31,229 |
8,154 |
6,129 |
6,290 |
20,573 |
10,297 |
9,584 |
8,175 |
28,056 |
|
Current Account |
-5,400 |
3,014 |
-3,499 |
-5,442 |
-5,927 |
-4,563 |
-5,058 |
-3,854 |
-13,475 |
|
Capital Account* |
31,559 |
4,556 |
2,865 |
12,036 |
19,457 |
5,809 |
10,314 |
-872 |
15,251 |
|
Change in Reserves # |
-26,159 |
-7,570 |
634 |
-6,594 |
-13,530 |
-1,246 |
-5,256 |
4,726 |
-1,776 |
|
* : Includes errors and omissions. |
|||||||||
Gross invisibles payments during April-December 2005 registered a rise of 22.1 per cent on account of outbound tourist traffic, transportation and insurance payments, rising import demand for business services and higher interest payments. On the whole, the net invisible surplus during April-December 2005 at US $ 28.1 billion was higher than that of US $ 20.6 billion in the corresponding period of the previous year. While the net invisible surplus expanded by US $ 7.5 billion during April-December 2005, the merchandise trade deficit, on payments basis, expanded by US $ 15.0 billion to US $ 41.5 billion during April-December 2005. The current account deficit, therefore, widened to US $ 13.5 billion from US $ 5.9 billion a year ago (Table 52).
Capital Flows
Capital flows to India remained strong during 2005-06, led by foreign investment flows. Foreign direct investment (FDI) inflows into India at US $ 5.8 billion during 2005-06 (April-January) were 31 per cent higher than in the corresponding period of the previous year, on the back of sustained growth in activity and positive investment climate. FDI was channelled mainly into manufacturing, business and computer services. Mauritius, the US and the UK continued to remain the dominant sources of FDI to India. Foreign institutional investors (FIIs) after remaining subdued during April-May 2005 made large purchases in the Indian stock markets in the subsequent months. Cumulative FII inflows during April-February 2005-06 amounted to US $ 8.2 billion, 19 per cent higher than a year ago. The number of FIIs registered with the SEBI increased from 685 at end-March 2005 to 882 by end-March 2006. Capital inflows through the issuances of American depository receipts (ADRs)/global depository receipts (GDRs) were also substantially higher as booming stock markets offered corporates
|
Table 53: Capital Flows |
|||
|
(US $ million) |
|||
|
Item |
Period |
2004-05 |
2005-06 |
|
1 |
2 |
3 |
4 |
|
Foreign Direct Investment into India |
April-January |
4,478 |
5,843 |
|
FIIs (net) |
April-February |
6,858 |
8,176 |
|
ADRs/GDRs |
April-January |
442 |
2,141 |
|
External Assistance (net) |
April-December |
673 |
914 |
|
External Commercial Borrowings (Medium and long-term) (net) |
April-December |
2,857 |
-1,555 |
|
(3,945*) |
|||
|
Short-term Trade Credits (net) |
April-December |
2,963 |
1,697 |
|
NRI Deposits (net) |
April-January |
-771 |
1,666 |
|
* : Excluding the IMD redemption. |
|||
the opportunity to issue equities abroad. Reflecting the increased domestic investment activity, demand for external commercial borrowings (ECBs), including foreign currency convertible bonds (FCCBs), remained high. Non-Resident Indian deposit accounts recorded inflows during April-January 2005-06 in contrast to net outflows in the previous year (Table 53).
Foreign Exchange Reserves
During April-December 2005, the current account deficit – despite a substantial widening - was more than offset by surplus in the capital account, resulting in an accretion to the foreign exchange reserves of the order of US $ 1.8 billion on a balance of payments basis (i.e., excluding valuation effects).
India’s foreign exchange reserves were US $ 151.6 billion as on March 31, 2006; at this level, they were US $ 10.1 billion higher over end-March 2005 level. This was despite an outgo of US $ 7.1 billion on account of redemption of India Millennium Deposits (IMDs) on December 29, 2005. The Reserve Bank sold foreign exchange aggregating US $ 7.1 billion during December 27-29, 2005 to the State Bank of India (SBI) to meet the IMD redemption. SBI had raised equivalent of US $ 5.5 billion in the year 2000 under the IMD scheme from non-resident deposits and the maturity amount (principal and interest payment) aggregated US $ 7.1 billion.
India holds the fifth largest stock of reserves among the emerging market economies and the sixth largest in the world. The overall approach to the management of India’s foreign exchange reserves in recent years reflects the changing composition of the balance of payments and the ‘liquidity risks’ associated with different types of flows and other requirements. Taking these factors into account, India’s foreign exchange reserves continued to be at a comfortable level and consistent with the rate of growth, the share of external sector in the economy and the size of risk-adjusted capital flows.
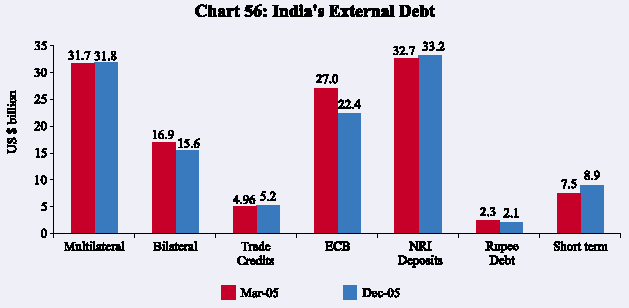
External Debt
India’s total external debt declined by US $ 4.0 billion (3.3 per cent) during April-December 2005 to US $ 119.2 billion at end-December 2005. The decline primarily reflected the redemption of the IMDs which more than offset higher recourse to normal commercial borrowings (Chart 56).
The ratios of short-term to total debt and short-term debt to foreign exchange reserves at end-December 2005 remained modest, notwithstanding some increase during the period. India’s foreign exchange reserves exceeded the external debt by 15.1 per cent at end-December 2005. The share of concessional debt continued to be a significant proportion of the total external debt, especially by international standards. The decline in the recent period reflects a gradual increase in non-concessional private debt (Table 54).
|
Table 54: Indicators of Debt Sustainability |
|||
|
(Per cent) |
|||
|
Indicator |
March 2004 |
March 2005 |
December 2005 |
|
1 |
2 |
3 |
4 |
|
Concessional debt/Total debt |
36.1 |
33.3 |
32.7 |
|
Short-term/Total debt |
4.0 |
6.1 |
7.5 |
|
Short-term debt/Reserves |
3.9 |
5.3 |
6.5 |
|
Reserves/Total debt |
101.1 |
114.8 |
115.1 |
Page Last Updated on:


