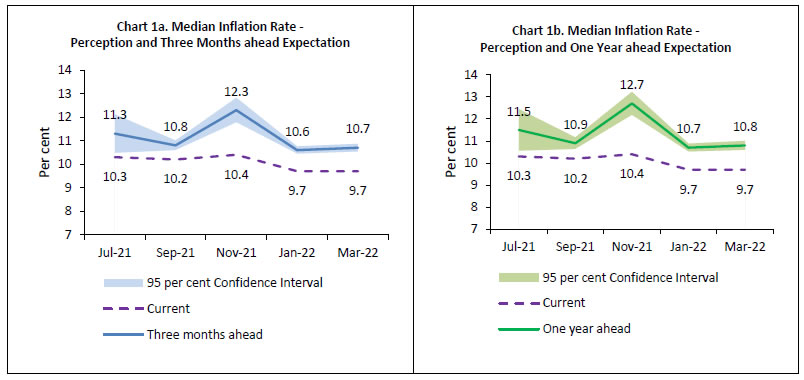
Today, the Reserve Bank released the results of the March 2022 round of the Inflation Expectations Survey of Households (IESH)12. The survey was conducted during March 2 to 11, 2022 in 19 major cities3. The results are based on responses from 6,033 urban households.
Highlights:
Households’ median inflation perceptions for the current period remained unchanged at 9.7 per cent in the latest survey round, while the expectations for both three months and one year ahead rose by 10 basis points each to 10.7 per cent and 10.8 per cent, respectively, as compared to January 2022 round [Charts 1a and 1b; Table 3].
For a majority of population and age groups, uncertainty in inflation expectations increased for both three months and one year horizons, as compared to the previous survey round [Tables 1(a), 1(b) and 2].
Three months ahead expectations for overall prices and inflation were generally aligned to those for food and non-food products, while one year ahead expectations were more aligned to those for non-food products and services [Table 4].
Table 1(a): Product-wise Expectations of Prices for Three Months ahead
(Percentage of Respondents)
Survey period ended
Mar-21
Sep-21
Nov-21
Jan-22
Mar-22
General
Estimate
SE
Estimate
SE
Estimate
SE
Estimate
SE
Estimate
SE
Prices will increase
86.6
0.74
84.9
0.76
89.3
0.64
85.6
0.68
89.9
0.64
Price increase more than current rate
58.3
1.14
61.5
1.14
66.9
1.16
61.4
1.07
67.2
1.27
Price increase similar to current rate
24.2
0.94
19.9
0.88
19.2
0.94
20.5
0.87
19.3
0.96
Price increase less than current rate
4.1
0.50
3.5
0.40
3.3
0.41
3.7
0.40
3.5
0.45
No changes in prices
11.1
0.71
12.9
0.71
8.2
0.55
12.0
0.64
8.6
0.59
Decline in prices
2.3
0.29
2.2
0.29
2.5
0.30
2.4
0.30
1.5
0.22
Food Product
Prices will increase
85.2
0.70
84.8
0.73
86.0
0.70
83.7
0.71
89.6
0.62
Price increase more than current rate
61.1
1.01
61.3
1.08
63.6
1.16
61.0
1.01
68.2
1.14
Price increase similar to current rate
18.2
0.81
18.3
0.80
17.2
0.82
17.0
0.78
16.2
0.88
Price increase less than current rate
5.9
0.55
5.3
0.50
5.2
0.46
5.7
0.47
5.2
0.48
No changes in prices
9.3
0.60
10.7
0.64
8.2
0.51
10.5
0.58
6.9
0.51
Decline in prices
5.5
0.45
4.4
0.40
5.9
0.46
5.8
0.45
3.5
0.36
Non- Food Product
Prices will increase
81.0
0.78
82.1
0.81
86.3
0.67
80.4
0.73
88.4
0.63
Price increase more than current rate
56.9
0.99
58.7
1.14
62.5
1.17
55.4
1.02
65.6
1.17
Price increase similar to current rate
19.5
0.76
18.3
0.82
18.8
0.85
19.4
0.80
17.6
0.87
Price increase less than current rate
4.6
0.42
5.1
0.44
4.9
0.48
5.6
0.46
5.2
0.49
No changes in prices
12.8
0.69
13.6
0.72
8.9
0.54
14.1
0.64
8.7
0.56
Decline in prices
6.2
0.48
4.3
0.42
4.8
0.43
5.4
0.43
2.9
0.31
Household Durables
Prices will increase
68.1
0.91
67.3
0.96
68.6
0.90
69.9
0.88
73.5
0.89
Price increase more than current rate
45.9
0.98
46.4
1.08
47.7
1.11
48.6
1.03
51.9
1.20
Price increase similar to current rate
17.8
0.74
16.3
0.77
16.0
0.77
16.2
0.70
16.0
0.83
Price increase less than current rate
4.4
0.44
4.6
0.43
4.9
0.44
5.1
0.45
5.5
0.50
No changes in prices
24.6
0.84
25.0
0.86
22.7
0.82
23.1
0.82
20.4
0.83
Decline in prices
7.3
0.50
7.7
0.53
8.7
0.54
7.0
0.45
6.1
0.44
Cost of Housing
Prices will increase
69.0
0.93
68.8
0.95
74.3
0.94
71.5
0.88
75.8
0.94
Price increase more than current rate
48.4
1.03
49.6
1.07
55.1
1.16
51.3
1.07
54.9
1.23
Price increase similar to current rate
16.8
0.74
15.2
0.77
15.6
0.78
16.1
0.74
16.6
0.80
Price increase less than current rate
3.8
0.40
3.9
0.42
3.7
0.39
4.2
0.42
4.3
0.40
No changes in prices
22.1
0.85
21.8
0.85
19.0
0.82
21.3
0.80
18.9
0.86
Decline in prices
8.9
0.54
9.4
0.58
6.7
0.50
7.2
0.48
5.4
0.46
Cost of Services
Prices will increase
75.6
0.89
73.3
0.93
76.5
0.86
74.3
0.83
76.3
0.88
Price increase more than current rate
51.6
1.02
52.1
1.09
53.9
1.19
51.6
1.05
54.5
1.19
Price increase similar to current rate
19.5
0.78
16.9
0.75
17.6
0.80
18.0
0.79
16.8
0.80
Price increase less than current rate
4.5
0.44
4.4
0.41
5.0
0.49
4.6
0.43
5.0
0.47
No changes in prices
20.7
0.84
23.7
0.90
20.2
0.80
22.3
0.78
21.2
0.86
Decline in prices
3.7
0.36
3.0
0.33
3.3
0.34
3.4
0.34
2.4
0.29
Note: 1. The table provides estimates and standard errors for qualitative responses.
2. Constituent items may not add up to the corresponding total, due to rounding off.
Table 1(b): Product-wise Expectations of Prices for One Year ahead
(Percentage of Respondents)
Survey period ended
Mar-21
Sep-21
Nov-21
Jan-22
Mar-22
General
Estimate
SE
Estimate
SE
Estimate
SE
Estimate
SE
Estimate
SE
Prices will increase
88.6
0.61
87.6
0.72
90.4
0.59
89.6
0.58
91.5
0.58
Price increase more than current rate
63.2
1.06
66.3
1.09
70.5
1.15
68.2
1.05
71.0
1.19
Price increase similar to current rate
21.5
0.86
18.1
0.85
16.7
0.91
18.1
0.81
17.4
0.93
Price increase less than current rate
3.9
0.44
3.3
0.36
3.3
0.39
3.3
0.39
3.1
0.41
No changes in prices
8.5
0.54
9.4
0.61
6.4
0.46
7.8
0.50
6.1
0.48
Decline in prices
2.8
0.32
3.0
0.35
3.1
0.35
2.6
0.29
2.4
0.29
Food Product
Prices will increase
81.6
0.73
81.5
0.79
84.5
0.74
83.8
0.71
85.3
0.72
Price increase more than current rate
54.5
1.00
57.2
1.11
60.2
1.20
58.2
1.06
60.9
1.19
Price increase similar to current rate
22.2
0.83
19.6
0.89
19.9
0.92
20.4
0.86
19.6
0.91
Price increase less than current rate
4.9
0.45
4.7
0.45
4.4
0.42
5.2
0.45
4.8
0.47
No changes in prices
12.0
0.61
11.9
0.65
9.4
0.57
10.9
0.61
9.8
0.59
Decline in prices
6.3
0.45
6.6
0.47
6.1
0.47
5.3
0.40
5.0
0.41
Non- Food Product
Prices will increase
79.9
0.79
81.4
0.81
85.1
0.72
82.9
0.72
85.8
0.73
Price increase more than current rate
53.8
1.01
57.8
1.12
61.7
1.20
57.5
1.09
62.4
1.18
Price increase similar to current rate
21.5
0.83
19.5
0.84
19.0
0.87
20.5
0.86
18.9
0.89
Price increase less than current rate
4.6
0.43
4.1
0.40
4.4
0.45
4.9
0.44
4.5
0.44
No changes in prices
13.4
0.66
13.3
0.71
9.5
0.56
12.0
0.61
9.7
0.60
Decline in prices
6.7
0.47
5.3
0.42
5.4
0.43
5.0
0.41
4.5
0.40
Household Durables
Prices will increase
70.3
0.90
71.4
0.98
75.0
0.87
75.4
0.87
77.3
0.84
Price increase more than current rate
47.1
0.97
49.3
1.09
52.3
1.16
52.1
1.07
54.1
1.16
Price increase similar to current rate
18.9
0.73
17.5
0.83
18.2
0.85
18.7
0.81
18.3
0.89
Price increase less than current rate
4.4
0.42
4.5
0.45
4.5
0.45
4.6
0.45
4.8
0.48
No changes in prices
22.7
0.80
22.4
0.89
18.0
0.75
18.5
0.77
17.1
0.74
Decline in prices
7.0
0.48
6.2
0.46
7.0
0.48
6.1
0.44
5.6
0.43
Cost of Housing
Prices will increase
75.7
0.86
76.4
0.87
82.4
0.77
79.3
0.78
83.1
0.75
Price increase more than current rate
53.7
1.03
55.1
1.08
60.6
1.15
57.0
1.03
61.1
1.17
Price increase similar to current rate
18.4
0.79
16.8
0.80
17.9
0.86
18.1
0.78
17.6
0.88
Price increase less than current rate
3.6
0.38
4.5
0.42
3.9
0.40
4.2
0.43
4.5
0.43
No changes in prices
17.8
0.75
17.4
0.78
12.8
0.67
15.1
0.66
13.2
0.67
Decline in prices
6.5
0.48
6.2
0.47
4.9
0.41
5.6
0.43
3.7
0.36
Cost of Services
Prices will increase
81.4
0.74
79.8
0.84
83.6
0.73
82.0
0.75
83.0
0.79
Price increase more than current rate
55.1
1.01
56.6
1.14
59.5
1.20
57.5
1.04
59.2
1.25
Price increase similar to current rate
21.6
0.81
18.9
0.85
19.1
0.88
19.8
0.81
18.8
0.93
Price increase less than current rate
4.7
0.43
4.3
0.43
5.0
0.46
4.6
0.44
5.0
0.47
No changes in prices
15.1
0.66
16.6
0.76
13.3
0.65
15.1
0.68
14.1
0.71
Decline in prices
3.5
0.35
3.6
0.38
3.1
0.34
3.0
0.31
3.0
0.32
Note: 1. The table provides estimates and standard errors for qualitative responses.
2. Constituent items may not add up to the corresponding total, due to rounding off.
Table 2: Inflation Expectations of Various Groups: Mar-22
Current Perception
Three Months ahead Expectation
One Year ahead Expectation
Mean
Median
Mean
Median
Mean
Median
Estimate
SE
Estimate
SE
Estimate
SE
Estimate
SE
Estimate
SE
Estimate
SE
Overall
9.8
0.12
9.7
0.31
11.1
0.12
10.7
0.09
10.9
0.13
10.8
0.11
Gender-wise
Male
10.1
0.15
10.1
0.11
11.4
0.15
11.0
0.28
11.2
0.17
11.4
0.47
Female
9.6
0.16
9.2
0.37
10.9
0.16
10.5
0.10
10.7
0.18
10.6
0.12
Category-wise
Financial Sector Employees
9.2
0.53
7.9
0.66
10.6
0.56
9.4
0.76
11.0
0.61
10.7
0.70
Other Employees
9.9
0.21
9.8
0.41
11.2
0.20
10.8
0.21
11.0
0.24
11.1
0.41
Self Employed
10.5
0.25
10.3
0.12
11.8
0.24
12.0
0.71
11.3
0.28
12.0
0.70
Homemaker
9.8
0.18
9.7
0.39
11.0
0.18
10.6
0.12
10.8
0.21
10.7
0.15
Retired Persons
10.7
0.44
10.5
0.22
11.8
0.43
11.8
0.93
12.0
0.44
12.6
1.17
Daily Workers
10.0
0.28
9.8
0.36
11.1
0.28
10.7
0.28
10.9
0.33
11.0
0.54
Other category
9.1
0.23
8.2
0.36
10.5
0.24
10.2
0.22
10.6
0.27
10.4
0.22
Age Group-wise
Up to 25 years
9.0
0.19
8.3
0.31
10.4
0.20
10.1
0.23
10.6
0.23
10.5
0.18
25 to 30 years
9.8
0.22
9.4
0.45
11.1
0.22
10.7
0.23
10.9
0.25
11.0
0.45
30 to 35 years
9.7
0.22
9.1
0.49
11.2
0.21
10.7
0.21
11.1
0.25
11.0
0.39
35 to 40 years
10.1
0.21
10.1
0.21
11.4
0.21
11.0
0.30
11.1
0.24
10.9
0.35
40 to 45 years
10.0
0.24
10.1
0.21
11.2
0.25
10.8
0.24
10.7
0.30
11.0
0.49
45 to 50 years
10.0
0.26
9.9
0.35
11.3
0.25
10.9
0.46
10.8
0.31
10.8
0.36
50 to 55 years
10.3
0.28
10.1
0.30
11.4
0.27
11.0
0.41
11.0
0.34
11.2
0.64
55 to 60 years
10.3
0.34
10.0
0.38
11.5
0.34
11.4
0.69
11.3
0.38
11.2
0.90
60 years and above
10.5
0.30
10.3
0.16
11.5
0.29
11.0
0.49
11.5
0.33
11.8
0.78
City-wise
Ahmedabad
8.7
0.65
7.0
0.77
10.1
0.67
8.6
1.03
10.4
0.64
9.5
1.04
Bengaluru
9.9
0.28
10.2
0.25
11.4
0.30
11.2
0.67
11.1
0.34
12.2
1.09
Bhopal
8.6
0.68
7.6
1.57
10.0
0.62
9.8
1.48
9.3
0.61
9.6
1.15
Bhubaneswar
5.4
0.52
5.2
0.55
7.3
0.60
7.1
0.76
8.4
0.59
8.1
0.63
Chennai
10.1
0.44
10.3
0.27
11.5
0.41
11.3
0.71
11.8
0.42
13.8
1.39
Delhi
9.7
0.25
9.7
0.47
10.9
0.29
10.5
0.22
10.7
0.36
10.8
0.52
Guwahati
6.6
0.37
6.1
0.37
7.2
0.45
6.9
0.54
7.8
0.75
7.6
0.84
Hyderabad
11.8
0.62
12.4
2.24
13.6
0.48
15.9
0.36
13.2
0.47
16.0
0.27
Jaipur
9.1
0.47
8.8
0.56
10.1
0.52
10.0
0.48
9.4
0.48
9.7
0.56
Jammu
9.6
0.65
9.7
0.72
9.9
0.67
9.6
0.87
8.6
0.86
8.7
1.02
Kolkata
10.4
0.35
10.3
0.19
11.8
0.32
11.9
0.59
11.6
0.35
12.2
0.81
Lucknow
10.6
0.57
10.1
0.41
11.3
0.46
10.9
0.85
10.2
0.59
10.2
0.45
Mumbai
10.3
0.27
9.5
0.43
11.5
0.28
10.8
0.33
11.0
0.33
11.0
0.43
Nagpur
10.3
0.65
9.6
0.95
11.8
0.60
11.8
1.52
11.3
0.64
11.8
1.39
Patna
8.4
0.55
8.1
0.56
9.6
0.80
9.3
0.76
9.4
0.83
9.4
0.75
Thiruvananthapuram
6.0
0.55
5.2
0.44
7.9
0.58
7.2
0.60
9.2
0.80
8.6
1.04
Chandigarh
10.8
0.66
10.0
0.43
11.4
0.76
10.7
1.02
10.5
0.99
10.2
1.12
Ranchi
7.3
0.35
6.6
0.23
8.0
0.35
7.5
0.43
8.2
0.38
8.2
0.25
Raipur
7.0
0.48
6.2
0.56
7.3
0.59
6.8
0.82
6.9
0.95
6.9
1.28
Note: The table provides estimates and standard errors for quantitative responses.
Table 3: Household Inflation Expectations – Current Perception, Three Months and One Year Ahead Expectations
Current Perception
Three Months ahead Expectation
One Year ahead Expectation
Mean
Median
Mean
Median
Mean
Median
Estimate
SE
Estimate
SE
Estimate
SE
Estimate
SE
Estimate
SE
Estimate
SE
Mar-21
9.4
0.11
8.8
0.15
10.4
0.11
10.1
0.12
10.0
0.12
10.2
0.09
Sep-21
10.4
0.11
10.2
0.06
11.4
0.11
10.8
0.11
10.8
0.13
10.9
0.14
Nov-21
10.7
0.11
10.4
0.05
11.9
0.11
12.3
0.27
11.5
0.12
12.7
0.27
Jan-22
9.9
0.10
9.7
0.28
11.1
0.10
10.6
0.08
10.7
0.11
10.7
0.09
Mar-22
9.8
0.12
9.7
0.31
11.1
0.12
10.7
0.09
10.9
0.13
10.8
0.11
Note: The table provides estimates and standard errors for quantitative responses.
Table 4: Households Expecting General Price Movements in Coherence with Movements in Price Expectations of Various Product Groups: Three Months Ahead and One Year Ahead
(Percentage of Respondents)
Survey period ended
Food
Non-Food
Household durables
Housing
Cost of services
Three Months Ahead
Mar-21
67.1
65.9
57.5
58.9
65.3
Sep-21
68.8
69.1
59.5
60.2
66.7
Nov-21
69.8
70.5
59.0
63.4
65.7
Jan-22
66.8
65.8
60.5
61.7
66.0
Mar-22
70.5
70.8
60.2
62.0
65.8
One Year Ahead
Mar-21
69.7
70.2
62.5
65.8
71.8
Sep-21
71.3
72.9
64.9
67.1
73.8
Nov-21
73.8
74.8
66.2
70.4
73.2
Jan-22
71.7
72.4
65.2
67.5
72.9
Mar-22
73.1
74.2
67.5
69.4
74.4
Note: Figures are based on sample observations
Table 5(a): Cross-tabulation of Number of Respondents by Current Inflation Perception and Three Months Ahead Inflation Expectations: Mar-22
Three Months Ahead Inflation Rate (per cent)
Current Inflation Rate (per cent)
<1
1-<2
2-<3
3-<4
4-<5
5-<6
6-<7
7-<8
8-<9
9-<10
10-<11
11-<12
12-<13
13-<14
14-<15
15-<16
>=16
No idea
Total
<1
12
3
3
2
0
0
0
0
0
0
2
0
0
0
0
0
0
0
22
1-<2
0
16
14
8
0
2
0
0
0
0
0
0
0
0
0
0
0
0
40
2-<3
0
5
70
42
33
13
3
0
2
0
2
0
0
0
0
0
0
0
170
3-<4
0
3
3
47
50
44
20
6
1
2
1
0
0
0
0
0
0
0
177
4-<5
0
0
5
8
88
83
67
18
8
1
5
2
1
0
0
0
0
0
286
5-<6
0
0
9
14
23
329
163
216
86
14
137
2
5
1
0
14
5
0
1018
6-<7
0
0
1
4
2
8
117
97
77
24
26
4
6
1
5
4
0
0
376
7-<8
0
0
0
2
1
3
8
134
104
59
72
7
14
3
8
4
1
0
420
8-<9
1
1
2
0
3
3
3
3
134
68
140
15
34
11
2
9
6
0
435
9-<10
0
0
0
0
0
2
2
1
4
59
55
27
24
4
8
6
6
0
198
10-<11
0
0
1
0
3
25
3
9
8
12
357
64
185
50
27
296
150
2
1192
11-<12
0
1
0
0
0
0
0
0
0
2
1
6
7
2
2
4
4
0
29
12-<13
0
0
0
0
0
0
0
0
1
0
3
0
33
8
11
30
16
0
102
13-<14
0
0
0
0
0
1
0
0
0
0
0
1
0
4
6
8
7
0
27
14-<15
0
0
0
0
0
0
0
0
0
0
0
0
0
0
6
6
13
0
25
15-<16
0
0
0
0
0
1
0
0
0
0
3
0
1
1
0
86
176
1
269
>=16
0
0
1
0
0
4
1
0
2
1
20
0
2
0
0
24
1191
1
1247
Total
13
29
109
127
203
518
387
484
427
242
824
128
312
85
75
491
1575
4
6033
Note: Figures are based on sample observations
Table 5(b): Cross-tabulation of Number of Respondents by Current Inflation Perception and One Year Ahead Inflation Expectations: Mar-22
One Year Ahead Inflation Rate (per cent)
Current Inflation Rate (per cent)
<1
1-<2
2-<3
3-<4
4-<5
5-<6
6-<7
7-<8
8-<9
9-<10
10-<11
11-<12
12-<13
13-<14
14-<15
15-<16
>=16
No idea
Total
<1
10
3
2
1
1
3
0
0
0
0
0
0
0
0
0
0
2
0
22
1-<2
9
4
11
6
3
5
2
0
0
0
0
0
0
0
0
0
0
0
40
2-<3
20
2
42
28
35
23
9
3
5
0
0
0
0
0
0
1
2
0
170
3-<4
22
0
1
29
28
42
19
14
11
2
7
0
1
0
0
0
1
0
177
4-<5
30
0
0
4
56
61
55
26
21
14
13
1
4
0
0
0
1
0
286
5-<6
85
0
1
8
7
219
106
178
117
32
162
7
12
9
5
34
36
0
1018
6-<7
23
0
0
3
0
8
77
62
90
36
41
5
17
3
0
8
3
0
376
7-<8
31
0
1
0
1
3
3
84
65
63
98
12
24
3
8
12
11
1
420
8-<9
33
0
0
0
0
2
3
3
85
52
131
27
43
11
6
16
23
0
435
9-<10
13
0
0
0
0
0
1
2
3
42
37
28
31
6
11
18
6
0
198
10-<11
104
0
0
0
1
7
4
4
9
11
235
41
126
41
21
289
298
1
1192
11-<12
4
0
0
1
0
0
0
0
0
1
2
4
3
2
2
7
3
0
29
12-<13
7
0
0
0
0
0
0
0
0
0
2
0
26
6
10
22
29
0
102
13-<14
1
0
0
0
0
0
0
0
0
0
0
0
0
5
2
11
8
0
27
14-<15
3
0
0
0
0
0
0
0
0
0
0
0
0
0
4
2
16
0
25
15-<16
16
0
0
0
0
0
0
0
0
0
6
0
1
0
1
46
199
0
269
>=16
109
0
0
0
0
1
0
0
0
0
14
0
1
0
0
18
1102
2
1247
Total
520
9
58
80
132
374
279
376
406
253
748
125
289
86
70
484
1740
4
6033
Note: Figures are based on sample observations
1 The survey results reflect the respondents’ views, which are not necessarily shared by the Reserve Bank. Results of the previous survey round were released on the Bank’s website on February 10, 2022.
2 The survey is conducted at bi-monthly intervals by the Reserve Bank of India. It provides directional information on near-term inflationary pressures as expected by the respondents and may reflect their own consumption patterns. Hence, they should be treated as households’ sentiments on inflation.
3 These results include Jammu as the new survey centre, which constitutes 1.6 per cent of respondents in the latest survey round. The results for all the 19 cities, including Jammu, from the March 2021 through March 2022 rounds are released in the attached excel file and the same is also updated in the respective tables as applicable.