 IST,
IST,


RBI WPS (DEPR): 05/2024: Livestock and Poultry Inflation in India: A Study of Milk, Poultry Meat and Eggs
|
RBI Working Paper Series No. 05 Livestock and Poultry Inflation in India: A Study of Milk, Poultry Meat and Eggs Shyma Jose, Manish Kumar Prasad, Sabarni Chowdhury, Binod B. Bhoi, Vimal Kishore, Himani Shekhar, and Ashok Gulati1 Abstract This paper uses primary survey-based information from stakeholders and secondary data to construct monthly balance sheets of the dairy and poultry products incorporating supply-demand factors for analysing their price dynamics. The study assesses the value chain of these commodities and estimates farmers’ share in the consumer rupee, which works out to 70 per cent for milk and 75 per cent for eggs; for poultry meat, the share of farmers and aggregators taken together is 56 per cent. Further, the paper empirically investigates the relationship between availability/availability to usage ratio derived from the balance sheet and dairy/ poultry products prices by employing Autoregressive Distributed Lag (ARDL) models. The empirical analysis suggests a significant negative relationship between availability/ availability to usage ratio and consumer price index (CPI) of these commodities controlling for input costs. The forecasting analysis indicates a generally superior performance of the Seasonal Autoregressive Integrated Moving Average with Exogenous Variables (SARIMAX) models, incorporating the relevant balance sheet variables, over different forecast horizons. This underscores the importance of balance sheet analysis for understanding the price dynamics of dairy/poultry products and for designing appropriate policies to contain their price volatility. JEL Classification: E31, E37, E52, Q11 Keywords: Balance sheet, chicken, eggs, forecast, inflation, milk, poultry, SARIMAX, stock, survey, value chain Introduction The Reserve Bank of India (RBI) adopted a flexible inflation targeting (FIT) framework in 2016, under which the inflation target is defined in terms of headline Consumer Price Index (CPI) inflation of 4 per cent with a tolerance band of +/-2 per cent. Food inflation significantly impacts the headline inflation dynamics in India as the food and beverages group constitutes almost 46 per cent of the weight in the CPI basket. Moreover, as food prices exhibit high volatility owing to supply shocks and dependence on monsoon, they also impart significant volatility to headline inflation. A better understanding of the drivers of food inflation and its likely trajectory is, therefore, crucial for the conduct of forward-looking monetary policy and for the achievement of the inflation target on an ongoing basis. However, shocks such as the COVID-19 pandemic, Russia-Ukraine conflict and climate change further make it cumbersome to predict inflation accurately. The three livestock commodities - milk, poultry meat, and eggs – collectively form a major part of animal protein-rich items in the CPI basket with a combined weight of 8.1 per cent. Livestock, particularly milk, prices witnessed an intermittently rising trend over the last few years reflecting growing demand due to robust economic growth, rising per capita income and increased input cost pressures in recent years, especially of feed and fodders. Unlike agricultural crops, inflation in these commodities could be more persistent reflecting structural factors like shifts in consumption in line with income growth and transformation in the value chains. The livestock sector is an important sub-sector of agriculture which plays a significant role in generating gainful employment in the rural sector, particularly among the landless, small and marginal farmers and women. India has vast resources of livestock and poultry population which counts at more than 537 million and 852 million, respectively, as per the 20th Livestock Census (2019)2. In the last two decades, agricultural diversification in favour of livestock sector has grown significantly as the sector generates more income per unit of area in comparison to food grains, oilseeds and sugar combined. The Government has also launched several initiatives like National Livestock Mission, Innovative Poultry Productivity Project, Operation Flood, Rashtriya Gokul Mission, Integrated Dairy Development Scheme, and the National Dairy Plan to enhance livestock productivity and value chain efficiency. Consequently, there has been a significant growth in the value of output from the livestock sector – the contribution of livestock in total agriculture and allied sector rose from 25.6 per cent in 2011-12 to 31.2 per cent 2021-22 (as per the gross value of output at current prices)3. The dairy and poultry (meat and eggs) sector value chains in India are, however, very diverse and complex, each with its own set of stakeholders and dynamics. The poultry sector encompasses both commercial and backyard farming models, with the former focusing on large scale operations for market consumption. In contrast, the latter is common among small farmers for personal consumption. The poultry value chain includes breeding, hatching and farming stages. Integrator and direct farmer models are prevalent for commercial poultry meat production. The value chain of eggs involves structured cycles of production by layer birds, with commercial eggs marketed through various channels. Similarly, the dairy sector is characterised by a mix of cooperatives and private players, with value chains encompassing procurement, processing, and marketing stages. The sector's dominance lies in liquid milk, followed by dairy products and ghee. Even though the value of output has grown significantly in animal protein-rich items, especially milk, poultry meat and eggs, these items have witnessed price spikes during the post COVID-19 period. Given the high weightage of these items in the food basket as well as high volatility in their prices in recent years, these items contributed significantly to food and headline inflation in the post-pandemic period. Against this backdrop, understanding livestock and poultry market dynamics and factors determining their prices assume significant importance. Therefore, this study aims to contribute to the literature on livestock and poultry inflation in India by providing a framework for understanding the price formation process by identifying factors that affect prices and comprehending the players in the value chain and decoding the way their behaviour influences market supply and demand at any given point in time. In this regard, this paper proposes a novel methodology to construct monthly balance sheets for the three selected livestock and poultry commodities and use those for modelling and forecasting livestock and poultry prices in India. Understanding the determinants of livestock and poultry prices may provide insights to formulate policies aimed at sustaining the growth of the sector while maintaining price stability. Accordingly, the main objectives of the study are:
The study assesses the value chain of milk, poultry meat and eggs, and the roles of various stakeholders involved for computing monthly balance sheet variables to analyse price dynamics and for identifying measures to mitigate volatility in livestock and poultry production and inflation. The study finds that, on an average, 70 per cent and 75 per cent of the consumer rupee goes back to the dairy and egg farmers, respectively, whereas 56 per cent of the consumer rupee goes back to the farmers and integrators taken together in the poultry meat value chain. The study employs the balance sheet method to generate monthly net availability/ availability usage ratios for the three livestock/ poultry commodities that reflect demand and supply through the examination of inventory levels, production, consumption, trade and survey-based information. The balance sheet variable is then used in an Autoregressive Distributed Lag (ARDL) model for each commodity to study the underlying price dynamics controlling for input costs. The regression results show a statistically significant inverse relationship between net availability/availability to usage ratios and consumer price index (CPI) of milk, poultry meat and eggs, while feed and fodder costs impact their prices positively. The study further attempts to forecast inflation for milk, poultry meat and eggs over a 12-month horizon using univariate and multivariate time-series methodologies integrating variables which are identified as significant in the ARDL model. The forecasting analysis generally indicates a superior performance of the SARIMAX model incorporating the balance sheet variable compared to other models, over different forecast horizons. Drawing from the research outcomes, the study offers policy suggestions aimed at improving the dairy and poultry value chains to mitigate inflation in livestock and poultry items. The remainder of the paper is organised into seven sections. Section II provides a brief review of literature identifying gaps in the Indian context. Section III covers various data sources available in India, which can be utilised to analyse livestock and poultry price dynamics. Section IV presents the stylised facts about inflation in livestock and poultry products including trend and seasonality of their prices. Additionally, the section discusses in detail various supply side factors impacting livestock inflation. Section V discusses value chain of milk, poultry meat and eggs. Section VI explores the balance sheet approach and dwells upon the computation of net availability/availability to usage ratio variable. Section VII demonstrates the methodological framework and discusses structural factors which influence livestock and poultry prices as well as the forecasting performance of the alternative models. Section VIII concludes and provides policy suggestions to contain inflation in milk, poultry meat and eggs. Understanding the drivers of commodity-specific inflation is important to generate accurate inflation forecasts for the conduct of monetary policy. The determinants of food inflation have been empirically analysed by a number of studies. Gopakumar and Pandit (2017) found that items like pulses, fruits, vegetables, eggs, meat, fish and milk are not only driven by supply-side factors, but also by demand factors such as the rate of growth of real income, money supply and relative prices. Nair and Eapen (2012) emphasised that the persistent inflation in high-value commodities such as pulses, milk, meat, and fruits and vegetables with an income elastic demand is due to structural factors i.e., poor supply response to rapidly increasing demand. Chand et al. (2011) examined how various supply shocks like drought contribute to inflation in food commodities including livestock. They have noted that as the frequency of such shocks is expected to rise, India needs to have an effective food management strategy to deal with these shocks. There are also studies that have exclusively analysed price dynamics and forecasting of inflation in the livestock sector. Elliot and Dale (1980) examined the impact of changes in aggregate income, prices of close substitutes (pork and beef) and cost variables like the price of corn and soybean meal in both the short run and long run, on the US poultry sector. They found that an increase in feed costs decreases broiler production and as a result, broiler prices rise. Westcott et al. (1987) developed a model incorporating both behavioural and biological factors to forecast US egg prices in the short and medium-term for policy analysis. The paper derived feed cost, income and broiler price multiplier to show their effect on egg prices and found that a change in disposable income directly impacts demand for broiler meat and indirectly affects egg prices. As income rises, demand for broiler meat rises which increases broiler production - a 10 per cent rise in broiler production results in a change in egg production by 1 per cent, which in turn affects its price. Weimar et al. (1990) estimated an annual econometric model of the livestock and poultry sector and used it as a basis for a dynamic simulation model. Their results indicated that for a given rise in feed cost, broiler per capita consumption falls less than other meat items like pork and turkey. Broilers are better converters of feed while pork and turkey are less efficient and, therefore, the impact on broiler prices is less than pork and turkey. Milk prices can also be forecasted from a supply chain management perspective, as discussed by Kussaiynor et al., (2019) for Northern Kazakhstan. They built a model of chain price index for the period from 2010 to 2018 to estimate seasonal ups and downs in the price dynamics of milk. They showed that the degree of deviation of milk prices estimated from the model from actual prices did not exceed 3 per cent and the model can effectively be used by farms for the effective organisation of production and sales process, taking into account the seasonal characteristics in the behaviour of the market. Gandhi and Zhou (2010) found that the demand for milk and milk products also have high sensitivity to changes in income (proxied by expenditure) in India. Therefore, according to them, inflationary pressures in milk since 2005 can be attributed mainly to its increasing demand which has outpaced the increases in its production. Abdallah, et al. (2020) assessed the monthly price transmission between farmers and retailers of dairy products in Hungary where the long and short-run asymmetric transmission between price levels was measured using a nonlinear ARDL (NARDL) model. The estimated NARDL model proved the existence of long and short-run asymmetric relationships between producer milk prices and retailer dairy product prices. Zmami and Ben-Salha (2019) conducted aggregated and disaggregated analyses to find the impact of Brent and West Texas Intermediate (WTI) oil prices on international food prices using linear and nonlinear ARDL models. The results suggest the presence of asymmetries in the relationship between oil prices and food prices in the long run. The dairy price index reacted to both positive and negative changes in oil prices, with the impact of oil price increases being greater. There is a growing interest in forecasting accurately food and agricultural commodity-specific inflation due to its significant impact on overall headline inflation in developing countries. Models such as autoregressive integrated moving average (ARIMA), seasonal autoregressive integrated moving average (SARIMA), ARIMA/ SARIMA with exogenous variables (ARIMAX/SARIMAX), random walk (RW), vector autoregression (VAR), VAR with exogenous variables (VAR-X), Bayesian VAR (BVAR), models with Generalised Autoregressive Conditional Heteroscedasticity (GARCH) and Phillips curve are used to forecast inflation, but no single model either univariate or multivariate has been found to be superior in accuracy (John et al., 2020; Griessel, 2015; Benes et al., 2016; Aiolfi and Timmerman, 2006; and Behera et al., 2018). Also, researchers have highlighted the effectiveness of using an exogenous variable to improve forecast performance in a simple time-series estimation model, as demonstrated by Bhattacharya and Sengupta (2018). Shyian et al. (2021) used an ARIMA model to forecast milk prices for a period of 6 months in Ukraine, considering time lag and the share of milk prices in the sale price of finished dairy products. Atalan (2023) attempted to forecast milk prices in Turkiye using machine learning algorithms. Wickramarachchi et al., (2017) utilised time-series data and econometric models such as ARIMA and SARIMA to forecast weekly real prices of various poultry products in Sri Lanka. The findings indicated that nominal price increased due to inflation, but real prices of these products remained stagnant over time. Ihsan et al. (2022) created a prediction system for the prices of basic commodities on major holidays in Indonesia, such as Eid al-Fitr, Christmas, New Year, Chinese New Year, and Eid al-Adha, using the multi-layer perceptron (MLP) method. Monitoring and predicting the prices of basic commodities during major holidays, as they often experience sharp fluctuations, the study found that eggs are particularly prone to significant price increases during these holidays. The authors emphasised on the MLP method which can accurately predict time-series data experiencing significant fluctuations. In the Indian context, there is not much work on modelling the price dynamics of the livestock and poultry sectors. This study aims to fill this gap by analysing the market dynamics of these sectors and their value chains, identifying factors affecting prices of milk, poultry meat and eggs, and building a model for forecasting their inflation. It introduces a novel framework to generate monthly balance sheet (availability/stocks) to understand their price dynamics and uses it in a modelling framework to examine its role in explaining price movements of these commodities as well as to generate short-term inflation forecasts. Drawing from the literature and based on the empirical findings and value chain analysis of the study, it offers some policy suggestions. The present study uses data from both secondary and primary sources for milk, poultry meat and eggs. For secondary data, databases from the Government of India (GoI), state government websites, state agriculture departments and existing literature have been used. The period of analysis for milk is from April 2010 to December 2022, while for eggs and poultry meat is from January 2010 to December 2022 as per data availability from different sources. The study uses the CPI data which is available at the commodity level from the National Statistical Office (NSO), Ministry of Statistics and Programme Implementation (MoSPI), GoI since 2011. For CPI commodity-wise data prior to 2011, commodity-wise CPI-IW data from the Labour Bureau available at the 2001 base year have been used, after splicing the series to the 2011 base year. For empirical analysis, the item level monthly data for CPI milk, poultry meat (i.e., chicken) and eggs have been used4. Wholesale price index (WPI) data are sourced from the Office of Economic Adviser (OEA), Department for Promotion of Industry and Internal Trade, Ministry of Commerce and Industry, GoI. To capture all the dynamic elements of the balance sheet, published reports and government data sources such as ICAR-CIPHET report on farm-level operation losses by Jha et al. (2015), Agricultural Statistics at a Glance (various years), and Agmarknet (various years) for arrival data have also been used. The data on trade has been taken from the Directorate General of Commercial Intelligence and Statistics (DGCI&S) database of the Ministry of Commerce and Industry, and FAOSTAT of the Food and Agriculture Organisation (FAO) of the United Nations. The production data for milk and eggs is from various issues of Basic Animal Husbandry Statistics, GoI. Production and consumption data for poultry meat have been taken from the OECD-FAO Agriculture Outlook 2022-2031. The quinquennial data on per capita consumption of milk and eggs are collected from various rounds of National Sample Survey Office (NSSO) reports. The per capita consumption for the period after 2011-12 has been projected using the behavioural approach of agricultural commodities demand predictions in view of the non-availability of data5. For the primary data or the real-time information, we created a chain of respondents by seeking references from an initial list of experts. This method was useful for comprehending value chains, balance sheet, price dynamics and market behaviour. The data are collated and verified via information collected from a cumulative list of experts and also by interviewing stakeholders like farmers, processors, exporters, traders, distributors, integrators, cooperatives and government officials during the field survey. Using purposive sampling, the study covered the major livestock producing states as well as consumption centres for the survey which include Maharashtra, Gujarat, Haryana, Telangana, Tamil Nadu, Andhra Pradesh, Uttar Pradesh, Punjab and Delhi. The survey was conducted during December 2022 and March 2023 for dairy, and during December 2022 for poultry meat. For eggs, the survey was conducted during April 2021 and December 2022. The details of the field surveys such as sample size, study area, etc., are given in Annex Table A1. There has been a significant growth in the value of output from livestock sector especially dairy, poultry meat and eggs. The contribution of livestock in total agriculture and allied sector rose from 25.6 per cent in 2011-12 to 31.2 per cent in 2021-22. At the same time, the value of output of livestock sector grew on an average by 5.6 per cent per annum while the crop sector registered a growth of 2.1 per cent during 2012-13 to 2021-22 (at constant prices) (Chart 1). Notably, the production of poultry meat has registered double digit growth during the same period (10.1 per cent), followed by eggs (6.2 per cent) and milk (5.5 per cent). Despite such considerable growth in the livestock and poultry sector, their prices have remained volatile. Among the three commodities, milk inflation measured using both WPI and CPI has been relatively less volatile (Chart 2a). This could be due to the organised nature of milk supply chain through milk cooperatives as well as lag in pass-through of input cost pressures, unlike in the poultry sector where the transmission is fast. Notably, the correlation between WPI and CPI milk inflation is high at 0.9. Further, a structural break analysis indicates that CPI milk inflation, which averaged 6.1 per cent during January 2012 to December 2023, had two structural breaks - one in December 2015 and the other in May 2019, which suggests that milk inflation has moved through three different phases (Chart 2b). The first phase (January 2012 to December 2015) observed an average inflation of 9.5 per cent reflecting rapidly rising demand on the back of increases in net disposable income and high-income elasticity of milk. The surging global milk prices and rising feed costs (fodder) for smallholders further added to the inflationary pressure. The second phase (January 2016 to May 2019) had a moderate inflation of 3.2 per cent primarily because of the prolonged level of negative WPI fodder inflation averaging (-)3.7 per cent. The third phase (June 2019 to December 2023) registered an uptick in milk inflation to 5.2 per cent due to a combination of factors such as COVID-19 shock, lumpy skin disease, and a rise in feed and fodder cost, which also resulted in lower procurement by the milk cooperatives. The under-feeding of cattle during the pandemic impacted milk prices due to lower productivity of cattle. Moreover, during April-November 2022, India exported 16,206 tonnes of milk fat, which by reducing domestic availability added to milk inflation. A decomposition of CPI milk inflation into trend and cyclical components suggests that the movement in milk inflation has been generally dominated by the trend component (Chart 2c). The post-pandemic rise in milk inflation was also driven by rising trend inflation. In the case of poultry meat, the co-movement between CPI and WPI inflation is rather weak with a correlation of 0.39 during April 2012-December 2023, which fell further to 0.07 during the pandemic period (March 2020 to December 2022) (Chart 3a). A structural break analysis indicates that the CPI poultry meat inflation, which averaged 7.4 per cent during January 2012 to December 2023, had two structural breaks - one in January 2014 and the other in April 2020 (Chart 3b). Thus, the movement of CPI poultry meat inflation can be divided into three phases - the first phase from January 2012 to January 2014 with an average inflation of 10.3 per cent, the second phase from February 2014 to April 2020 with an average inflation of 4.5 per cent and the third phase from May 2020 to December 2023 with the highest average inflation of 10.9 per cent. Further, a decomposition of the CPI poultry meat inflation illustrates that the trend component largely dominated the movement of CPI inflation during the pandemic, while volatility was also high compared to the past as reflected in the cyclical component (Chart 3c). In the case of eggs, CPI and WPI inflation generally moved together with a correlation of 0.52 during April 2012-December 2023 albeit with a greater volatility in WPI after the pandemic (Chart 4a). CPI egg inflation averaged 6.3 per cent during January 2012 to December 2023 with two structural breaks – one in April 2014 and the other in August 2020 (Chart 4b). Thus, movement in CPI egg inflation can be divided into three phases - the first phase from January 2012 to April 2014 with an average inflation of about 11.7 per cent, the second phase between May 2014 and August 2020 with a moderate inflation of 4.1 per cent, and the third phase between September 2020 and December 2023 which coincided with the pandemic with a higher average inflation of 6.6 per cent, albeit with the egg inflation peaking at 21.7 per cent in October 2020 and 20.8 per cent in July 2021. The high inflation in poultry meat and eggs during phase 1 coincided with the period of high inflation in soya and maize in international and domestic markets. Increasing feed cost thus contributed to higher poultry inflation during the first phase. The lower poultry inflation in the second phase was due to moderation in domestic feed prices and real rural wages along with a fall in private consumption growth, which reduced demand-side pressure on food inflation (Anand et al., 2016). The high inflation in the third phase, particularly in poultry meat, reflects the COVID-19 pandemic induced shifts in demand and supply along with disruption in the poultry value chain. Moreover, the feed prices also increased both globally and domestically, which further put pressure on retail inflation in poultry meat and eggs. Moreover, misinformation during the pandemic resulted in reduction in poultry production due to culling of poultry birds in the early phase. A decomposition of CPI egg inflation illustrates that eggs inflation has been primarily driven by trend component, albeit with some recent moderation. However, cyclical component dominated during the first two waves of COVID-19 pandemic (Chart 4c). Seasonality An analysis of seasonality in prices indicates that livestock and poultry items exhibit different seasonal behaviour. Milk prices peak in July and trough in March within a year (Chart 5a). Generally, prices of poultry meat trough during the winter months (December-February) on improved supply and picks up during summer months with a peak in June (Chart 5b). On the other hand, eggs prices witness seasonal peaks during the winter months (December-January) on higher winter demand and troughs during summer months of April-May on lower demand (Chart 5c). Egg prices also record some pick up during the monsoon season. Further, both poultry meat and eggs exhibit festival related seasonality with fall in prices during Shravan (end of July and August) and Navaratri (September-October) on lower demand in some parts of India as people avoid a non-vegetarian diet during this time. In the case of milk price, seasonality is observed generally with an upward trend from April to July. Milk prices generally do not fall back to base level due to downward rigidity in prices. It is, therefore, essential to interpret its seasonality with caution due to the constantly increasing milk prices. To address this limitation, an alternative approach has been adopted to analyse the momentum (month-on-month (m-o-m) change) of milk prices by separately examining the lean season (February to August) and the flush season (September to January) (Chart 6). The lean and flush season patterns clearly illustrate that the average milk price momentum during the lean season is generally significantly higher compared to the flush season. It should be noted that there is an inflection point after the COVID-19 pandemic, during which there was a change in the trend, with the flush season exhibiting similar or higher momentum than the lean season (except 2020-21 and 2023-24). This change in momentum is attributed to several factors, including the impact of rising demand during the COVID-19 period, higher input (feed and fodder) costs pass-through, and lower yield due to under-feeding of cows and lumpy skin disease during COVID leading to upward revision in milk prices by many cooperatives in several rounds. Additionally, cooperatives also exported excess stock, which further contributed to the shift in momentum. This analysis of milk price momentum provides a more comprehensive perspective on the seasonal variations and helps to better understand the market’s underlying dynamics. IV.1. Factors Determining Livestock Inflation: Demand-Supply Dynamics Price fluctuations in livestock commodities could be due to demand-supply imbalances resulting from trade policy changes, movements in international or domestic input costs including feed and fodder, and market interventions. Since the global food crisis of 2008, it has become apparent that the domestic food prices are integrated with world prices although the co-movement varies across commodities. The correlation for staples like rice and wheat has been found to be weaker in view of robust procurement policy and public distribution system. In case of staples particularly, the governments are reluctant to allow any significant pass-through from international to domestic prices (Mishra and Roy, 2016). Highly tradable products such as edible oils exhibit a high degree of co-movement between domestic and international prices. In livestock commodities, however, there is a moderate correlation between domestic and international prices. For instance, correlation between world dairy indices reported by the IMF and domestic WPI milk is found to be 0.52, while that between international poultry meat indices and WPI poultry meat is 0.44. (a) Demand-side Factors India’s growing food demand towards livestock needs to be analysed to understand inflation dynamics in livestock commodities. Robust economic growth with increasing per capita income in the last decade (5.4 per cent during 2010-11 to 2015-16 and 3.7 per cent during 2016-17 to 2022-23) coupled with sizable increase in population has been shifting the food basket of the people away from staple food to high-valued horticulture and livestock commodities in India. The shift in consumption pattern of Indian households is corroborated by the Bennett's law. That is, as income rises, people eat relatively fewer calorie-dense starchy staple foods and relatively more nutrient-dense meats, oils, sweeteners, fruits, and vegetables. Using the various rounds of the Consumption Expenditure Survey of the NSSO, Gandhi and Zhou (2010) show that demand for livestock products has risen significantly along with the expenditure share of livestock products as stated earlier. For instance, in rural areas, milk consumption increased from 3.94 litres per capita per month to 4.33 litres per capita per month between 1993-94 and 2011-12 while the consumption of eggs (no.) increased from 0.64 eggs per capita per month to 1.94 eggs per capita per month, and poultry meat increased from 0.02 kg per capita to 0.18 kg per capita over the same period. Similarly, in urban areas, milk consumption increased from 4.89 litres per capita per month to 5.42 litres per capita per month between 1993-94 and 2011-12, while the consumption of eggs increased from 1.48 eggs per capita per month to 3.18 eggs per capita per month, and that of poultry meat increased from 0.03 kg per capita to 0.24 kg per capita over the same period. This can be attributed to various factors including diversification of food basket, changing lifestyles and/or rise in income (Mittal, 2008; and Kumar et al., 2011). As per the Engel’s law, with an increase in the average household income, the average share of food expenditure in total expenditure declines. Chart 7 plots the Engel curves for milk, poultry meat and egg for both rural and urban areas using the household survey (NSSO 68th round 2011-12)7. The Engel curve plots monthly per capita expenditure of selected livestock commodity on y-axis and income fractiles on the x-axis (income fractiles have been deduced using household’s monthly expenditure). It suggests that for the households who spend a lot on food (which have high weight on food expenditure), their income elasticity of food expenditure is also high. The findings are reiterated in studies (Anand et al., 2016; and Gokarn, 2011) which show that milk, meat and egg tend to have high income elasticity, i.e., on an average, expenditure on livestock commodities (across all households) rises proportionally more than the increase in total food expenditure. Further, Mishra and Roy (2016) state that inflationary pressures, particularly in milk are attributed to rise in demand, which has outpaced increase in production. The demand patterns have further changed since the COVID-19 pandemic. Recent studies have highlighted how pandemic has resulted in a significant increase in the share of food in total expenditure in both rural and urban areas (Kaicker et al., 2022). The Centre for Monitoring Indian Economy–Consumer Pyramids Household Survey (CMIE-CPHS) monthly expenditure data show changes in food expenditure shares for animal protein rich items in India (Chart 8). The share of expenditure on milk in total household expenditure registered a sharp increase during the first wave and a marginal increase during the second wave before moderating somewhat thereafter, while that on the poultry meat saw a sharp decline during the first wave due to misinformation about COVID-19 spread. In contrast, the share of expenditure on egg fell since early 2017, before rising somewhat since the pandemic, though its share in total expenditure remains low (Chart 8). (b) Supply-side Factors Supply-side factors of inflation include changes in production and productivity, input costs and supply chain dynamics. Commodities experiencing higher demand growth also have relatively higher supply growth (Anand et al., 2016). This study further propounded that if relatively higher supply growth of food commodities with higher expenditure elasticities such as livestock products can be sustained going forward, it will help contain relative food price pressures. A number of studies have incorporated supply chain dynamics including the contribution of mark-ups between farm gate and retail price, constituents of those mark-ups and inter-linkages between different market stakeholders including traders, stockists, retailers, and farmers to understand the sources of food inflation and its volatility (Bhoi et al., 2019; Banerji and Meenakshi, 2004; and Bhattacharya and Sengupta, 2015). Production Trend of Milk, Poultry Meat and Eggs India has been the largest milk producer globally, surpassing the United States in 1998. The three-phased implementation of Operation Flood (1970-1996) which expanded the presence of dairy cooperatives and subsequent expansion of organised private dairies along with the government initiatives to increase milk production has ensured growth in milk production from 122 million metric tonnes (MMTs) in 2010-11 to 231 MMTs in 2022-23, thereby increasing the per capita availability of milk from 281 grams/day to 459 grams/day (Chart 9). Cows and buffaloes contribute 52 per cent and 45 per cent of total milk production, respectively, while the remaining 3 per cent is from goats8. The average yield of exotic/crossbred cow is 8.55 kg per day and for indigenous/non-descript cow is 3.44 kg per day in 2022-23 (BAHS, 2023). Despite India being the largest producer, the USA’s yield of milk is more than five times that of India, whereas Australia’s yield is more than three times and New Zealand’s yield is more than double in triennium ending (TE) 2022 (FAOSTAT). Uttar Pradesh is the highest milk producing state in India (with a share of 15.3 per cent) followed by Rajasthan (14.7 per cent) and Madhya Pradesh (8.6 per cent) in TE 2022-23. Within livestock, poultry meat production (from broiler industry) has grown steadily with the emergence of vertically integrated poultry producers. Today, India is the fifth largest producer of poultry meat globally after USA, China, Brazil and Russia (FAOSTAT, 2022). As per OECD-FAO (2022), India’s poultry meat production increased from 2.2 MMTs to 4.6 MMTs during 2010 to 2023 (Chart 10). However, the annual per capita consumption of poultry meat in 2023 was 2.85 kg in India, which was low by global standards. For instance, per capita consumption was highest in Israel (64.31 kg) followed by USA (51.54 kg), Brazil (43.1 kg) and China (13.7 kg) in 2023 (OECD-FAO Agricultural Outlook 2022-2031). Nonetheless, the sector also witnessed gradual growth in consumption in the last two decades reflecting rising income and rapidly expanding middle class along with development of value chains. Among the states, Maharashtra is the highest poultry meat producing state amounting to 15 per cent followed by West Bengal (13 per cent) and Haryana (12.5 per cent) in TE 2022-23 (BAHS, 2023). Within the poultry sector, egg has also grown both in volume and value terms over the last decade. India ranks third in global egg production after China and Indonesia in TE 2022 (FAOSTAT). The egg production in the country has increased from 63 billion numbers (nos.) to 138 billion numbers (nos.) between 2010-11 and 2022-23 (Chart 11). In 2022-23, the improved fowls contributed 88.4 per cent of the total egg production whereas desi fowls contributed 10.7 per cent, while the remaining was contributed by desi ducks and improved ducks. There has been a steady increase in per capita availability of eggs from 53 to 101 eggs per annum during the same period (BAHS, 2023). However, the consumption of egg is still lower than other countries. In 2023, the annual per capita consumption was 288 eggs in Mexico, 284 eggs in China, and 163.2 eggs in Brazil (OECD-FAO Agricultural Outlook 2022-2031). Three highest egg producing states in India are Andhra Pradesh (with a share of 20.3 per cent), Tamil Nadu (16 per cent) and Telangana (12.8 per cent) in TE 2022-23. Role of Government Interventions for Supply Management of Livestock and Poultry Sector To enhance yield and supply in this sector, and to make livestock products accessible to consumers at affordable prices, various programmes were launched by the central government to improve breeding, feeding and health status. In 2014-15, the central government implemented the National Livestock Mission (NLM) which aims to generate employment opportunities and foster development of entrepreneurship in the livestock sector along with efforts to increase per-animal productivity, promote feed and fodder development, and improve breeds to target increased production of meat, goat milk, egg, and wool. In the dairy sector, implementation of Operation Flood (1970-1996) was significant in expanding the presence of dairy cooperatives and subsequent expansion of organised private dairies, ensuring multi-fold growth in milk production. During the Operation Flood, the major issue was the low productivity of Indian bovines in the dairy industry, wherein milk yield was less than 1 kg per day. Crossbreeding technology initiated in 1961 resulted in an increase in average productivity from less than 1 kg per animal per day in the pre-Operation Flood era to 4.5 kg per (in-milk) animal per day. This increase in milk production resulted in competitive prices and eliminated the need for imported skimmed milk powder (SMP) to meet domestic demand. Before the completion of Operation Flood III (1985–1996), India relied on imported SMP to meet its domestic milk demand. Similarly, to enhance milk production and productivity of milk cattle, the Rashtriya Gokul Mission has been crucial for the development and conservation of indigenous breeds. The other important schemes for dairy sector are the Integrated Dairy Development Scheme and the National Dairy Plan. The main focus of these schemes has been to promote dairy development and offer financial assistance for activities such as breed improvement, feed and fodder development, and infrastructure development, thereby improving the productivity and profitability of the dairy sector. In addition, the National Programme for Dairy Development (NPDD), Dairy Infrastructure Development Fund (DIDF) and Animal Husbandry Development Fund (AHIDF) are some of the initiatives of the Government of India focussing on dairy infrastructure development along with milk procurement, processing, marketing, and the quality of milk and milk products. The NPDD scheme is designed to install approximately 8,900 bulk milk coolers, which are expected to cover around 26,700 villages, thereby benefiting more than 800,000 milk producers and resulting in an additional procurement of 20 lakh litres of milk per day (LLPD). By improving milk procurement, processing and marketing, these schemes will not only benefit millions of milk producers but also further strengthen the dairy value chain and enhance the overall impact of the programme (DAHD, 2022). At present, the poultry sector and especially poultry meat is one of the fastest growing sectors within agriculture in India. The revolution in the poultry sector has been primarily due to innovations in policies, institutions and breeding stocks particularly with the liberalisation of import of improved genetic material. In 1993-94, the government reduced the import duty on grandparent poultry stock from 105 per cent to 40 per cent (Kabeer and Murthy, 1996). Until 2001, the import of poultry grandparent stock was controlled by permits and governed by a duty structure. However, since then all quantitative restrictions on India’s import of poultry items were dismantled and grandparent stock was imported without any barriers (Mehta et al., 2007). The policy resulted in a massive increase in private investment in breeding operations with the use of imported grandparent stock. It also led to the production of day-old chicks under strict bio-secure conditions leading to performance improvement in the pure-line stock of improved parent lines (Emsley, 2006). Private enterprises have taken up research and development (R&D) of parent stocks and have developed breeds that suit Indian environmental conditions. Innovations in watering systems, and climate controls designed for Indian markets have ensured efficient poultry management. Moreover, the egg productivity of improved fowls (Bowans, Hyline, Lohman LSL, among others) also registered a significant increase. At the same time, technology breakthroughs with improved varieties of chicks for poultry meat like Cobb, Hubbard and Lohman, among others enabled the country to achieve high-conversion ratios for chicken to gain the required weight in a lesser time period. Under NLM, the Innovative Poultry Productivity Project (IPPP) is another initiative aiming to transform backyard poultry into a commercial economic model. Under IPPP, a pilot model has been implemented to upscale the subsistence model of backyard poultry farming to a scaled-up entrepreneur model. An important concern that impacts dairy and poultry production as well as its supply dynamics, however, is the losses or mortality due to susceptibility to various diseases. For example, foot and mouth disease (FMD), lumpy skin diseases and brucellosis in dairy cattle, and avian flu in poultry birds have a drastic impact on productivity and production of livestock sector, thereby increasing volatility in prices. In this regard, the government’s initiative like the Livestock Health and Disease Control programme aims at reducing the risk to animal health by capacity building of veterinary services, disease surveillance, and strengthening veterinary infrastructure in the country. Recently, the central government has allocated Rs.9,800 crores for leveraging total investment of Rs.54,618 crores for the next five years starting from 2020-21 (DAHD, 2022). Trade Policy and Price Dynamism in Livestock and Poultry Sector Supply and price dynamics of livestock and poultry products also depend on the trade policies adopted by the government. The central government uses a combination of trade policy tools including custom duties, import quotas, import bans and port restrictions to manoeuvre the supply and price dynamics. The customs duty on SMP has remained unchanged at 60 per cent since 2010-11. India also permitted imports of SMP/whole milk powder (WMP) under a tariff rate quota (TRQ) of 10,000 MT, with a 15 per cent import duty from 2020 to 2022. However, outside of the TRQ, imports are still subjected to a 60 per cent import duty. Over the last ten years, the quantity under TRQ has been varying under SMP (Chart 12a). For instance, during 2011-12 and 2012-13, the TRQ quantity was around 30,000 and 50,000 tonnes, respectively with an import duty of zero per cent for both years. However, for the rest of the years, the import duty under TRQ remained stagnant at 15 per cent. Likewise, fat has been imported at a basic customs duty of 30/40 per cent since 2011-12 (Chart 12b). India permitted imports of butter and other milk fats under a TRQ of 15,000 MT, with a 0 per cent import duty from 2011-12 to 2015-16 and 2020-21 to 2023-24. Additionally, a goods and services tax (GST) of 12 per cent is charged on fat imports whereas SMP has a lower GST of 5 per cent. India’s import of SMP and fat has been negligible over the last decade. In contrast, India exported significant quantity of butter and other milk fats including ghee in the last few years. In 2022-23, India exported 8,081 tonnes of butter and 14,796 tonnes of other milk fats including ghee (Chart 13). Such high exports of milk fat in the form of butter, ghee, and anhydrous milk fat can add to the domestic shortage. Interestingly, the exports of SMP from India during 2018-19 and 2021-22 were high despite domestic SMP prices being higher than the world SMP price (Chart 14). The majority of exports in these years were sent to Bangladesh (about 45 per cent in 2018-19 and 60 per cent in 2021-22) given lower freight costs. India's competitiveness in the SMP market requires making the dairy value chain efficient and reducing the production costs. In contrast, imports of poultry meat are low9 while India exports minimal quantity to countries like Bhutan, Bahrain and Malaysia. In 2022-23, India exported only about 3 tonnes of poultry meat as against almost zero tonnes in 2019-2010. The domestic demand for poultry is not met with imports as consumption in India is largely driven by fresh meat from live markets (95 per cent) while processed/chilled or frozen meats account for 5 per cent of market share (BAHS, 2021). Further, high tariffs on poultry meat imports along with inadequate processing makes India uncompetitive in global market. The basic customs duty on import of cuts and offal, frozen category is 100 per cent and not cuts in pieces offal, frozen category is 30 per cent (Chart 15). In case of egg, India allows export without any restrictions. The basic customs duty on import of fresh eggs and egg powder is 30 per cent for the last ten years. India imports a very small quantity of eggs. On the other hand, India exports fresh eggs mostly to Oman and Maldives and middle-east countries like Kuwait, Qatar, Bahrain, Iraq and Iran (Chart 16). India also exports eggs and its by-products to some African countries including Liberia, Sierra Leone, Kenya, Uganda, Nigeria, Somalia, Malawi and Sudan. Most of the eggs exported from India are from Namakkal, Tamil Nadu referred as the India’s hub of egg production. According to Department of Animal Husbandry and Dairying (DAHD), the strength of exports mainly lies in the competitive cost of production, proximity to international markets and successful regaining of freedom from Highly Pathogenic Avian Influenza (HPAI). Role of Feed in Livestock Price Formation Another important factor that impacts production and prices in the livestock sector is feed cost or feed availability. The literature shows that feed cost is a significant component of the total cost of livestock production, accounting for around 60-70 per cent of the total cost of production in milk (Lawrence et al., 2008), 60–70 per cent of broiler’s cost of production (Gulati et al., 2022), and 70–80 per cent of layer’s total production costs (Gunasekar, 2006; FAO, 2003; and Mallick, 2020). However, there have been high price and production fluctuations in various components of feed in milk, poultry meat and egg. The cow/buffalo feed constitute two major categories: roughages and concentrates (Udharwar, 2020). The roughages include dry roughage (e.g., hay, stovers like jowar kabdi, and straws of paddy, wheat, karad) and green roughages11 (e.g., cultivated fodder plants of leguminous fodder such as lucerne, berseem, cowpea, and non-leguminous fodder like Napier grass, para grass, maize, sorghum, tree leaves and silage). The concentrate mixture comprises maize grain - ground, soybean meal, groundnut cake, cotton seed cake, rice polish, mineral mixture and salt (Annex Table A2). The roughage requirement (dry matter) of cattle/buffalo is 2.5-3.0 kg per 100 kg body weight per day. The recommended fodder composition is discussed in Annex Table A3. Literature suggests that green fodder is more beneficial in terms of maintaining good health and increasing the yield, but on account of lower availability in most parts of the country, green fodder is generally substituted with dry fodder, and farmers have to thereby increase the content of concentrates in the total feed proportion. Whereas, the concentrate requirement depends on the state of cattle, for just maintenance of the cattle (no gain/loss in milk yield) 1.0 (1.5) kg concentrate is required for cow (buffalo), while lactating animals are advised to be given 1 kg of extra concentrate for every 2.5 (3) kg for cow (buffalo) milk produced and pregnant cow/buffalo should also get 1.5 kg/day extra above the ration schedule of adult animal in order to meet nutrients need for growth of foetus (DAHD, 2020). According to the Report “Vision 2050” of the ICAR-Indian Grassland and Fodder Research Institute (IGFRI 2013), India faced a net deficit of 35.66 per cent green fodder, 10.95 per cent dry crop residues and 44 per cent concentrate feed ingredients in 2012-13 (Annex Table A4). The Report also highlighted that at the current level of growth in forage resources, there will be an 18.4 per cent deficit in green fodder and a 13.2 per cent deficit in dry fodder in the year 2050. To meet the growing demand, green forage supply needs to grow at 1.69 per cent annually. In the domestic market, fodder and manufactured prepared animal feed costs have also experienced high inflation in the last three years leading to a rise in prices of leading milk brands (Chart 17). The Gujarat Cooperative Milk Marketing Federation (GCMMF), under the brand name of Amul, has hiked its milk prices for consumers thrice during 2022 citing an increase in feed costs12. For instance, rice bran extract and Gola cattle feed recorded WPI inflation of 27 per cent and 8.6 per cent, respectively in December 2022, while fodder registered WPI inflation of 30.6 per cent in December 2022. In the poultry sector (layer and broiler), feed constitutes maize (60 per cent), soya (25 per cent), de oiled rice bran (8 to15 per cent) and mustard extraction and groundnut cake (2 per cent each). Moreover, given India’s dependence on feed imports, international feed prices also transmit to domestic feed prices. For instance, in view of global inflation in maize and soya spiking to almost 112 and 80 per cent, respectively, in May 2021, domestic soya prices spiked by 119 per cent in August 2021. In view of skyrocketing prices and growing demand by the domestic animal feed industry as well as increased oil meal exports, India imported approximately 0.65 MMT of soybean meal primarily from Argentina, Vietnam, and Thailand during 2021-22. Moreover, the Union government approved a 1.2 MMT quota for soybean meal derived from genetically modified soybeans to address high animal feed prices impacting the industry (USDA, 2022). The high prices of soya meal, maize and soyabean have significant repercussions on the poultry industry. V. Overview of Livestock Value Chain in India To better understand the balance sheet approach, it is important to first examine the value chain of milk, poultry meat and egg, and the roles of various stakeholders involved. Understanding the commodity specific value chain is crucial not only for computing balance sheet variables and dynamic monthly stock/availability variables but also for identifying measures to mitigate volatility in livestock production and inflation. V.1. Dairy Value Chain The dairy sector in India provides livelihood to more than 63 million households (NDDB, 2022) constituting mostly small, marginal and landless farmers with an average herd size of 3 animal holdings (20th Livestock Census). Operation Flood led to the creation of three-tier cooperative structures at the state level, which gave a huge boost to India’s milk production and processing capacity and linked the milk distribution network efficiently linking 700 cities and towns in the country through a National Milk Grid. Since the 1990s, there has been an increase in private sector participation in dairy processing, with the processing capacities of the private sector dairy players surpassing that of the cooperatives (Gupta, 2017). In India, out of the total milk produced, 41.8 per cent is consumed at rural level: 29.7 per cent for self-consumption and 12.1 per cent for meeting the demand of those who do not possess milch animals (Chart 18). The balance 58.2 per cent of the milk (inclusive of 5 per cent produced in urban areas) is available for sale to urban consumers. Out of the total disposal of milk available, about 52 per cent is equally handled or marketed by the organised sector - dairy cooperatives and organised private sector players, while the remaining 48 per cent is handled by the unorganised sector popularly referred to as Doodhwalas (Gupta, 2017). Out of the cooperative share in total marketed surplus of milk, 65 per cent is sold as liquid milk and 35 per cent is processed into milk products. Within the private sector, the share of marketed surplus is 50 per cent each for liquid milk and processed milk products. Currently, there are 28 functional state-level cooperatives. The cooperatives follow a three-tier structure – a dairy cooperative society at the village level affiliated to the milk union at the district level, which is further federated into a milk federation at the state level. The three-tier structure was set up for delegating the various functions - milk collection which is carried out at the Village Dairy Society, milk procurement and processing at the District Milk Union, and milk and milk products marketing at the State Milk Federation (Chart 19). State federations market their products under common brand names – such as Amul, Nandini, Aavin, Saras, etc. This model is also referred to as the ‘Amul Model’ or ‘Anand Pattern’ of dairy cooperatives as implemented during the Operation Flood. Currently, the top five cooperatives: Gujarat (Amul), Karnataka (Nandini), Tamil Nadu (Aavin), Rajasthan (Saras) and Bihar (Sudha) handle more than 76 per cent of the total milk processed by cooperatives. The Anand Pattern is an integrated cooperative structure which procures, processes and markets the produce and is owned and governed by farmers. There are around 25 major private dairies operating across states in India. As per the National Dairy Development Board (NDDB), the capacity created by private dairies in the last 20 years is more than the capacity set up by the cooperatives over the past 30 years. While the value chain of dairy cooperatives and organised private sector dairy companies follow a similar structure in terms of procurement, processing and marketing, dairy cooperatives’ ownership rests with the members who pour milk into their procurement system while in the case of organised private dairies, farmers do not have any ownership in the company, as these companies are mostly privately held (through shareholdings) and some are listed in the stock market because of public shareholdings. In cooperatives, members of the cooperative society in the village supply milk to their procurement system, whereas, in the case of most of the private dairy, farmers are under no obligation to sell or supply milk to them, although there are cases where some private players have agreements with dairy farmers to supply milk to them. Procurement by private dairies is based on the demand and supply scenario while in case of cooperatives, milk brought in by members has to be procured and processed irrespective of the demand for dairy products in the market. However, during the period of high milk production, procurement by cooperatives may depend on their capacity to procure and process. In the case of cooperatives, private dairies as well as organised private players, the milk procurement price paid to farmers is on the basis of fat and solids-not-fat (SNF) contents. Industry estimates suggest that the private sector has more processing capacity than the cooperatives. However, cooperatives have a significant presence in the liquid milk segment, while both private dairies and cooperatives have a significant share in the processed products market. The unorganised sector still has a major share in the handling of the marketable surplus of milk, as they have localised operations. Major portions of milk procured from farmers are sold in the market or supplied door to door through vendors. Some of the unorganised sector players also supply value-added products like paneer, curd and others to the retail markets. The processing capacity of the unorganised players is estimated to be 35 per cent of the total marketable surplus. The biggest component of India’s dairy market is liquid milk with an estimated share of around 71 per cent, followed by dairy products with a share of 29 per cent under which milk gets processed into khoya, chhena and paneer and further used as the base material for a variety of indigenous sweets and preparations, followed by ghee (Gupta, 2017). Many of these products are produced by households or halwais (sweetmeat makers). V.2. Poultry Value Chain Poultry farming is classified into commercial and backyard sector with varying sizes measured by the number of birds (Table 1). Backyard poultry is mostly owned by small and marginal farmers, consisting of only a few birds, primarily for personal consumption, with only a small amount sold commercially. Compared to backyard farms, poultry farmers who sell eggs and meat commercially, the farm size varies from 5,000 birds to 1,00,000 birds. Within broiler industry, commercial sector accounts for 82 per cent of total poultry meat production, whereas within layer industry, commercial sector contributes to 83 per cent of egg production. The remaining 18 per cent and 17 per cent are contributed by backyard poultry in broiler and layer industry, respectively (BAHS, 2020). Poultry value chain consists of three main operations: (i) breeding (breeder farms), (ii) hatching (hatchery farms), and (iii) layer farming (for egg production) or broiler farming (meat production). The breeder farms focus on producing fertilised eggs for either egg or broiler production, using specific ratios of male and female breeders to ensure the eggs are fertile for development of pure line broiler and layer birds or the grandparent stock. These fertilised eggs collected from breeder farms are sent to centralised hatcheries for incubation. After 21 days, the hatched chicks are vaccinated, assessed for uniform quality, and shipped to other locations for further rearing. The process of steps of development of the great grandparent (GGP) stock to parent stock in genetic value chain for poultry meat and egg value chain is illustrated in Chart 20. For the rearing of broiler and layer birds, the first step of the value chain is the identification of a pure genetic breed for ensuring multiplication into chicks. In commercial poultry farming, birds are reared under controlled conditions or cage housing. In India, the great grandparent stocks, also referred to as pure lines, are supplied by two companies. According to a field survey, there are around 100 companies or ‘associates’ which are into parent stock production. Major players such as Venkateshwara Hatcheries, Skylark and Suguna are the main supplier of layer chicks for commercial production from the parent stocks. These ‘associates’ are the key players in the egg value chain which supply layer chicks to the farms which are reared for the production of commercial or table or non-fertilised eggs. The second aspect of the value chain explains the production of commercial poultry meat and layer egg from the parent stocks. The day-old broiler chicks from the hatcheries are sent to broiler farms without being sorted by gender, while chicks from egg-laying stock are separated by gender, with only female chicks sent for egg production. V.2.1. Value Chain of Commercial Poultry (Broiler bird/meat) The second aspect of the value chain explains the process from the parent stocks to commercial bird production, which works through two models: (i) Integrator model, and (ii) Direct farmer model. Each of this is detailed below: i. Integrator model In the integrator model, a contract farming agreement is underwritten between the integrator and farmer. Around 65 to 70 per cent of commercial poultry meat production comes from this model (based on our field survey). The integrator provides day-old-chicks (DoC), feed, veterinary services and vaccines to the farmers and the farmer or farm owners take care of the cost of the shed, electricity and labour for poultry birds rearing. In other words, except the growing cost, all other costs are borne by the integrator. This contract farming system ensures price stability or assured returns for the farm owners irrespective of volatility in prices in the wholesale market. The integrators take most of the risk in the value chain while farmers mostly focus on rearing broiler birds without being involved in the marketing aspects (Chart 21). There are several integrators or companies such as Venkateshwara Hatcheries (Venky’s), IB group, Suguna chickens which are at present following contract farming model. In contract farming of broiler chicks, the farmers are remunerated based on a predetermined level of feed conversion ratio (FCR), weight and mortality. For instance, FCR ratio for large hatcheries were around 1.6 (as per our field survey conducted during December 2022). If this FCR and mortality rate of 7-8 per cent is maintained, then on an average, the farmer is paid Rs.6.5-7/kg. Over these charges, performance linked incentives are also given to the farmers. The feed, comprising maize and soyabean meal, is the largest component of total production cost while the cost of DoCs is Rs.25-30 (Chart 22). Along with this, integrators also bear the medicine cost (which is around Rs.2 per kg.), transport cost and other administrative costs. The broiler chicks are usually reared for 35-40 days to get a market weight of 1.8 to 2.2 kg. Integrators buy back 36-40 days old broiler bird (around 2 kg size) by paying Rs.7 per kg (on an average) to farm owners. ii. Direct farmer model The second part of the value chain relating to commercial production are those 30 per cent of the farmers or farm owners who rear broiler chicks by investing from their own resources. These farmers also have to look at the marketing aspects of the broiler birds while bearing the costs of DoCs, feed costs, medicine costs, land and labour costs all by themselves. Traders sell the birds to retailers who would sell the raw meat at the live market (sold as dressed or culled chicken meat). Farmers generally prefer integrator model as it mitigates risk and gives them assured return irrespective of the price fluctuation in the market. Farmers who are not part of the integration model face initial investment barriers and also risk resulting from unsured return as a consequence of price fluctuations. Interactions with the officials of the Poultry Federation of India underscored that poultry meat mostly sold through wet market, where birds are culled and raw meat is sold to the consumers, accounts for 95 per cent of the total production of broiler birds. Only 5 per cent of poultry meat production is processed as value-added products. There is another segment of traders who source broiler meat or birds from farmers or farm owners for institutional consumption such as hotels, restaurants, catering services (HORECA) and defence forces. Value Chain of Backyard Poultry Meat Around 18 per cent of the poultry meat production is contributed by backyard poultry, practised mostly in rural areas. A portion of poultry meat production (around 5 per cent) is also used for self-consumption. The unorganised and backyard poultry sector is one of the tools for subsidiary income generation for many landless or marginal farmers and it also provides nutritional security to the rural poor. In case of the value-chain of backyard poultry, the parent stock of broiler chicks and indigenous/genetically improved poultry birds are provided to farmers in the rural areas mostly through respective state government supported programmes or sold to farmers for promoting rural livelihood options. V.2.2 Commercial Egg Value Chain The marketing of eggs is dominated by traders who purchase eggs from layer-farmers based on the region-specific daily prices announced by National Egg Coordination Committee (NECC) [an apex body of the layer farmers]. The female parent stock (or the one-day old chick) from hatcheries is sent to commercial egg layer farms for egg production. Based on the inputs provided by NECC, commercial layer birds have around 72 weeks life span, where the birds start laying eggs commercially from 18-19 weeks of age (as per the field survey). During the first 18 weeks, when the bird is not laying eggs (also called pullet), it is kept in the chick house (0 to 45 days) and later moved to grower house (45 days to 18 weeks). One day-old layer chick supplied by these companies cost in the range of Rs.37 - 40 per chick. There are some intermediary farmers who rear these one-day old chick till 18 weeks and supply it to layer houses for egg production. The pullets cost around Rs.300. During the bird’s life cycle, it lays eggs during 18 to 72 weeks totalling 290 to 310 eggs (Chart 23). After 72 weeks, it becomes uneconomical for poultry farmer to keep rearing the birds for eggs as the yield decreases and probability of breakage increases as the egg’s shell thins. However small poultry farmers tend to keep birds till 80-85 weeks in India and then sell it for its meat. Based on the field survey conducted during December 2022, the cost of production of an egg is around Rs.5 where the feed accounts for 75 per cent of the total cost of production. The pullet cost adjusted for an egg comes to around Re. 0.91 per egg. The other heads are medicines and fixed cost inclusive of electricity, cage and labour which account for Re.0.23 and Re.0.13 per egg, respectively (Chart 24). The eggs sourced from commercial layer firms are referred to as non-fertilised eggs. The commercial egg production from the farm gate to retail consumers follows several chains depending on the transportation from the production centres to the consuming centres (Chart 25). Because of regional concentration of production in some states such as Andhra Pradesh, Tamil Nadu and Telangana, traders from the consuming or deficient regions buy egg from surplus regions/states and transport them to consuming points. At the consuming points, local traders buy egg brought from the producing regions and transport them to the retail points, where local agents deliver it to retail outlets. In case of backyard poultry, eggs are sold directly by farmers in the market or purchased directly by consumers at farm gate. In addition to supplying layer chicks, major players also market their non-fertilised eggs, also known as value-added eggs, directly to consumers through retail channels. Egg powder, prepared by dehydrating eggs through the spray drying process, has same amounts of proteins as eggs and has low carbohydrates, cholesterol and fats. Value Chain of Backyard Poultry (fertilised eggs) In backyard poultry, rearing of layer birds as well as improved desi varieties in smaller numbers is carried out in a free-range system where birds scavenge for food and natural process of hatching is practiced. In case of backyard poultry, the egg produced is referred to as fertilised as these can be hatched to provide replacement birds. The backyard poultry varieties lay 180 - 200 eggs during their life span of 72 weeks13. The smaller backyard layer farms do not have infrastructure or facilities to transfer the eggs directly to consumption centres, and hence it is the intermediary who aggregates and transport to the markets. In case of backyard poultry, eggs are sold directly by farmers in the market or purchased directly by distributors at the farm gate. V.3. Estimating the Price Mark-ups in the Livestock Value Chain Price Mark-ups in the Dairy Value Chain For this study, we have taken into account major dairy cooperatives based in Gujarat and Maharashtra. In terms of the realisation of the consumer’s rupee by the farmers, the cooperatives are the most efficient as they transfer about 70 per cent of consumer rupee earned from selling liquid milk to the retail consumers (Table 2). This makes the dairy value chain of cooperatives more inclusive. Price Mark-up in Poultry Value Chain (poultry meat and egg) For the analysis of farmer’s share in consumer rupee, we have considered two chains: (1) Pune and Mumbai chain for poultry meat and egg, and (2) Barwala (Haryana) and Delhi chain for egg. The mark-ups in the poultry value chain are explained in detail in Table 3. A. Notes for Broiler:
B. Notes for Layer eggs:
Given the objective of understanding price dynamics of livestock and to create a representative variable which can capture demand and supply imbalances, we use the balance sheet approach. The framework is used to assess the supply and demand of a commodity by analysing its inventory level, production, consumption and trade, and thereby creating monthly stocks or stock-to-use (STU) ratios. In this paper, we use this approach to analyse the supply and demand of livestock and poultry sectors including milk, poultry meat and egg. Milk can be stored for longer period once it is processed into skimmed milk powder and fat, while commodities like egg cannot be stored for a long period. In contrast, poultry meat is not stored and is primarily sold in the wet market in India. Therefore, we have assumed net availability or stock to be zero in case of poultry meat. Once we have established the monthly total stocks (in case of milk and egg) or availability (in case of poultry meat), we can proceed to analyse the impact of various factors including the balance sheet variable on livestock prices. Components of the Monthly Balance Sheet The livestock and poultry commodities (milk, poultry meat and egg) studied in this paper have unique value chain structures as discussed earlier. The balance sheet data, which are available on an annual basis is transformed into monthly data based on factors such as production and release patterns and consumer/institutional demand collated through primary surveys. The monthly patterns of production, consumption and stocking have been generalised for the period from January 2010 to December 2022 for milk, poultry meat and egg. Some key assumptions for generating the livestock and poultry balance sheets are as follows:
Supply-side: Availability Availability in any month is the summation of flow variables i.e., marketed surplus and net imports in the current month along with stock variable which has been carried forward from the previous month. However, a small share of the produce may be lost during harvest and farm operations and post-harvest activities. Losses at farm operations reduce availability at each stage. Hence, availability in a month is derived as follows:  In poultry meat balance sheet availability, we assume that poultry meat is not carried forward as it is not stored and is primarily sold in the wet market, therefore, we do not have stock component. We now explain each of the variables on the right-hand side of the availability equation 1. Production and Marketed Surplus The annual production estimates of milk and poultry egg are taken from the annual publication of the Basic Animal Husbandry Statistics (BAHS), Department of Animal Husbandry and Dairying, Government of India. Annual production figures for poultry meat are taken from OECD-FAO Agricultural Outlook 2022-203116. These annual estimates of milk, poultry meat and egg are distributed monthly based on the pattern we collated from our livestock and poultry field survey. From the monthly production, which is the flow variable, some part of livestock produce is kept for meeting the farmer’s self-consumption needs and the remaining produce is sold in the organised or unorganised sector. For instance, in milk, out of the total milk produced, around 41.4 per cent is retained by the dairy farmers for self-consumption and sale in rural areas (Gupta, 2017). Of the 41.4 per cent retained milk production, 11.2 per cent is sold to consumers, and sweet shops in rural areas. So, the total marketable surplus for milk is 69.8 per cent (11.2 per cent sold in rural areas + 58.6 per cent disposed for sale in organised and unorganised sector). In the absence of official time series data, this pattern has been applied from January 2010 to March 2020. However, in recent years, the pattern has changed marginally with the total marketable surplus for milk accounting 70.3 per cent of the total milk production (12.1 per cent sold in rural areas + 58.2 per cent disposed for sale in organised and unorganised sector) as per the projections given in Gupta (2017). This pattern has been applied from April 2020 to December 2022. Similarly, as per the BAHS data, around 83 per cent of eggs produced in India are from commercial layer farms and remaining (17 per cent) are contributed by backyard poultry, whereas 18 per cent of the poultry meat production is contributed by backyard poultry practised mostly in rural areas. Poultry farmers, particularly in backyard poultry, retain a part of their produce for self-consumption which is close to 50 per cent and 5 per cent of the egg and poultry backyard production, respectively (based on field survey). The total marketed surplus (including commercial poultry and remaining produce of backyard poultry) is around 91.5 per cent and 97 per cent of total egg and poultry meat production, respectively. Net Imports Availability in a month also depends on net imports which increases or decreases supply depending upon the magnitude of imports and exports in a month. However, imports are negligible for poultry meat, egg and milk, while exports are substantial for egg and milk in different forms. For instance, in milk, we trade (export and import) in SMP, whole milk, condensed milk, cheese, whey, butter and ghee, whereas in egg, we export in fresh eggs of fowls of the species Gallus domesticus, egg yolk dried and whole egg powder. The milk and egg products traded in different forms are converted to liquid milk in tonnes and whole egg in numbers, respectively, in our balance sheet. In poultry meat, we trade (mostly import) fowl of species Gallus domesticus, not cut in pieces (fresh/chilled and frozen) as well as cuts and offal of the species Gallus domesticus (fresh/chilled and frozen), however, our net imports are negligible (almost zero). Losses Losses along the value chain impact availability in a month. As per ICAR-CIPHET study by Jha et al. (2015), there are two types of losses that impact availability/supply in a month (i) farm operation, and (ii) storage channels. The losses in farm operations include losses during harvesting, collection, sorting/grading, packaging, transport, etc., which are deducted from the total production to compute marketed surplus. As per the ICAR-CIPHET study, this loss stands at around 4.88 per cent, 1.95 per cent17, and 0.71 per cent in case of egg, poultry meat, and milk, respectively. Similarly, storage losses include losses incurred in storage channels at the wholesale-level, retail-level and even at the processing units. This loss stands at around 2.31 per cent and 0.21 per cent in egg and milk, respectively. The storage losses are applied on the total stocks in a month for egg balance sheet whereas in milk, the storage losses (which is equal to processing loss) are calculated on the total processing of milk in a month. In equation 1 for availability, all the variables on the right-hand side have been defined except for the stock variable. Total stocks are calculated as the excess availability in the system, which will be discussed after explaining the usage side of the balance sheet. (a) Demand-side: Usage On the demand side of the balance sheet, we compute usage of the milk, poultry meat and egg in a particular month as total produce absorbed in the market, which is given as:  Consumption Consumption in the usage side for livestock balance sheet includes consumption by individual households. Further, we assume that livestock’s net consumption is inclusive of HORECA (hotel/restaurant/catering) demand. For milk, we use NSSO consumption expenditure survey to compute annual liquid milk consumption by household. However, NSSO’s consumption expenditure survey provides per capita household consumption data for the year 2011-12, but no detailed estimates were available for the subsequent years18. Therefore, we have utilised the behavioural approach method from the NITI Aayog's Working Group Report (2018) to estimate the latest consumption figures for milk. In our balance sheet approach, we have projected the consumption of milk by considering factors such as the per capita consumption of milk from the base period (2011-12), the extrapolated/actual population, the growth rate of per capita income, and the expenditure elasticity of milk as specified by the Working Group Report of the NITI Aayog. The formula for estimating consumption, therefore, can be written as:  where Qijt= household demand for ith commodity for the jth sub group (rural or urban) during the time period t; qij0 is annual per capita quantity consumed of ith commodity in the base year in rural or urban areas (NSSO 2011-12); Pjt is projected population in period t (Census Projection 2011), gjt is compound annual growth in per capita income (PCY) during time period t (MoSPI, various years), ejt is expenditure elasticity of the ith commodity (0.82 for rural areas and 0.40 for urban areas for milk, egg and meat) (NITI Aayog, 2018). To calculate the amount of liquid milk consumed by households each year, we used a weighted average of the per capita consumption in rural and urban areas. Later, the annual projected consumption of milk has been distributed using the monthly pattern of CMIE consumption expenditure data. From the monthly milk consumption, we have deducted consumption out of home produce to arrive at their net consumption. As per NSSO’s unit level consumption survey data, 45 per cent and 6.01 per cent of milk consumption is met from home produce in rural and urban areas, respectively. In case of poultry meat, we have used the annual consumption from the OECD-FAO Agricultural Outlook 2022-2031, as projections based on the NSSO’s Consumption Expenditure Survey (CES) using the behavioural approach resulted in consumption higher than production estimates for all the years (2011-12 to 2022-23). However, annual consumption from the OECD-FAO Agricultural Outlook 2022-2031 is relatively less than the annual production figures for poultry meat (Annex Table A5). Therefore, for poultry meat balance sheet, we use OECD-FAO Agricultural Outlook 2022-2031 for computing production and consumption estimates. The annual poultry meat (taken from OECD-FAO Agricultural Outlook) is distributed monthly as per the pattern sourced from our market intelligence. From the monthly poultry meat consumption, we have deducted consumption out of home produce to arrive at their net consumptions. We assume that 5 per cent of the monthly consumption is met through home produce. Like poultry meat, we find that annual consumption of egg computed using behavioural approach based on NSSO’s CES is just 47 per cent of the total production during 2010-11 to 2020-21, resulting in underestimating consumption as a percentage of production. The field survey and interaction with NECC officials highlighted that usage and availability of egg in a month are almost equal. Although during Shravan and summer months, egg consumption falls short of the availability and are stored in cold storages which ranges between 1-2 per cent of the total egg production as per our interaction with NECC experts. In certain regions in India, when consumption of egg falls short of production due to cultural or religious festivities, the surplus egg is supplied to states/regions which have uniform egg consumption throughout the year such as North-East and Eastern states. Therefore, we distribute monthly consumption as a percentage share of monthly production in the egg balance sheet and these monthly patterns were calculated from our field interactions. Processing in a Month Livestock products are also consumed in processed form, which increases the shelf life of these commodities. For instance, milk is processed into SMP, WMP, sweets, butter and ghee, whereas poultry meat is processed into processed meat products. Likewise, egg is processed into egg powder and yolk powder. In milk balance sheet, as explained in the value chains section, processing of liquid milk is carried out in the organised and unorganised sector. As per Gupta (2017), the processing in organised sector and unorganised sector was around 13.0 and 29.3 per cent of the marketable surplus, respectively. We have applied the same pattern for the period from 2010 to 2019. Gupta (2017) forecasted that processing in organised and unorganised sector could increase to 17 and 35 per cent in 2020, respectively and therefore, we have applied the same pattern as a share of milk marketable surplus for the period from April 2020 to December 2022. Additionally, we deduct processing losses (0.21 per cent of total processing as per the ICAR-CIPHET study) at this stage of the balance sheet. In poultry meat balance sheet, using field survey information, we have assumed that a total of 2.4 per cent of marketed surplus is processed and demanded by HORECA. While in egg, as per the interaction with officials in poultry industry, we assume that 40 lakh eggs daily go into processing of egg powder during January 2010 to March 2015 which increased to 45 lakh eggs daily during April 2015 to March 2020, and 50 lakh eggs daily during April 2020 to December 2022. We included monthly processing of egg powder based on the above pattern in the egg balance sheet. Post compilation of balance sheet, we examine the trends and patterns of various components of balance sheet variables (Chart 26). Production and consumption patterns have been constructed through extensive assessments from key market players in dairy, broiler and layer industry. In the case of milk, based on the trend from the CMIE consumption expenditure data, consumption of liquid milk is almost constant throughout the year except during January-April and September-October (Navaratri) where consumption is slightly higher. Further, availability peaks during August-December, and excess stocks from winter months are used to cater to demand in summer months of May to July, when availability is lower. However, usage which is inclusive of processing, peaks around the same months as marketed surplus (as processing is taken as a share of marketed surplus). Similarly, the demand for poultry meat is the lowest during April-June and it increases slightly in July till September and peaks during the winter months. During Shravan (July/August) and Navaratri (September/October), and onset of summer months, the consumption of poultry meat falls. Availability peaks around the winter months between November to January in a year and usage also peaks around the winter months. As poultry meat is generally sold in the wet market, it is not stored and therefore, the net availability for poultry meat is assumed to be zero every month in the balance sheet. Like poultry meat, egg also has a similar consumption pattern which peaks around December to January and falls during festival months of Shravan and Navaratri, and summer months. The availability of egg during a year peak around December to March with higher production. (b) Movement of Net Availabilty (Stock) in a Month Livestock and poultry products cannot be stored for long as their shelf life is relatively short. However, the livestock products can be processed into value added products and can be stored for longer time period. For instance, excess milk is processed during the flush season and stocked as SMP and fat which can be reconstituted into milk and supplied in summer months. The shelf life of SMP is around 12-18 months. For poultry meat, in India given the lack of proper infrastructure and cold chain facility, the market is dominated by wet market and live bird sale. Therefore, in poultry meat balance sheet we do not assume any stock. As mentioned earlier, we assume that in case of poultry meat whatever is available in the market is demanded in that month, and there are no carry forward stocks to next months. The share of frozen meat is negligible in the poultry meat production which is included in the processing component of the balance sheet. Egg, on the other hand, has a shelf life of 15-21 days at room temperature. But it can be stored in cold storages for 3-4 months. However, eggs stored in cold storages need to be consumed in 3-4 days once these are released from cold storages. Importantly, unlike pulses or onion and potato, these stocks or excess supply in a month constitute a relatively small percentage share of total marketable surplus. The excess supply or net availability is the stock variable in the balance sheet which plays a critical role to comprehend price volatility. The excess stock in a month gives us a picture of the demand and supply gap, which is important for understanding the expected price movements in the coming months. Stocks accumulated in a month are carried forward to cater to demand in later months when demand increases, particularly in milk and egg balance sheet. However, poultry meat price in any month will depend upon total availability or marketed surplus. In the balance sheet, we define net availability or stocks as:  The movement of stocks in milk and egg in a production year is shown in Chart 27 when stocks are carry-forwarded and when stocks are not carry forwarded in the availability in later months. For instance, in the milk balance sheet, we have taken September to January as the flush season when production of milk is relatively higher than summer months. After the monsoon season, milk production increases due to better green fodder availability and lower temperature. The stocks or excess supply accumulated in these months are used to cater to demand during April to August next year. Therefore, stocks accumulated in September are used during April of the next year and so on and so forth, till January stocks are used to cater demand in August (Chart 27a). Importantly, the study assumes that the excess milk stocks of flush season are reconstituted into milk and milk products to cater to excess demand during summer months from April to August in our balance sheet. Similarly, in egg balance sheet, we carry forward excess supply of eggs in a month to the next month’s availability. However, during summer months, Shravan and Navaratri period, when consumption falls leading to fall in egg prices across the country, the poultry farmers tend to store eggs in cold storages for two-three months. Hence, excess supply of eggs in early summer such as in March and April is stored and released in May, June and July in a calibrated manner when demand recovers on holiday demand. The excess eggs stored in August and September are released in November, December and January in the egg balance sheet. Chart 27(b) illustrates the utilisation of carry-forward stocks to meet excess demand (depicted by negative stocks in the figure) in June, July, November, and December19. (c) Linkage between Stock or Availability and CPI Inflation in Livestock The stocks/net availability calculated on a monthly basis can be used as a proxy for the excess or deficient supply of the particular commodity in the economy to understand the price movements. In milk, as seen earlier, stocks plummet during summer months (April to June) when production is lower whereas these stocks are higher during the winter months. Juxtaposing the stocks or net availability with the CPI milk inflation, we see that the troughs of net availability (without the carry forwarded stocks) coincides with the peak of CPI milk inflation (Chart 28a). In line with economic theory, we expect our stocks or net availability to have a negative relationship with prices. More supply should yield low prices and vice versa. The correlation between net availability of milk and CPI milk inflation during January 2012- December 2022 was -0.43 (Table 4). In poultry meat, the above graph illustrates that the peaks of CPI poultry meat inflation and troughs of availability overlap in some years (Chart 28b). From the correlation matrix below, one can see that the correlation between CPI inflation and availability of poultry meat is -0.02. However, the correlation between CPI poultry meat inflation and deviation of availability from 3 years moving average improves to -0.29. As discussed earlier, in egg, total stocks peak in the month of April and May in each year as summer sets in and demand falls for egg. In the crop year, the net availability trough in December when the stocks are at their lowest level (Chart 28c). The figure illustrates that the troughs of CPI egg inflation and peaks of net availability of egg overlap in most years. In egg, we observe a correlation of -0.1 between CPI inflation and net availability. Given the stocks or net availability are low in case of eggs, it is likely that stocks will not have significant influence on egg prices. Therefore, we also check for the correlation between availability to usage ratio (A/U ratio)20 and CPI egg inflation during January 2010- December 2022 which is around -0.01. However, the correlation of A/U ratio with CPI MoM (month-over-month) of egg is around -0.41. In egg, the momentum of CPI captures the change in stock better than year on year inflation. VII. Model Specification and Empirical Results After deriving the balance sheet of all the three commodities, we try to create a model to explain price dynamics of these commodities using the balance sheet variable which is availability/marketable surplus. In line with the objective of the study, firstly, the study identifies various determinants of prices of milk, poultry meat and egg, including the importance of the balance sheet variable, and secondly, it forecasts inflation of the three livestock commodities for up to 12-month forward horizon under the univariate and multi-variate forecasting methods using the created balance sheet variable. To begin with, the stationarity of the variables has been checked using the Augmented Dickey Fuller (ADF) tests. As the variables used in the livestock regression exhibit different orders of integration, the ARDL cointegration technique proves to be advantageous. ARDL model is suitable when variables are integrated of different orders (Pesaran, 1997). This method is robust when dealing with cases where a solitary long-term relationship exists between the fundamental variables, especially when the available sample size is small (Pesaran et al., 2001). The ARDL model adopts a single-equation framework. This allows it to incorporate an appropriate number of lags and effectively guide the data generating process within a framework that transitions from general to specific modelling. To illustrate the ARDL modelling approach, a general ARDL(p, q) model is given by:  The error correction model (ECM) version of the ARDL is given by: 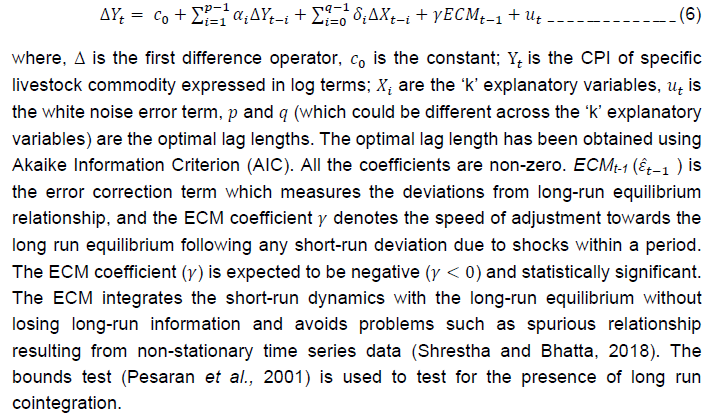 Importantly, our monthly times series data for CPI, stocks (net availability) for milk, poultry meat and egg have inherent seasonality component. Therefore, all the variables are log transformed and the one with seasonality are seasonally adjusted (employing the U.S. Census Bureau's X-13 seasonal adjustment methods in E-VIEWS) prior to running the ARDL regression. The description of the variables used in ARDL and their data sources are given in the Annex Table A6. Milk Model Estimation After using the balance sheet approach to derive the net availability of milk in a month and discovering that there is an inverse correlation between net availability and CPI milk, in the ARDL model the study uses deviation of net availability from its 3-year moving average to formally estimate its impact on milk prices. Furthermore, it was observed that feed and fodder cost (proxied by WPI feed and fodder) for cattle is positively correlated with the CPI milk (0.84), as feed constitutes the major proportion of the cost of producing milk and therefore it is also included in the regression. It also uses a dummy variable to account for shocks. The stationarity of the variables is tested using Augmented Dickey-Fuller (ADF) test, which shows that CPI Milk and Net Availability deviation are stationary in level and WPI Feed is stationary in first difference (Table 5). This suggests that the ARDL model can be used for estimating the factors impacting CPI milk prices. The lag lengths of the variables in the ARDL model are chosen as (2, 12, 3, 0) based on AIC criterion. For net availability deviation, we have taken 12 lags based on the interaction during the field survey which highlighted that last year’s stock levels play a vital role in deciding current price pressure in milk. The ARDL bounds test confirmed the existence of long run relationship between CPI milk and net availability deviation of milk, WPI feed-fodder and milk dummy (Table 6). The estimates for the sample period April 2013 to December 2022 show that the log of deviation of net availability (i.e., the deviation from the 3-years moving average of stocks left after fulfilling liquid and processed milk demand), log of weighted average of WPI feed and fodder, and Milk dummy (unexpected extreme random shocks including the COVID-19 shock21) are significant determinants of the CPI milk prices in the long-run (Table 7). The results indicate a statistically significant negative relationship between the net availability deviation of milk and CPI milk, i.e., a one per cent increase in deviation22 of net availability can lead to a decrease in the CPI milk by 0.33 per cent, which is in line with the economic theory of more stocks leading to cooling of prices. The input cost for milk shows a positive relationship with CPI milk, i.e., a one per cent increase in WPI feed and fodder can increase CPI milk by 0.74 per cent. The Milk Dummy which is for COVID-19 and random extreme events also has a positive and significant impact, indicating a rise in CPI milk by 0.23 per cent. The estimate of the coefficient of ECM term is negative and statistically significant, indicating that any disturbance to the long-run equilibrium is corrected by 2 per cent within a month. The small size of the ECM term indicates a slow pace of convergence to long-run equilibrium in the face of any deviation from the equilibrium path. The diagnostic tests for the ARDL model are satisfactory. The Breusch-Godfrey test indicates that there exists no serial correlation in the estimated residuals. The stability of model is examined using CUSUM test which shows that the predicted values lie within the 95 per cent confidence interval, suggesting that the model is stable (Chart 29). Poultry Meat Model Estimation Before applying the ARDL, the stationarity of the variables for poultry meat equation was checked using ADF test, which shows that CPI poultry meat and feed price are stationary in first differences, while availability is stationary in level (Table 8). For estimation of the poultry meat equation, the deviation of the total availability from its 3-years moving average (LogAvailability) and feed price index (LogFeedPrice) after log transformation and seasonal adjustment have been used. We have taken log of normalised deviation of total availability from its moving average as an explanatory variable because net availability is assumed to be ‘nil’ in case of poultry meat, as it cannot be stored. Moreover, the normalised deviation of availability will remove any seasonal component inherent in the series. In line with the theory, any increase in positive deviation from the long run average of the total availability of poultry meat would result in a fall in poultry prices, while rise in feed prices will lead to increase in poultry meat prices. Additionally, we have used ResDummy to capture random external shocks23. We have also considered Shravan (Shravan_Dummy) and flu (Flu_Dummy) dummies as exogenous variables affecting CPI poultry meat. The sample period covers from April 2012 to December 2022. The ARDL bounds test shows that there exists a long-run relationship between CPI poultry meat and availability, feed price and residual dummy (Table 9). The lag lengths of the variables in the model are ARDL (5,6,4,0) which are chosen using AIC method. The results of the ECM equation indicate that the log of deviation of total availability has a negative and significant relationship with CPI poultry in the long run, i.e., a one per cent increase in the deviation of total availability can lead to 0.05 per cent decrease in the CPI poultry meat prices (Table 10). The results also suggest a significant and positive long-term relationship of CPI poultry meat with log of feed prices, i.e., a one per cent increase in feed price leads to 1.15 per cent increase in the CPI poultry meat prices. The coefficient of ECM term is statistically significant and negative indicating that in case of any deviation from the long run equilibrium due to a shock, the system converges back to equilibrium, with 6 per cent of the disequilibrium getting corrected within a month. The diagnostic tests for the ARDL model indicate satisfactory results with the Breusch-Godfrey test indicating no serial correlation. Further, the poultry meat model is also stable as indicated by CUSUM test (Chart 30). Egg Model Estimation In case of egg, the ADF test indicates that CPI Egg, WPI Soya Maize, and Real Wages are stationary in their first differences, while Availability Usage deviation is stationary in level (Table 11). For estimating factors impacting eggs prices, the sample period covers March 2010 to December 2022. Our variable of interest here is the normalised deviation of availability to usage ratio from its 3-years moving average (which partly addresses seasonality) as a proxy for the stock variable (Log Availability Usage Deviation), real agricultural wages (Log Real Wages) and the weighted average of soya bean and maize WPI based on the composition in poultry feed (Log Soya Maize WPI Index) as a measure of input costs. These variables have been log transformed and seasonally adjusted for the purpose of estimation. Apart from these, the model includes COVID dummy to capture the impact of COVID-19 pandemic on poultry sector and lastly, a Residual Dummy to control for outliers and extreme events in the regression model.24 The ARDL bounds test confirms the existence of a long run cointegrating relationship between CPI egg and availability to usage ratio, soya and maize WPI, real agricultural wages, and COVID-19 and Residual dummy (Table 12). The optimal lag lengths of the variables for egg model are ARDL (2, 2, 2, 0, 1), based on AIC criterion. The estimates of long run coefficients from the ARDL specification and the short run dynamics are presented in Table 13. The results show that availability to usage deviation (stock variable), real agricultural wages and soya and maize WPI index are significant determinants of CPI egg prices. The long-run estimates show that our stock variable and CPI egg are negatively related, i.e., a one per cent increase in deviation in availability to usage ratio in egg decreases CPI egg prices by 0.02 per cent. On the other hand, the soya and maize price index, a proxy for feed cost, is positively related to CPI egg, with a one per cent increase in these feed prices leading to 0.61 per cent increase in CPI egg prices. Similarly, real agricultural wages show a positive relation with CPI egg, with one per cent increase in real wages, increasing egg prices by 0.36 per cent. The coefficient of ECM term is negative and statistically significant which indicates convergence, and the coefficient suggests that 7 per cent of the disequilibrium (deviation from equilibrium) gets corrected within a month. The diagnostic tests for the ARDL model are satisfactory, with the absence of any serial correlation in the estimated residuals. Moreover, the CUSUM test suggests that the estimated egg model is stable (Chart 31). The estimates indicate that supply-side variables such as availability/ stocks and input costs (proxied by feed and fodder/ soybean and maize prices in the WPI) are important drivers of dairy and poultry prices and therefore, should be taken into account while formulating policies to manage livestock inflation. The actual and fitted values for the three commodities are given in Annex Chart A1. VII.1. Inflation Forecasts of Milk, Egg and Chicken In this section, we attempt to forecast inflation for milk, poultry meat and egg for a 12-month horizon using time series-based univariate and multi-variate models following the literature and incorporating the balance sheet variables that are found to be significant in the ARDL model. In addition to modelling the dependent variable solely as a function of its past values and disturbances as in the case of ARIMA models (Gujarati and Sangeetha, 2007), various studies have also used ARIMAX modelling. In ARIMAX modelling, the dependent variable is a function of not only ARMA disturbance process but also a linear combination of more than one explanatory variable (in our case the feed costs and computed availability/net availability from the balance sheet). As the CPI for livestock products as well as the balance sheet variables exhibit seasonality, these variables have been seasonally adjusted (using X-13 seasonal adjustment procedures in E-VIEWS) before using them for forecasting. Thus, the study uses seasonal autoregressive integrated moving average (SARIMA) and SARIMA with exogenous variable (SARIMAX) models to provide 12 months ahead inflation forecasts (i.e., pseudo out of sample forecast) for milk, poultry meat and egg to gauge their forecasting performance under two approaches – out of sample and rolling forecasts. The non-stationary variables were transformed using first difference to make them stationary and then used for SARIMA/SARIMAX model-based forecasting. First, the forecast evaluation was done by stopping the sample period in December 2021 and generating forecasts for 2, 4, 6, 8, 10, and 12 months ahead until December 2022, which were then compared with actual inflation outcomes using root mean squared error (RMSE)25 for all the methods. The RMSE of each forecasting model is evaluated for the ‘full sample’ as well as for ‘out of sample’ forecasts. In the ‘full sample’ forecast evaluation, RMSEs are computed for 2, 4, 6, 8,10 and 12 months horizon, starting from April 2012 for milk and poultry meat, and January 2010 for egg until December 2022 based on the availability of the data. While in the ‘out of sample’ forecasts, we compute RMSEs for 2, 4, 6, 8,10 and 12 months horizon for the period between January 2022 to December 2022 for all the three commodities. Table 14 provides a summary of the results. For milk, the SARIMAX model shows consistently lower error (better forecasts) over the SARIMA model across all the forecast horizons, for both ‘full sample’ and ‘out of sample’ forecast evaluation. The exogenous variable used in SARIMAX forecasting for milk include net availability26 as well as WPI feed and fodder27. For poultry meat, SARIMAX outperforms SARIMA in the ‘full sample’ except for the 10- and 12-month forecast horizons. Whereas, in case of ‘out of sample’ forecast evaluation, SARIMA model outperforms SARIMAX across all the horizons (Annex Table A7). The exogenous variable used in SARIMAX forecasting include availability28 computed from the poultry balance sheet. In case of egg also, the SARIMAX model shows superior performance over the SARIMA model across all the horizons for the ‘full sample’ and except for the 2-month horizon for ‘out of sample’ forecast evaluation. The exogenous variables used in SARIMAX forecasting for egg include availability to usage ratio29 as well as global soya and maize price30. The Diebold and Mariano (DM) test for accuracy of forecasting models also suggests that SARIMAX performs better than SARIMA for the full sample (Annex Table A8). The results thus support our premise that the balance sheet variable (net availability or deviation of availability to usage ratio) along with other macro variables (found through ARDL regression) can help in improving forecast of inflation in milk and egg both in-sample and out of sample, and in-sample for poultry meat. Second, we check the forecasting performance of SARIMAX over SARIMA using rolling window of 60 months for the full sample period (from January 2010 to December 2022 for egg, and April 2012 to December 2022 for milk and poultry meat) vis-à-vis actual CPI inflation of these commodities. The exogenous variables in SARIMAX vary across the three livestock commodities, albeit they were found to be significant in explaining the movement in CPI through the ARDL modelling approach as discussed above. We found that SARIMAX was the best performing model for egg and poultry meat over all the horizons, and for milk except for 2 and 10 months ahead forecasts (Chart 32). VIII. Conclusion and Policy Suggestions The post-COVID period witnessed a surge in inflation along with increase in its volatility in animal protein-rich items, particularly milk, poultry meat and egg. This paper empirically estimated the factors driving inflation in milk, poultry meat and egg using structural models and used some of the structural variables to improve forecasting of inflation in these commodities up to 12 months ahead, after evaluating the performance of diverse forecasting models. For this, the study developed a dynamic monthly balance sheet to assess the real-time (monthly) demand-supply gap for each of these commodities and used it for modelling and forecasting prices. It computed the net availability for milk, availability for poultry meat, and availability-to-usage ratio for egg using both secondary data and inputs (market intelligence) provided by key stakeholders, including farmers, traders, and processors in the livestock and poultry value chain. Using ARDL model for each commodity, the study found that along with the balance sheet variable, supply-side variables such as the WPI soybean and maize prices (as proxies for feed or input costs for poultry meat and egg) and the WPI feed and fodder (input costs for milk) also significantly impact prices of milk, poultry meat and egg. Furthermore, from a policy perspective, accurate forecasting of livestock and poultry inflation holds importance, especially as food inflation often drives headline inflation significantly in India. Therefore, the paper forecasts inflation in milk, poultry meat, and egg over a 12-month horizon using time-series-based univariate and multivariate models, while including the balance sheet (availability/ availability to usage ratio) and input costs variables that were found to be significant in the ARDL model. The forecasting performances of SARIMA and SARIMAX models were empirically evaluated for both out-of-sample forecasts and rolling forecasts. The findings revealed that SARIMAX, which incorporates the balance sheet availability/ availability-to-usage variable, generally performs better across most time horizons. Lastly, based on the research findings, the study proposes some policy measures to improve the dairy and poultry value chain with the aim of stabilising inflation in the livestock sector while promoting the sector’s growth over the medium- to long-term. Policy Suggestions for Milk The operational efficiency of the milk industry could be improved by, inter alia, creating a more efficient value chain, implementing dynamic milk procurement methods, strengthening cooperative/organised sectors, creating a feed bank and increasing fodder productivity, implementing an integrated animal health plan and technology, and rationalising the trade policy measures. Rationalising Trade Policy Regime Rationalising the import policy regime through timely calibration of tariffs and duties could be a short-term measure to stabilise inflation in milk. The import duty can be reduced from the current levels of 60 per cent on SMP and 40 per cent on butter, which can help reduce the price pressures on milk at the retail level by augmenting milk supply during the lean season. However, the reduction in import duties may be calibrated such that they do not harm price realisation of domestic dairy farmers. As a short-term measure, if needed, the NDDB and major cooperatives may be allowed to import milk fat and SMP to build up a reasonable buffer stock necessary for the lean season. Furthermore, SMP and butter could be brought under an Open General License (OGL) scheme and imports may be released in a calibrated manner to meet demand, without significantly impacting procurement prices paid to dairy farmers. Imports of cattle/buffalo germplasm fall under India’s restricted list. The introduction of temperate breeds into India, for crossbreeding with indigenous non-descript cattle, has long been accepted given the strong demand for exotic germplasm. In the medium to long term, imports may be allowed to increase the availability of exotic breed semen in larger areas, which can help increase the overall milk productivity. Building an Efficient Value Chain To increase the efficiency of the value chain, establishment of more bulk milk chilling (BMC) centres across all states could be prioritised to increase procurement. This will require investment in upgrading or building new dairy plants and small processing units in the cooperative sector to process milk into different forms for storage. Improved infrastructure to store milk in processed form can promote export competitiveness of the dairy industry and also help tackle the challenge of low processing in the organised sector. This may also enable in aligning SMP and butter prices in India with international (Oceania) prices. Technology related to the fabrication of insulated (non-refrigerated) rail containers for transporting milk and milk dispensing machines could help in strengthening milk flow in the economy at a larger scale. Integrated Animal Health Plan for Increasing Productivity and Production To increase milch productivity, investments in artificial insemination for female exotic and crossbreed cows/buffalo could be promoted. The private sector may also be encouraged to set up modern testing facilities in various regions of the country to check for quality control and augment stable supplies. Proactive measures may be needed to control frequent outbreaks of foot and mouth disease and lumpy skin disease by setting up fast medical action boards. Feed Bank and Fodder Productivity This can be achieved by procuring feed at a larger scale and building infrastructure for storing feed and fodder from different crops, which can be resold at affordable rates to help control feed and fodder inflation. In view of large shortages in green, dry fodder and roughages, appropriate steps may be taken to augment efficient supplies of fodder as it is a major source of cattle feed. The area under forage crops has decreased in recent years due to a shift towards cash crops. In this situation, the barren lands can be utilised for growing grasses which require less amount of water and care, and the seed for the forage crops could be genetically modified to increase the productivity of these grasses. This requires agricultural extension services for farmers as well as investment for promotion of forage crops. Policy Suggestions for Poultry Removing Trade Policy Distortions India has good potential in the export of poultry products; however, the country needs a freight advantage to be competitive with other nations like Brazil and the USA who are the biggest exporters of poultry. The basic customs duty on the import of cuts and offal, frozen category is 100 per cent and not cuts in pieces offal, frozen category is 30 per cent. To cater to the seasonal demand and contain meat inflation in the short run, the duty on cut pieces could be reduced appropriately to promote competition and improve efficiency. Infrastructural Development and Cold Chain Facilities Inadequate infrastructure including processing and cold chain facilities and not matching with the international quality standards are some of the factors impeding poultry sector exports. In this regard, incentivising Foreign Direct Investment (FDI) or Public-private Partnerships (PPPs) in the poultry value chain to upgrade infrastructure, improve technology, and improve farm management practices could provide a further boost to the sector. Despite the significant involvement of the private sector, concerns persist regarding the maintenance of food safety standards which needs attention. Lowering Production Cost Feed cost constitutes the major cost of production in the poultry sector. Maize and soybean constitute 95 per cent of total feed cost, and hence their prices have a direct bearing on the cost of production. Therefore, policy measures to increase the productivity of maize and soyabean, and to make quality feed available at affordable prices could be prioritised. Building Institutions for Incorporating Poor Producers As commercial poultry is a sustainable option for the income generation of a large number of producers in rural areas, the collectivisation of smallholders could be encouraged. A poultry farming model similar to Amul could help small farmers market their products across India. There are subsidies that exist in the form of institutional support but those are majorly directed towards commercial poultry. Therefore, public investment for institutional development can help small farmers reduce their transaction costs while accessing quality inputs and markets for fair and remunerative prices for their produce. 1 This study is part of a joint research project on “Understanding Price Dynamics of Major Agricultural Commodities and Identifying Ways to Improve Value-chains” by the Reserve Bank of India (RBI) and the Indian Council for Research on International Economic Relations (ICRIER). Shyma Jose, Manish Kumar Prasad and Sabarni Chowdhury are researchers and Dr. Ashok Gulati is Distinguished Professor at the ICRIER. Binod B. Bhoi, Vimal Kishore and Himani Shekhar are Director, Assistant General Manager and Manager, respectively, in the Department of Economic and Policy Research (DEPR), RBI. The authors thank Sujata Kundu, internal discussant from RBI and an anonymous external reviewer for their valuable comments and suggestions. The views expressed in this paper are those of the authors and do not represent the views of the institutions to which they belong. 2 There are about 303.8 million bovines (cattle, buffalo, mithun and yak), 74.3 million sheep, 148.9 million goats, 9.1 million pigs and about 851.8 million poultry in the country as per the 20th Livestock Census (DAHD, 2021). 3 In terms of value of output, milk contributed 65.1 per cent, while poultry meat and eggs had shares of 10.8 per cent and 3.5 per cent, respectively, in the total value of livestock products in Triennium Ending (TE) 2021-22 (at current prices). 4 The item-wise monthly Consumer Price Index (CPI) data is not unavailable for March, April, and May 2020. Therefore, to address this gap, the study has imputed commodity-wise CPI values using the available sub-group CPI data for those months. 5 The National Sample Survey Office (NSSO), Ministry of Statistics and Programme Implementation (MoSPI)), GoI released the summary results of Household Consumption Expenditure Survey (HCES) conducted during August 2022 to July 2023 relating to estimated Monthly Per Capita Consumption Expenditure (MPCE) in the form of a factsheet in February 2024 and the detailed report in June 2024. 6 For instance, lean season data for 2023-24 includes February and March data from the financial year 2022-23. 7 The Factsheet of HCES 2022-23 was released by the NSSO in February 2024 and the detailed report in June 2024. 8 The indigenous buffaloes contribute 31.9 per cent of total milk production in the country whereas crossbred cattle contribute to 29.8 per cent. The rest of the milk production is contributed by indigenous cattle, non-descript cattle, non-descript buffaloes, exotic cows and goats (BAHS, 2023). 9 India generally imports leg chicken pieces from the USA. 10 The poultry meat export includes meat/edible offal of fowls of the species Gallus domesticus not cut in pieces (fresh/chilled). 11 Out of total, green-wet fodder of 25 per cent must be from leguminous species and 75 per cent from monocot grasses. 12 Price of Amul’s toned milk was increased by Rs.3/litre to Rs.54/litre, while full cream milk was increased by Rs.3/litre to Rs.66/litre in February 2023 (ToI, 2023). 13 Major varieties of parent stock of chicks include Vanaraja (ICAR-Directorate of Poultry Research), Gramapriya (ICAR-Directorate of Poultry Research), Chabrown (Central Poultry Development Organisation), and Aseel Cross (Central Poultry Development Organisation and Training Institute, and Giriraja (Karnataka Veterinary, Animal, and Fishery Sciences University). 14 For our balance sheet, we have considered buttermilk preparation from curd equivalent, i.e., 1 kg of curd is diluted with 1.5 liters of water to produce 2.5 kg of buttermilk. 15 For our balance sheet calculation, we have assumed that the milk contains 3.5 per cent fat and 8.5 per cent SMP (Skimmed Milk Powder), which are typical composition found in cow milk. 16 During our interaction, the broiler industry experts emphasised that annual production estimates from BAHS, GoI for various years are underestimated and do not indicate accurate estimates of broiler production. 17 Field survey data for poultry meat has been used and it falls under the range of CIPHET farm operation losses which is 2.74+/-0.72. 18 The Factsheet of HCES 2022-23 was released by the NSSO in February 2024 and the detailed report in June 2024. 19 Negative stock levels (excluding carry-forward) indicate an excess demand during these months. 20 It is another measure of supply and demand interrelationship of commodities and is an estimate of the level of supply for a given commodity at a point in time as a percentage of its total demand or use. 21 The shock period months include May 2021 to June 2021, December 2019 to April 2020, and October 2018 and June 2013. 22 The net availability deviation has been normalised. 23 In poultry meat, there were four external shocks during March, April and May 2020 as well as July 2021. 24 In egg, there were 12 external shocks during May 2010, September 2012, November 2012, December 2012, February 2013, June 2015, November 2017, July 2020, September 2020, April 2021, May 2021 and November 2022. 26 Log of deviation of net availability. 27 Log of Weighted Average of WPI Feed and Fodder Index. 28 Log of Normalised Deviation of Availability from 3-years Moving Average. 29 In egg forecasting, we have used Log of Availability Usage Ratio rather than transformed variable (Log Availability Usage Deviation) to improve the forecasting performance. 30 Log WPI Soya Maize has been substituted by Log Global Soya Maize Prices (weighted average of soyabean and maize prices from World Bank Pink Sheets) as a proxy for feed costs for forecasting. References Abdallah, B. M., Farkas, F., M., and Lakner, Z. (2020). Analysis of dairy product price transmission in Hungary: A Nonlinear ARDL Model. Agriculture, 10(6), 217. Agmarknet (2022). Wholesale Prices. Directorate of Marketing and Inspection (DMI), Ministry of Agriculture and Farmers’ Welfare, Government of India. Aiolfi, M., and Timmermann, A. (2006). Persistence in forecasting performance and conditional combination strategies. Journal of Econometrics, 135(1-2), 31-53. Anand, R., Kumar, N., and Tulin, M. V. (2016). Understanding India’s food inflation: The role of demand and supply factors. IMF Working Paper 16/2. International Monetary Fund. https://www.imf.org/external/pubs/ft/wp/2016/wp1602.pdf Atalan, A. (2023). Forecasting drinking milk price based on economic, social, and environmental factors using machine learning algorithms. Agribusiness, 39(1), 214-241. BAHS (2020). Basic Animal Husbandry Statistics - 2020, Ministry of Fisheries, Animal Husbandry and Dairying, GoI. BAHS (2021). Basic Animal Husbandry Statistics - 2021, Ministry of Fisheries, Animal Husbandry and Dairying, GoI. BAHS (2023). Basic Animal Husbandry Statistics - 2023, Ministry of Fisheries, Animal Husbandry and Dairying, GoI. Banerji, A., and Meenakshi, J. V. (2004). Buyer collusion and efficiency of government intervention in wheat markets in northern India: An asymmetric structural auctions analysis. American Journal of Agricultural Economics, 86(1), 236–253. http://www.jstor.org/stable/3697887 Behera, H., Wahi, G., and Kapur, M. (2018). Phillips curve relationship in an emerging economy: Evidence from India. Economic Analysis and Policy, 59 (C), 116-126. Benes, J., Clinton, K., George, A.T., Gupta, P., John, J., Kamenik, O., Laxton, D., Mitra, P., Nadhanael, G.V., Portillo, R., Wang, H. and Zhang, F. (2016). Quarterly projection model for India: Key elements and properties. RBI Working Paper, 08/2016 (RBI WPS (DEPR): 08/2016). Department of Economic and Policy Research, Reserve Bank of India, Mumbai https://rbidocs.rbi.org.in/rdocs/Publications/PDFs/WPSN8EC0A00B61AC2462797F9C1DDCCBB5078.PDF Bhadauria, P., Kataria, J. M., Majumdar, S., Bhanja, S. K., Divya, G., and Kolluri, G. (2014). Impact of hot climate on poultry production system - A review. Journal of Poultry Science and Technology, (2)4, 56-63. https://krishi.icar.gov.in/jspui/bitstream/123456789/27430/1/Dr.%20Pragya%20IJPST_Climate%20change.pdf Bhattacharya, R., and Sengupta, A. (2015). Food inflation in India: Causes and consequences. NIPFP Working Paper 2015-151. National Institute of Public Finance and Policy, New Delhi. Bhattacharya, R. and Sengupta, A. (2018). Drivers and impact of food inflation in India. Macroeconomics and Finance in Emerging Market Economies, 11(2), 146-168. DOI: 10.1080/17520843.2017.1351461 Bhoi, B. B., Kundu, S., Kishore, V. and Suganthi, D. (2019). Supply chain dynamics and food inflation in India. RBI Bulletin, October. Department of Economic and Policy Research, Reserve Bank of India, Mumbai. Chand, R., Prasanna, P. L., and Singh, A. (2011). Farm size and productivity: Understanding the strengths of smallholders and improving their livelihoods. Economic and Political Weekly, 46(26-27), 5-11. DAHD (2016). National action plan for egg and poultry-2022. Department of Animal Husbandry and Dairying, MoFAHD, GoI, New Delhi https://www.dahd.nic.in/sites/default/filess/Seeking%20Comments%20on%20National%20Action%20Plan-%20Poultry-%202022%20by%2012-12-2017.pdf DAHD. (2019). Farmers manual. Department of Animal Husbandry and Dairying, MoFAHD, GoI, New Delhi. https://dahd.nic.in/division/farmers-manual DAHD. (2020). 20th Livestock census (2019). Department of Animal Husbandry and Dairying, MoFAHD, GoI, New Delhi. https://dahd.nic.in/sites/default/filess/20th%20Livestock%20census-2019%20All%20India%20Report_0.pdf DAHD (2021). Lok Sabha, November 30th 2021. Department of Animal Husbandry and Dairying, MoFAHD, GoI, New Delhi. http://164.100.24.220/loksabhaquestions/annex/177/AU328.pdf DAHD (2022). Annual Report 2021-22. Department of Animal Husbandry and Dairying, MoFAHD, GoI, New Delhi. https://dahd.nic.in/sites/default/filess/AnnualEnglish.pdf Elliott, J. G., and Dale, R. J. (1980). Further experiences of beef production on permanent pasture in 1976–78. Grass and Forage Science, 35(4), 319-321. Emsley, A. (2006). The role of trade in genetic stock in transmitting avian influenza. The Market and Trade Dimensions of Avian Influenza. http://www. fao. org/docs/eims/upload/234378/ah673e00.pdf. FAO (2003). Egg marketing - A guide for the production and sale of eggs. https://www.fao.org/3/Y4628E/y4628e00.htm#Contents FAO (2021). Meat market review: Overview of global meat market developments in 2020. https://www.fao.org/3/cb3700en/cb3700en.pdf FAOSTAT (2022). FAOSTAT. Food and Agriculture Organization, Rome. Gandhi, P. V., and Zhou, Z.Y. (2010). Rising demand for livestock products in India: Nature, patterns and implications. Australasian Agribusiness Review, 18(1673-2016-136846), 103-135. Gokarn, S. (2011). Food inflation: This time it’s different. RBI Monthly Bulletin, January, Reserve Bank of India. Gopakumar, K. U., and Pandit, V. (2017). Food inflation in India: Protein products. Indian Economic Review, 52(1-2), 157-179. Griessel, G. D. (2015). Forecasting South African food inflation. Bloemfontein- University of the Free State (Doctoral dissertation). http://hdl.handle.net/11660/2044 Gujarati, D. and Sangeetha, N. (2007). Basic Econometrics. Fourth Edition, Tata McGraw-Hill, New Delhi. Gulati, A., Ganguly, K., and Wardhan, H. (2022). Agricultural value chains in India: Ensuring competitiveness, inclusiveness, sustainability, scalability, and improved finance. Springer Nature. https://link.springer.com/content/pdf/10.1007/978-981-33-4268-2.pdf Gunasekar, K. R. (2006). Formulating feeds for broiler performance. The PoultrySite. http://www.thepoultrysite.com/articles/560/for mulating-feed-for-broiler-performance, April 24. Gupta, P. R. (2017). Dairy India. (7th Ed.). Dairy India: New Delhi. IGFRI. (2013). Vision 2050. Indian Grassland and Fodder Research Institute. ICAR, New Delhi. Ihsan, R. N., Saadah, S., and Wulandari, G. S. (2022). Prediction of basic material prices on major holidays using multi-layer perceptron. Jurnal Media Informatika Budidarma, 6(1), 443-452. Jha S.N., Vishwakarma R.K., Ahmad T., Rai A. and Dixit A.K. (2015). Report on assessment of quantitative harvest and post-harvest losses of major crops and commodities in India. ICAR-All India Coordinated Research Project on Post-Harvest Technology, ICAR-CIPHET, PAU, Ludhiana. John, J., Singh, S., and Kapur, M. (2020). Inflation forecast combinations - The Indian experience. RBI Working Paper Series No. 11, (RBI WPS (DEPR): 11/2020). Department of Economic and Policy Research, Reserve Bank of India, Mumbai. Kabeer, N., and Murthy, R. K. (1996). Compensating for institutional exclusion? Lessons from Indian government and non-government credit interventions for the poor. IDS Discussion Paper No. 356. Institute of Development Studies, Brighton. Kaicker, N., Gupta, A., and Gaiha, R. (2022). COVID-19 pandemic and food security in India: Can authorities alleviate the disproportionate burden on the disadvantaged? Journal of Policy Modeling, 44(5), 963-980. https://doi.org/10.1016/j.jpolmod.2022.08.001 Kumar, F., Tyagi, P. K., Mir, N. A., Dev, K., Begum, J., Tyagi, P. K., Biswas, A., Sahu, B., Dinani, O. P., and Sharma, D. (2021). Growth pattern, lipid composition, oxidation status, and serum biochemical profile of broiler chicken fed flaxseed meal for different durations. Letters in Animal Biology, 01(01), 08-18. Kumar, P., Kumar, A., Parappurathu, S and Raju S.S. (2011). Estimation of demand elasticity for food commodities in India. Agricultural Economics Research Review. Vol. 24, pp1-14. Kussaiynor, T. A., and Zhakupova, Z. O. (2019). Forecasting the milk prices from a supply chain management perspective in the northern Kazakhstan. International Journal of Supply Chain Management, 8(4), 851-858. Lawrence, J. D., Mintert, J. R., Anderson, J. D., and Anderson, D. P. (2008). Feed grains and livestock: Impacts on meat supplies and prices. Choices, 23(316-2016-6897), 11-15. https://www.choicesmagazine.org/magazine/article.php?article=25 Mallick, P., Muduli, K., Biswal, J. N., and Pumwa, J. (2020). Broiler poultry feed cost optimization using linear programming technique. Journal of Operations and Strategic Planning, 3(1), 31-57. https://doi.org/10.1177/2516600X19896910 Mehta, R., and Nambiar, R. G. (2007). The poultry industry in India. In the Paper delivered at the FAO Conference on ‘Poultry in the 21st Century’ pp. 5-7, November. Mishra, P., and Roy, D. (2016). Food inflation in India. In Taming Indian Inflation, IMF Publications. https://doi.org/10.5089/9781513541259.071 Mittal, S. (2008). Demand-supply trends and projections of food in India. ICRIER Working Paper No. 209. Indian Council for Research on International Economic Relations, New Delhi. MoSPI. (2023). Ministry of Statistics and Programme Implementation. NSO, Government of India. Nair, S. R. and Eapen, L.M. (2012). Food price inflation in India (2008 to 2010): A commodity-wise analysis of the causal factors. Economic and Political Weekly, 47(20), 46-64. National Dairy Development Board (NDDB) (2022). Annual Report 2021-22. https://www.nddb.coop/sites/default/files/pdfs/NDDB_AR_2022_121122_Eng.pdf National Dairy Development Board (NDDB) (2020). Annual Report 2019-20. https://www.nddb.coop/sites/default/files/pdfs/NDDB_Annual_Report_2019_20_Eng.pdf NITI Aayog. (2020). Demand and supply projections towards 2033. Crops, livestock, fisheries and agricultural inputs. The Working Group Report. NITI Aayog https://niti.gov.in/sites/default/files/2019-07/WG-Report-issued-for-printing.pdf OECD-FAO. (2022). OECD-FAO Agricultural Outlook 2022–2031. Rome. Pesaran, M. H. (1997). Working with Microfit 4.0: Interactive Econometric Analysis. Oxford University Press. Pesaran, M. H., Shin, Y., and Smith, R. J. (2001). Bounds testing approaches to the analysis of level relationships. Journal of Applied Econometrics, 16(3), 289-326. Shah, D. (2016). Synthesis of agribusiness success models under co-operative and private sector in India. http://dx.doi.org/10.2139/ssrn.2885224 Shrestha, M. B., and Bhatta, G. R. (2018). Selecting appropriate methodological framework for time series data analysis. The Journal of Finance and Data Science, 4(2), 71-89. Shyian, N., Moskalenko, V., Shabinskyi, O., and Pechko, V. (2021). Milk price modeling and forecasting. Agricultural and Resource Economics: International Scientific E-Journal, 7(1), 81-95. ToI (2023). Amul raises milk prices by up to Rs.3 per litre, fifth hike since 2021. The Times of India, February 8. Travel, A., Nys, Y., and Bain, M. (2011). Effect of hen age, moult, laying environment and egg storage on egg quality. In Improving the Safety and Quality of Eggs and Egg Products (pp. 300-329). Woodhead Publishing. https://doi.org/10.1533/9780857093912.3.300 Udharwar, S. V. (2020). Scientific feeding of dairy animals. ICAR- Krishi Vigyan Kendra, North Goa. https://kvknorthgoa.icar.gov.in/litpub/Technical%20Folders/Animal%20Science/Scientific%20Feeding%20of%20Dairy%20Animals.pd USDA (2022). India: Indian government resumes GM-origin soybean meal imports. USDA. https://apps.fas.usda.gov/newgainapi/api/Report/DownloadReportByFileName?fileName=Indian%20government%20resumes%20GM-origin%20soybean%20meal%20imports%20_New%20Delhi_India_IN2022-0048.pdf Vandana, G. D., Sejian, V., Lees, A. M., Pragna, P., Silpa, M. V., and Maloney, S. K. (2021). Heat stress and poultry production: Impact and amelioration. International Journal of Biometeorology, 65, 163-179. https://doi.org/10.1007/s00484-020-02023-7 Weimar, M. R., and Stillman, R. P. (1990). A long-term forecasting model of the livestock and poultry sectors. In Proceedings of the NCR–134 Conference on Applied Commodity Price Analysis, Forecasting, and Market Risk Management. Chicago, IL, April. Westcott, P. C., Stillman, R. P., and Collins, K. J. (1987). Quarterly livestock sector adjustments to changes in feed grain prices. Agricultural Economics Research, 39 (1489-2016-126087), 13-24. Wickramarachchi, A. R., Herath, H. M. L. K., Jayasinghe-Mudalige, U. K., Edirisinghe, J. C., Udugama, J. M. M., Lokuge, L. D. M. N., and Wijesuriya, W. (2017). An analysis of price behavior of major poultry products in Sri Lanka. JAS Sri Lanka, 12, 138-148. Zmami M, and Ben-Salha O. (2019). Does oil price drive world food prices? Evidence from linear and nonlinear ARDL modeling. Economies, 7(1), 12. https://doi.org/10.3390/economies7010012 Annex
|
||||||||||||||||||||||||||||||||||||||||||||||||||||||||||||||||||||||||||||||||||||||||
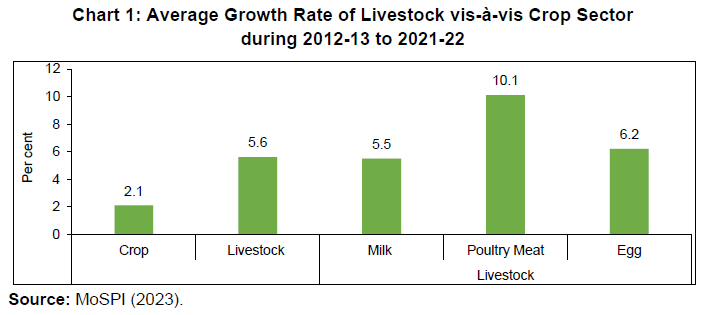
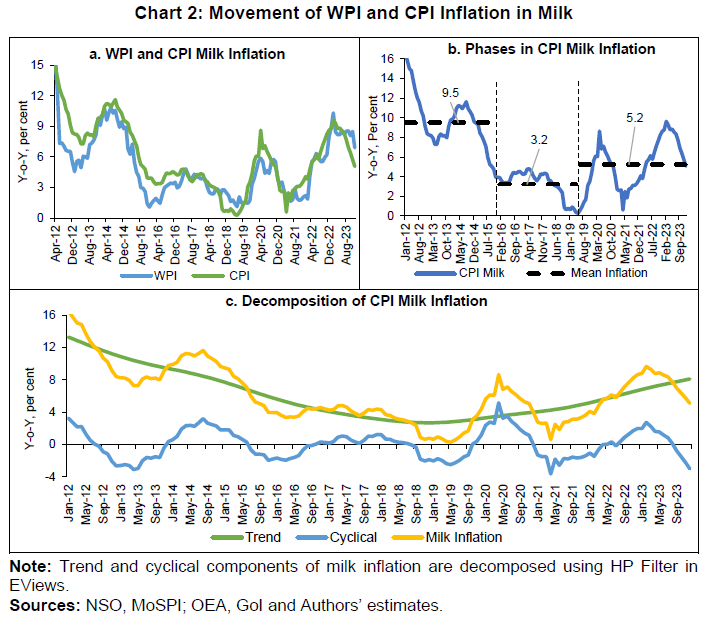
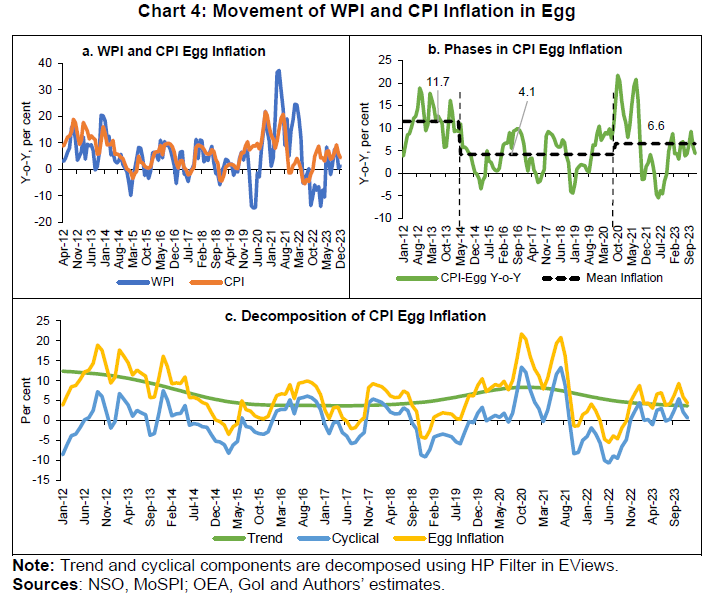
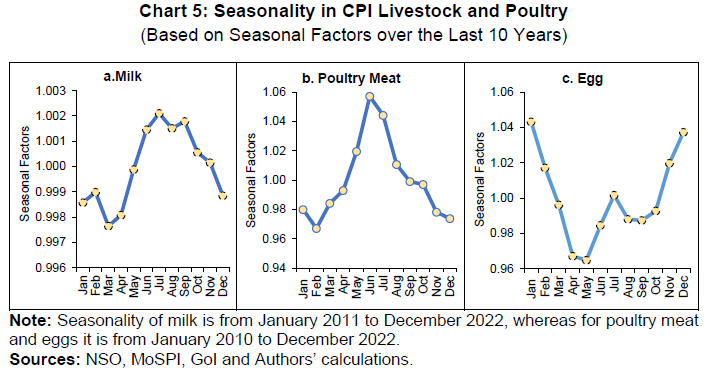
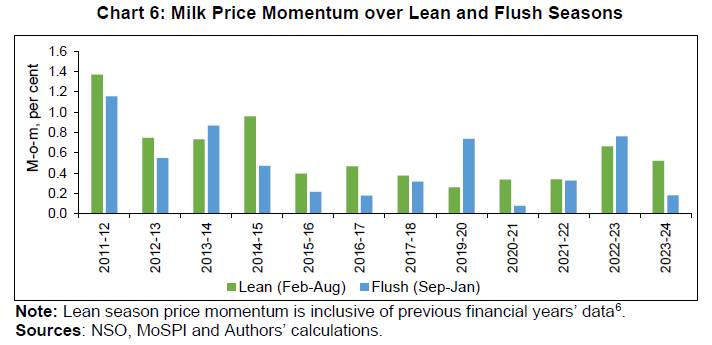
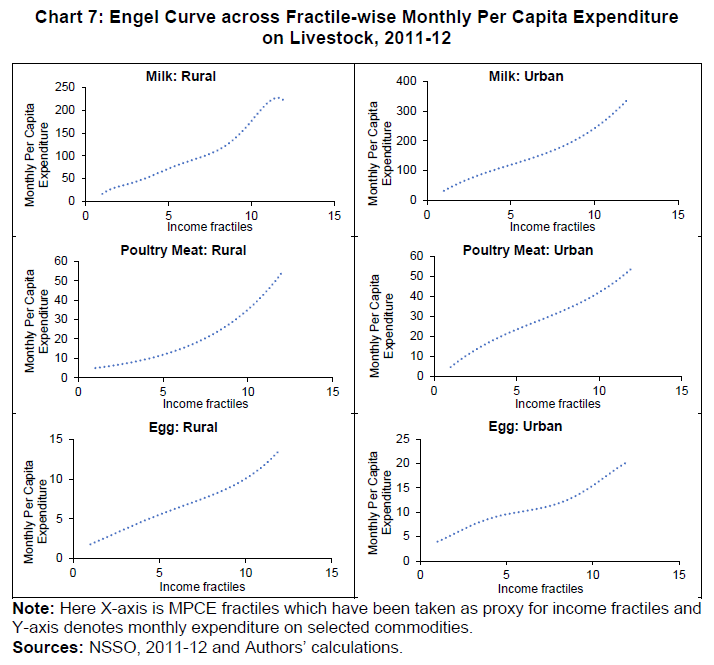
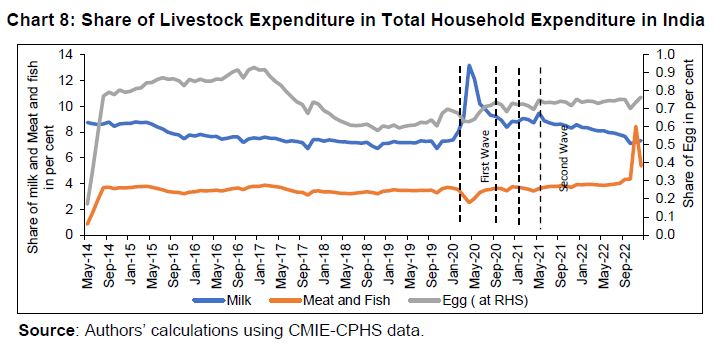
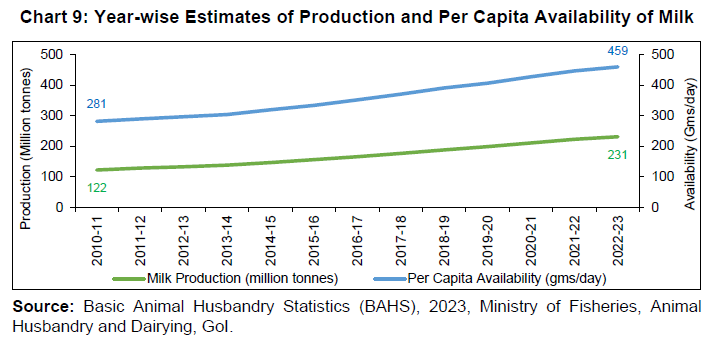

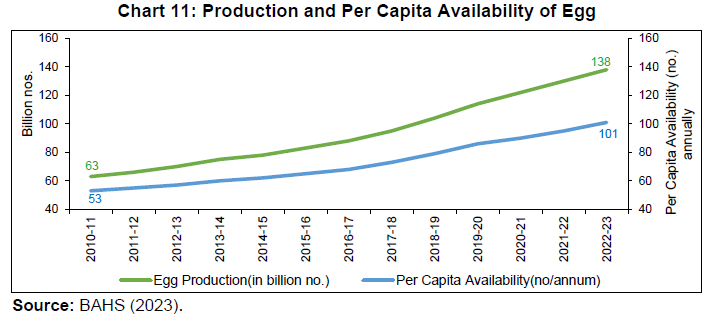
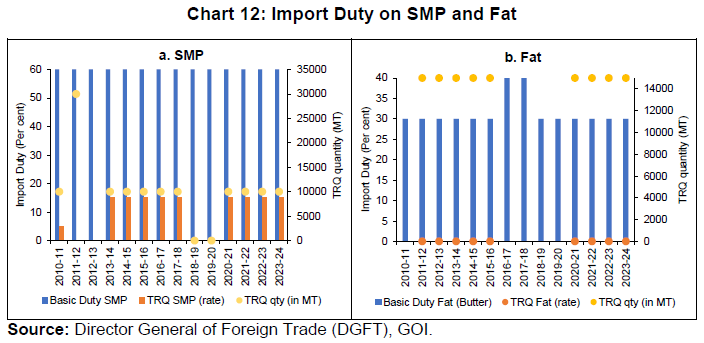
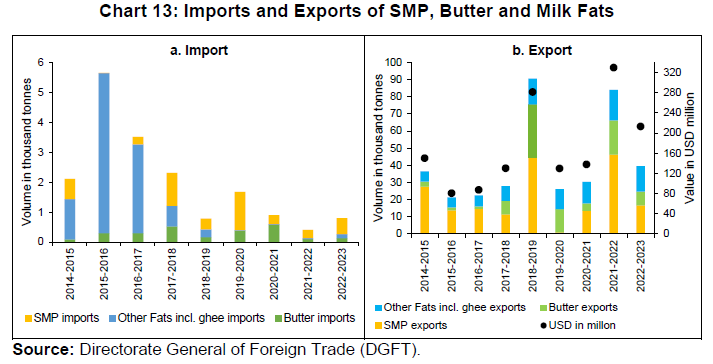
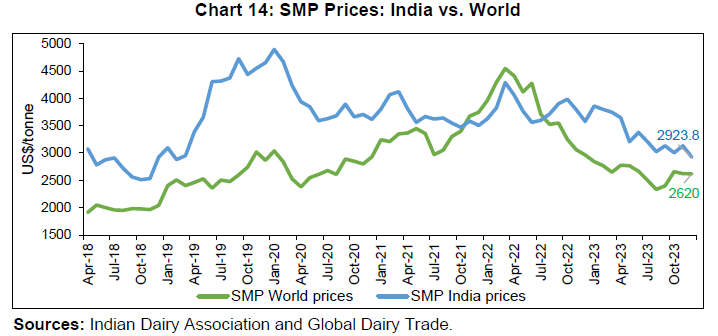
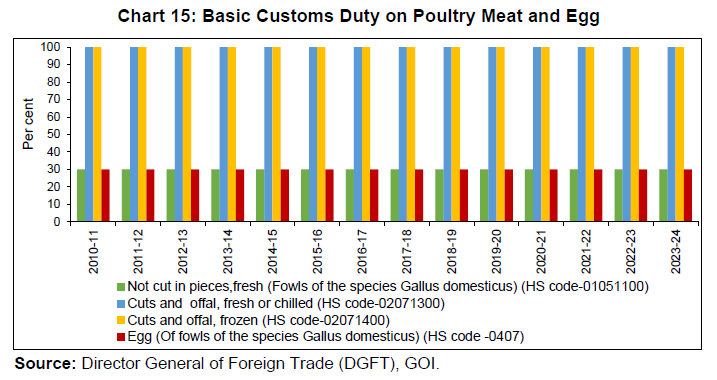
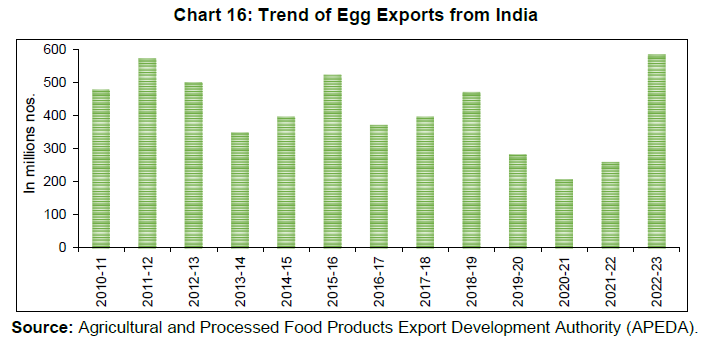
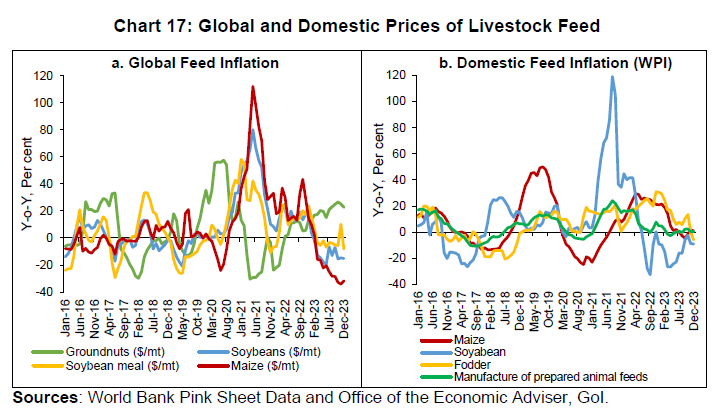
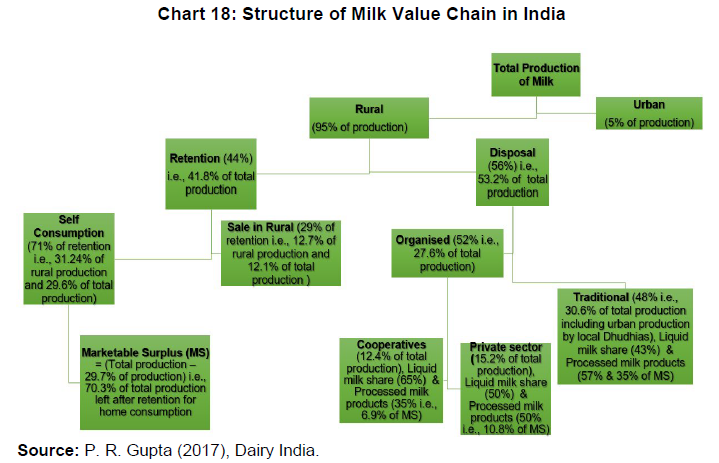
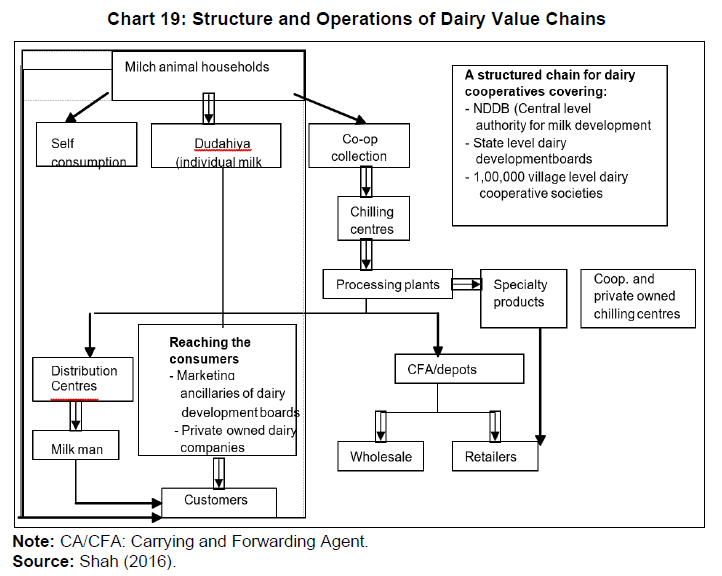
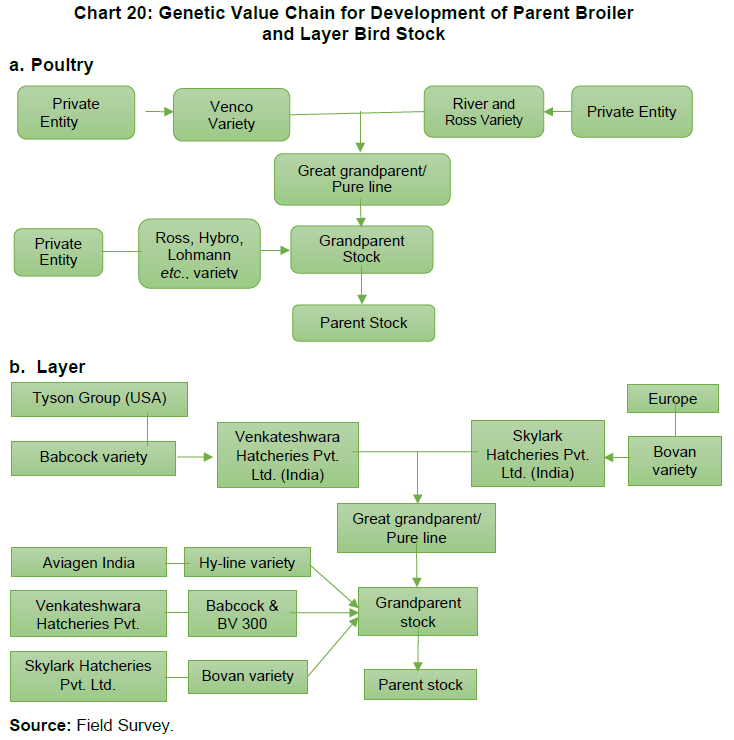

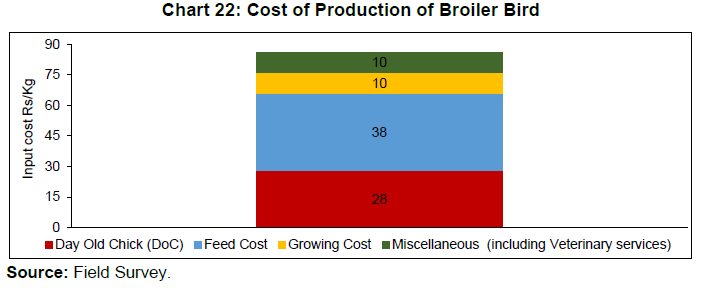
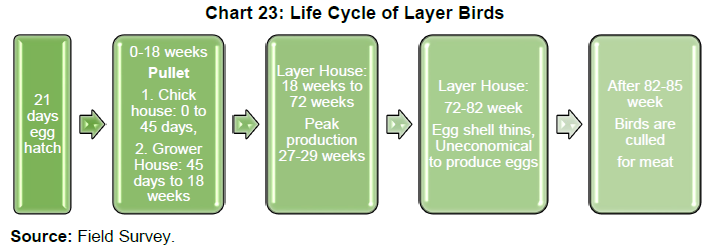
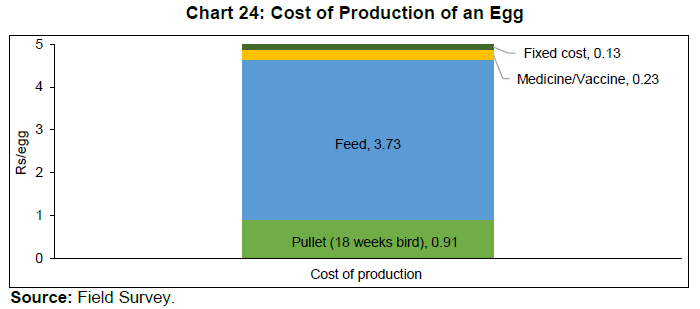
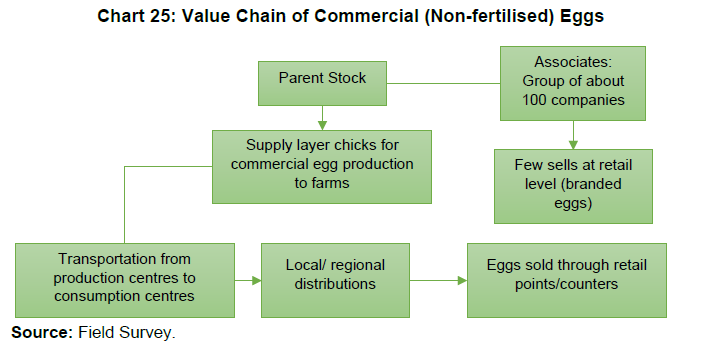
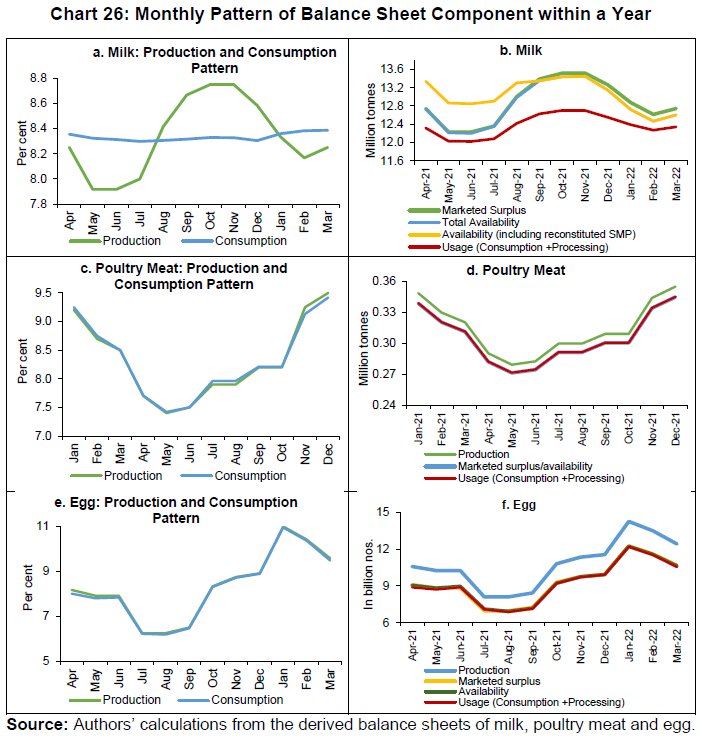
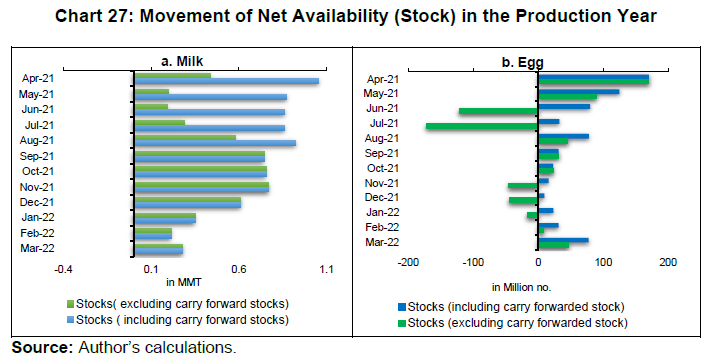
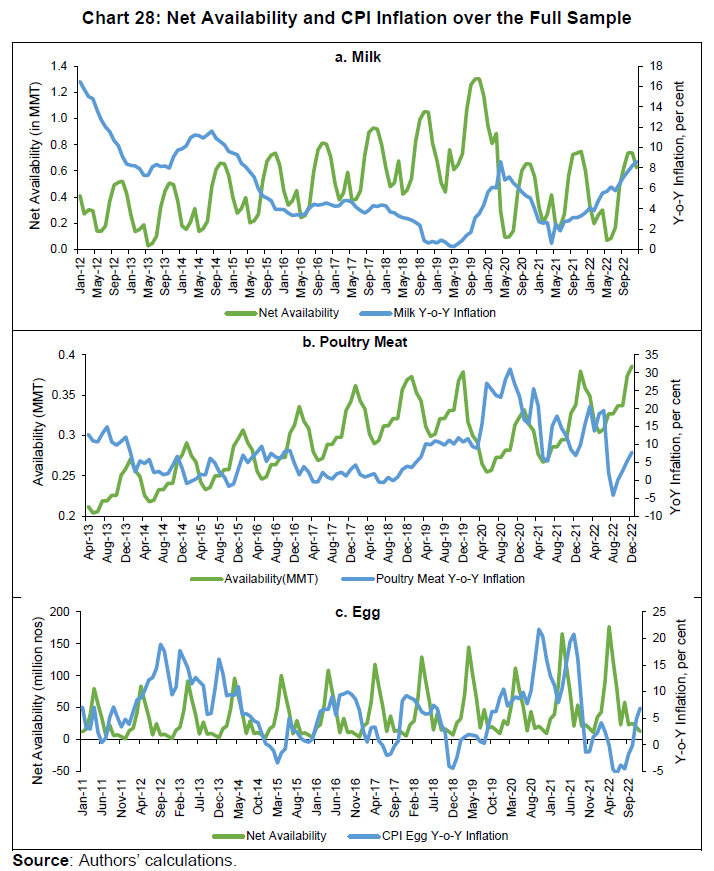
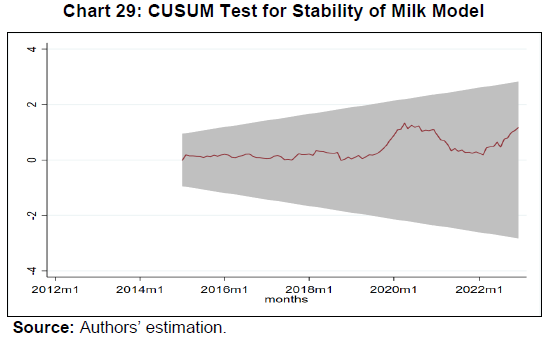
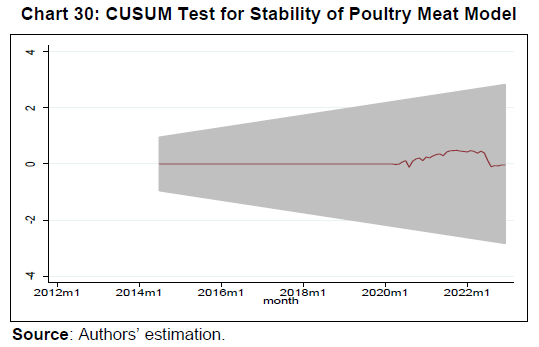
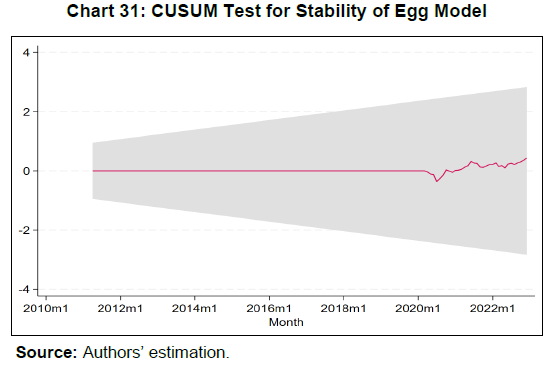
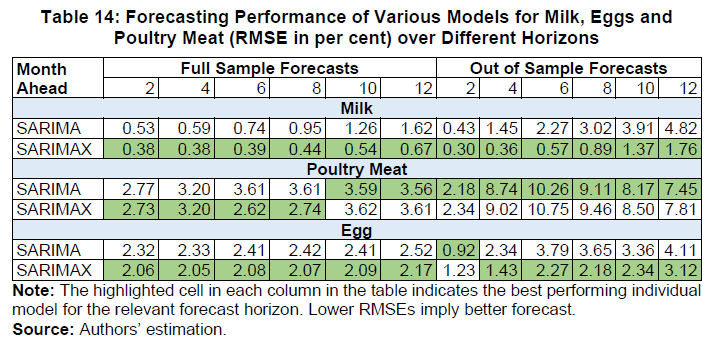
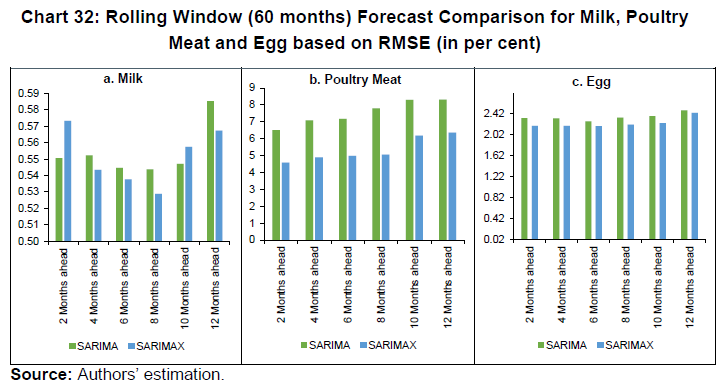

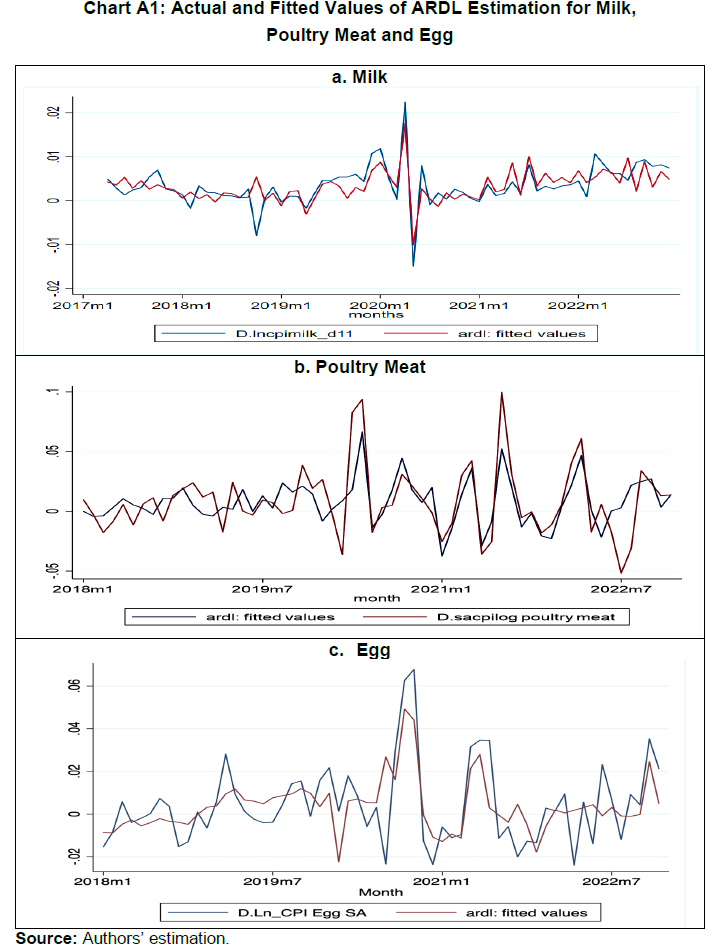

આ પેજ શેર કરો:


રિઝર્વ બેંક ઑફ ઇન્ડિયા મોબાઇલ એપ્લિકેશન ઇન્સ્ટૉલ કરો અને લેટેસ્ટ ન્યૂઝનો ઝડપી ઍક્સેસ મેળવો!
અમારી એપ ઇન્સ્ટોલ કરવા માટે QR કોડ સ્કેન કરો


પેજની છેલ્લી અપડેટની તારીખ:


