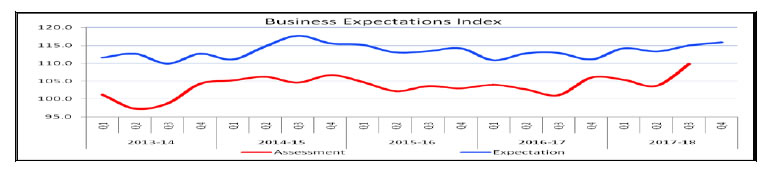
18 जनवरी 2018 वर्ष 2017-18 की तीसरी तिमाही के लिए विनिर्माण क्षेत्र का औद्योगिक संभावना सर्वेक्षण आज, रिज़र्व बैंक ने अक्टूबर-दिसंबर 2017 में आयोजित कराए गए औद्योगिक संभावना सर्वेक्षण (आईओएस) के 80वें दौर के परिणाम जारी किए। इस सर्वेक्षण में वर्ष 2017-18 की तीसरी तिमाही के लिए भारतीय विनिर्माण क्षेत्र की कंपनियों द्वारा कारोबार स्थिति के गुणवत्ता आकलन और वर्ष 2017-181 की चौथी तिमाही के लिए उनकी प्रत्याशाओं को शामिल किया गया है। सर्वेक्षण के इस दौर में 1299 कंपनियों से प्रतिक्रिया प्राप्त हुईं। मुख्य-मुख्य बातें: 1. वर्ष 2017-18 की तीसरी तिमाही का आकलन 1.1 प्रतिक्रियावादी वर्ष 2017-18 की तीसरी तिमाही की मांग स्थिति के बारे में आशावादी थे जैसाकि उत्पादन, आदेश बहियों, क्षमता उपयोग, आयात और रोजगार के उनके आकलन ने बताया। 1.2 इनपुट (कच्चे माल) मूल्य दबावों के बने रहने और सुस्त मांग स्थिति से मूल्यनिर्धारण क्षमता के अभी भी नियंत्रित रहते हुए, प्रतिक्रियावादियों ने वर्ष 2017-18 की तीसरी तिमाही में घटता लाभ मार्जिन देखा। 1.3 कुल मिलाकर, भारतीय विनिर्माण क्षेत्र में कारोबारी भावनाओं में सुधार हुआ है जैसाकि कारोबार प्रत्याशा सूचकांक (बीईआई)2 में प्रतिलक्षित हुआ जो वर्ष 2017-18 की दूसरी तिमाही के 103.7 से बढ़कर वर्ष 2017-18 की तीसरी तिमाही में 109.8 हो गया।
2. वर्ष 2017-18 की चौथी तिमाही के लिए प्रत्याशाएं 2.1 प्रतिक्रियावादियों ने वर्ष 2017-18 की चौथी तिमाही के लिए मांग स्थिति पर अपने आशावादी दृष्टिकोण को सर्वेक्षण के पिछले दौर के स्तर पर व्यापक रूप से बनाए रखा। 2.2 क्षमता उपयोग और निर्यात के संबंध में आशावाद में थोड़ी सी कमी आई। 2.3 विभिन्न स्रोतों से वित्त की उपलब्धता में वर्ष 2017-18 की चौथी तिमाही में सुधार होने की संभावना है। 2.4 जबकि कच्चे माल की कीमतों पर भावनाएं अधिक नकारात्मक हो गई, मूल्यनिर्धारण क्षमता में लाभ मार्जिन को नियंत्रित और सर्वेक्षण के पिछले दौर के स्तर पर व्यापक रखते हुए सुधार हो सकता है। 2.5 बीईआई वर्ष 2017-18 की तीसरी तिमाही के 115.0 से बढ़कर वर्ष 2017-18 की चौथी तिमाही में 115.8 हो गया।
| कुल प्रतिक्रिया3 पर सारांश सारणी (प्रतिशत में) |
| पैरामीटर |
आकलन अवधि |
प्रत्याशा अवधि |
| 2017-18 की दूसरी तिमाही |
2017-18 की तीसरी तिमाही |
2017-18 की तीसरी तिमाही |
2017-18 की चौथी तिमाही |
| उत्पादन |
16.4 |
22.1 |
34.3 |
34.1 |
| आदेश बही |
12.1 |
19.2 |
29.9 |
30.3 |
| लंबित आदेश |
13.7 |
9.5 |
6.7 |
5.7 |
| क्षमता उपयोगिता |
7.1 |
11.3 |
20.8 |
19.5 |
| निर्यात |
8.8 |
7.8 |
19.0 |
16.6 |
| आयात |
8.9 |
9.1 |
12.8 |
13.5 |
| रोजगार |
7.3 |
8.4 |
10.4 |
11.7 |
| वित्तीय स्थिति (समग्र) |
15.8 |
17.1 |
28.7 |
28.6 |
| वित्त की उपलब्धता (आंतरिक संचयों से) |
13.7 |
13.8 |
20.2 |
21.4 |
| वित्त की उपलब्धता (बैंकों और अन्य स्रोतों से) |
13.8 |
14.0 |
14.1 |
16.5 |
| वित्त की उपलब्धता (विदेशी से, यदि लागू हो) |
5.0 |
4.0 |
4.1 |
6.6 |
| वित्त की लागत |
-0.5 |
-3.1 |
-2.2 |
-4.1 |
| कच्चे सामान की लागत |
-41.8 |
-42.7 |
-31.9 |
-34.0 |
| बिक्री मूल्य |
-0.1 |
4.5 |
7.0 |
7.9 |
| लाभ मार्जिन |
-14.0 |
-10.0 |
1.8 |
0.1 |
| समग्र कारोबार स्थिति |
17.3 |
23.9 |
36.9 |
36.1 |
| वेतन |
34.5 |
27.2 |
23.9 |
22.9 |
| Table 1: Assessment & Expectation for Production |
| (Percentage responses)@ |
| Quarter |
Total response |
Assessment |
Expectation |
| Increase |
Decrease |
No change |
Net response# |
Increase |
Decrease |
No change |
Net response# |
| Q3:2016-17 |
1221 |
32.0 |
21.2 |
46.8 |
10.8 |
40.9 |
12.0 |
47.2 |
28.9 |
| Q4:2016-17 |
1244 |
35.8 |
17.8 |
46.4 |
18.0 |
41.1 |
13.3 |
45.6 |
27.8 |
| Q1:2017-18 |
1250 |
34.5 |
18.5 |
46.9 |
16.0 |
41.6 |
11.7 |
46.7 |
29.9 |
| Q2:2017-18 |
1141 |
34.9 |
18.5 |
46.6 |
16.4 |
42.2 |
12.0 |
45.8 |
30.2 |
| Q3:2017-18 |
1299 |
36.8 |
14.7 |
48.5 |
22.1 |
43.4 |
9.1 |
47.5 |
34.3 |
| Q4:2017-18 |
|
|
|
|
|
42.5 |
8.4 |
49.7 |
34.1 |
‘Increase’ in production is optimistic.
@: Due to rounding off percentage may not add up to 100.
#: Net Response (NR) is the difference of percentage of the respondents reporting optimism and that reporting pessimism. The range is -100 to 100. Any value greater than zero indicates expansion and any value less than zero indicates contraction. |
| Table 2: Assessment & Expectation for Order Books |
| (Percentage responses) |
| Quarter |
Total response |
Assessment |
Expectation |
| Increase |
Decrease |
No change |
Net response |
Increase |
Decrease |
No change |
Net response |
| Q3:2016-17 |
1221 |
29.1 |
22.0 |
48.9 |
7.1 |
36.4 |
11.7 |
51.9 |
24.7 |
| Q4:2016-17 |
1244 |
34.8 |
19.2 |
46.0 |
15.6 |
35.1 |
14.2 |
50.7 |
20.9 |
| Q1:2017-18 |
1250 |
32.7 |
19.0 |
48.3 |
13.7 |
39.5 |
11.5 |
49.0 |
28.0 |
| Q2:2017-18 |
1141 |
31.8 |
19.7 |
48.5 |
12.1 |
39.7 |
11.7 |
48.6 |
28.0 |
| Q3:2017-18 |
1299 |
35.4 |
16.2 |
48.4 |
19.2 |
39.6 |
9.6 |
50.8 |
29.9 |
| Q4:2017-18 |
|
|
|
|
|
40.5 |
10.2 |
49.3 |
30.3 |
| ‘Increase’ in order books is optimistic. Footnotes ‘@’ and ‘#’ given in Table 1 are applicable here. |
| Table 3: Assessment & Expectation for Pending Orders |
| (Percentage responses) |
| Quarter |
Total response |
Assessment |
Expectation |
| Below Normal |
Above Normal |
Normal |
Net response |
Below Normal |
Above Normal |
Normal |
Net response |
| Q3:2016-17 |
1222 |
19.0 |
5.3 |
75.7 |
13.7 |
12.9 |
6.7 |
80.4 |
6.2 |
| Q4:2016-17 |
1244 |
18.1 |
5.1 |
76.9 |
13.0 |
15.3 |
5.0 |
79.7 |
10.3 |
| Q1:2017-18 |
1250 |
17.0 |
5.7 |
77.3 |
11.3 |
13.4 |
4.9 |
81.8 |
8.5 |
| Q2:2017-18 |
1141 |
17.9 |
4.2 |
77.9 |
13.7 |
12.5 |
6.5 |
81.0 |
6.0 |
| Q3:2017-18 |
1299 |
16.2 |
6.7 |
77.1 |
9.5 |
11.4 |
4.7 |
83.9 |
6.7 |
| Q4:2017-18 |
|
|
|
|
|
12.5 |
6.8 |
80.7 |
5.7 |
| Pending orders ‘Below Normal’ is optimistic. Footnotes ‘@’ and ‘#’ given in Table 1 are applicable here. |
| Table 4: Assessment & Expectation for Capacity Utilisation (Main Product) |
| (Percentage responses) |
| Quarter |
Total response |
Assessment |
Expectation |
| Increase |
Decrease |
No change |
Net response |
Increase |
Decrease |
No change |
Net response |
| Q3:2016-17 |
1222 |
20.2 |
17.9 |
61.9 |
2.3 |
27.4 |
10.2 |
62.5 |
17.2 |
| Q4:2016-17 |
1244 |
25.9 |
15.7 |
58.4 |
10.2 |
27.6 |
11.2 |
61.2 |
16.4 |
| Q1:2017-18 |
1250 |
22.5 |
15.4 |
62.0 |
7.1 |
28.1 |
10.9 |
61.0 |
17.2 |
| Q2:2017-18 |
1141 |
22.9 |
15.8 |
61.3 |
7.1 |
27.6 |
11.3 |
61.1 |
16.3 |
| Q3:2017-18 |
1299 |
23.9 |
12.7 |
63.4 |
11.3 |
28.8 |
8.0 |
63.2 |
20.8 |
| Q4:2017-18 |
|
|
|
|
|
28.4 |
8.9 |
62.7 |
19.5 |
| ‘Increase’ in capacity utilisation is optimistic. Footnotes ‘@’ and ‘#’ given in Table 1 are applicable here. |
| Table 5: Assessment & Expectation for Level of CU (compared to the average in last 4 quarters) |
| (Percentage responses) |
| Quarter |
Total response |
Assessment |
Expectation |
| Above Normal |
Below Normal |
Normal |
Net response |
Above Normal |
Below Normal |
Normal |
Net response |
| Q3:2016-17 |
1222 |
8.7 |
16.4 |
74.9 |
-7.7 |
10.8 |
11.5 |
77.7 |
-0.7 |
| Q4:2016-17 |
1244 |
9.3 |
16.1 |
74.6 |
-6.8 |
10.6 |
12.9 |
76.5 |
-2.3 |
| Q1:2017-18 |
1250 |
8.4 |
15.1 |
76.5 |
-6.7 |
9.9 |
12.2 |
77.9 |
-2.3 |
| Q2:2017-18 |
1141 |
9.7 |
15.6 |
74.7 |
-6.0 |
9.7 |
10.8 |
79.5 |
-1.1 |
| Q3:2017-18 |
1299 |
10.3 |
14.1 |
75.6 |
-3.8 |
11.4 |
9.6 |
79.0 |
1.8 |
| Q4:2017-18 |
|
|
|
|
|
13.0 |
10.7 |
76.3 |
2.3 |
| ‘Above Normal’ in Level of capacity utilisation is optimistic. Footnotes ‘@’ and ‘#’ given in Table 1 are applicable here. |
| Table 6: Assessment & Expectation for Assessment of Production Capacity (with regard to expected demand in next 6 months) |
| (Percentage responses) |
| Quarter |
Total response |
Assessment |
Expectation |
| More than adequate |
Less than adequate |
Adequate |
Net response |
More than adequate |
Less than adequate |
Adequate |
Net response |
| Q3:2016-17 |
1222 |
12.3 |
9.1 |
78.6 |
3.2 |
14.2 |
7.4 |
78.4 |
6.8 |
| Q4:2016-17 |
1244 |
14.1 |
7.1 |
78.7 |
7.0 |
11.9 |
7.4 |
80.7 |
4.5 |
| Q1:2017-18 |
1250 |
12.3 |
7.4 |
80.3 |
4.9 |
13.3 |
6.7 |
79.9 |
6.6 |
| Q2:2017-18 |
1141 |
10.4 |
7.4 |
82.2 |
3.0 |
12.2 |
6.6 |
81.2 |
5.6 |
| Q3:2017-18 |
1299 |
11.8 |
7.1 |
81.1 |
4.7 |
11.1 |
6.5 |
82.4 |
4.6 |
| Q4:2017-18 |
|
|
|
|
|
12.9 |
6.9 |
80.2 |
6.0 |
| ‘More than adequate’ in Assessment of Production Capacity is optimistic. Footnotes ‘@’ and ‘#’ given in Table 1 are applicable here. |
| Table 7: Assessment & Expectation for Exports |
| (Percentage responses) |
| Quarter |
Total response |
Assessment |
Expectation |
| Increase |
Decrease |
No change |
Net response |
Increase |
Decrease |
No change |
Net response |
| Q3:2016-17 |
1221 |
22.9 |
18.5 |
58.6 |
4.4 |
24.3 |
13.2 |
62.5 |
11.2 |
| Q4:2016-17 |
1244 |
24.3 |
17.7 |
58.0 |
6.6 |
25.3 |
13.2 |
61.5 |
12.1 |
| Q1:2017-18 |
1250 |
22.2 |
18.8 |
59.0 |
3.4 |
26.5 |
11.3 |
62.2 |
15.2 |
| Q2:2017-18 |
1141 |
24.2 |
15.4 |
60.4 |
8.8 |
27.9 |
11.6 |
60.5 |
16.3 |
| Q3:2017-18 |
1299 |
22.5 |
14.7 |
62.8 |
7.8 |
27.6 |
8.6 |
63.8 |
19.0 |
| Q4:2017-18 |
|
|
|
|
|
25.4 |
8.8 |
65.8 |
16.6 |
| ‘Increase’ in exports is optimistic. Footnotes ‘@’ and ‘#’ given in Table 1 are applicable here. |
| Table 8: Assessment & Expectation for Imports |
| (Percentage responses) |
| Quarter |
Total response |
Assessment |
Expectation |
| Increase |
Decrease |
No change |
Net response |
Increase |
Decrease |
No change |
Net response |
| Q3:2016-17 |
1221 |
17.9 |
11.7 |
70.4 |
6.2 |
18.1 |
9.4 |
72.5 |
8.7 |
| Q4:2016-17 |
1244 |
17.5 |
10.7 |
71.8 |
6.8 |
17.7 |
9.3 |
73.1 |
8.4 |
| Q1:2017-18 |
1250 |
17.4 |
10.3 |
72.2 |
7.1 |
17.3 |
7.2 |
75.5 |
10.1 |
| Q2:2017-18 |
1141 |
17.1 |
8.2 |
74.7 |
8.9 |
18.6 |
7.9 |
73.5 |
10.7 |
| Q3:2017-18 |
1299 |
18.2 |
9.1 |
72.7 |
9.1 |
17.8 |
5.0 |
77.2 |
12.8 |
| Q4:2017-18 |
|
|
|
|
|
19.7 |
6.2 |
74.1 |
13.5 |
| ‘Increase’ in imports is optimistic. Footnotes ‘@’ and ‘#’ given in Table 1 are applicable here. |
| Table 9: Assessment & Expectation for level of Raw Materials Inventory |
| (Percentage responses) |
| Quarter |
Total response |
Assessment |
Expectation |
| Below average |
Above average |
Average |
Net response |
Below average |
Above average |
Average |
Net response |
| Q3:2016-17 |
1221 |
7.3 |
11.7 |
81.2 |
-4.4 |
5.2 |
10.3 |
84.5 |
-5.2 |
| Q4:2016-17 |
1244 |
6.9 |
12.4 |
81.1 |
-5.5 |
6.8 |
9.0 |
84.2 |
-2.2 |
| Q1:2017-18 |
1250 |
6.7 |
12.2 |
81.2 |
-5.5 |
6.1 |
8.7 |
85.2 |
-2.6 |
| Q2:2017-18 |
1141 |
6.2 |
13.1 |
80.8 |
-6.9 |
6.1 |
10.7 |
83.2 |
-4.6 |
| Q3:2017-18 |
1299 |
6.0 |
14.6 |
79.4 |
-8.6 |
4.3 |
10.4 |
85.4 |
-6.1 |
| Q4:2017-18 |
|
|
|
|
|
6.0 |
11.5 |
82.5 |
-5.5 |
| ‘Below average’ Inventory of raw materials is optimistic. Footnotes ‘@’ and ‘#’ given in Table 1 are applicable here. |
| Table 10: Assessment & Expectation for level of Finished Goods Inventory |
| (Percentage responses) |
| Quarter |
Total response |
Assessment |
Expectation |
| Below average |
Above average |
Average |
Net response |
Below average |
Above average |
Average |
Net response |
| Q3:2016-17 |
1221 |
6.4 |
15.3 |
78.3 |
-8.9 |
4.5 |
12.5 |
83.0 |
-7.9 |
| Q4:2016-17 |
1244 |
7.3 |
16.6 |
76.1 |
-9.3 |
6.5 |
11.6 |
81.9 |
-5.1 |
| Q1:2017-18 |
1250 |
6.8 |
14.2 |
79.0 |
-7.5 |
6.4 |
10.7 |
82.8 |
-4.3 |
| Q2:2017-18 |
1141 |
7.1 |
15.9 |
77.0 |
-8.8 |
6.0 |
11.6 |
82.4 |
-5.6 |
| Q3:2017-18 |
1299 |
6.9 |
14.5 |
78.6 |
-7.6 |
6.2 |
10.0 |
83.8 |
-3.8 |
| Q4:2017-18 |
|
|
|
|
|
6.5 |
10.9 |
82.6 |
-4.4 |
| ‘Below average’ Inventory of finished goods is optimistic. Footnotes ‘@’ and ‘#’ given in Table 1 are applicable here. |
| Table 11: Assessment & Expectations for Employment Outlook |
| (Percentage responses) |
| Quarter |
Total response |
Assessment |
Expectation |
| Increase |
Decrease |
No change |
Net response |
Increase |
Decrease |
No change |
Net response |
| Q3:2016-17 |
1221 |
13.5 |
9.7 |
76.8 |
3.8 |
14.7 |
5.6 |
79.7 |
9.1 |
| Q4:2016-17 |
1244 |
15.9 |
9.3 |
74.9 |
6.6 |
12.1 |
6.9 |
81.0 |
5.2 |
| Q1:2017-18 |
1250 |
14.6 |
9.2 |
76.2 |
5.4 |
15.9 |
6.6 |
77.5 |
9.3 |
| Q2:2017-18 |
1141 |
15.5 |
8.2 |
76.3 |
7.3 |
15.2 |
6.5 |
78.3 |
8.7 |
| Q3:2017-18 |
1299 |
15.8 |
7.4 |
76.8 |
8.4 |
15.8 |
5.3 |
78.9 |
10.4 |
| Q4:2017-18 |
|
|
|
|
|
17.0 |
5.3 |
77.7 |
11.7 |
| ‘Increase’ in employment is optimistic. Footnotes ‘@’ and ‘#’ given in Table 1 are applicable here. |
| Table 12: Assessment & Expectation for Overall Financial Situation |
| (Percentage responses) |
| Quarter |
Total response |
Assessment |
Expectation |
| Better |
Worsen |
No change |
Net response |
Better |
Worsen |
No change |
Net response |
| Q3:2016-17 |
1221 |
26.0 |
14.1 |
59.9 |
11.9 |
33.9 |
6.8 |
59.3 |
27.1 |
| Q4:2016-17 |
1244 |
30.6 |
13.6 |
55.9 |
17.0 |
34.1 |
9.5 |
56.4 |
24.6 |
| Q1:2017-18 |
1250 |
30.9 |
11.8 |
57.2 |
19.1 |
37.9 |
7.0 |
55.1 |
30.9 |
| Q2:2017-18 |
1141 |
29.0 |
13.2 |
57.7 |
15.8 |
35.6 |
7.7 |
56.6 |
27.9 |
| Q3:2017-18 |
1299 |
28.6 |
11.4 |
60.0 |
17.2 |
35.3 |
6.6 |
58.1 |
28.7 |
| Q4:2017-18 |
|
|
|
|
|
35.2 |
6.6 |
58.2 |
28.6 |
| ‘Better’ overall financial situation is optimistic. Footnotes ‘@’ and ‘#’ given in Table 1 are applicable here. |
| Table 13: Assessment & Expectation for Working Capital Finance Requirement |
| (Percentage responses) |
| Quarter |
Total response |
Assessment |
Expectation |
| Increase |
Decrease |
No change |
Net response |
Increase |
Decrease |
No change |
Net response |
| Q3:2016-17 |
1221 |
28.9 |
6.9 |
64.3 |
22.0 |
28.1 |
4.1 |
67.8 |
24.1 |
| Q4:2016-17 |
1244 |
30.2 |
5.6 |
64.2 |
24.6 |
29.2 |
5.3 |
65.5 |
23.9 |
| Q1:2017-18 |
1250 |
29.3 |
5.7 |
65.0 |
23.6 |
29.4 |
5.1 |
65.5 |
24.3 |
| Q2:2017-18 |
1141 |
29.7 |
6.3 |
64.1 |
23.4 |
29.4 |
5.7 |
65.0 |
23.7 |
| Q3:2017-18 |
1299 |
34.4 |
5.0 |
60.6 |
29.4 |
30.5 |
4.1 |
65.4 |
26.4 |
| Q4:2017-18 |
|
|
|
|
|
32.4 |
3.6 |
64.0 |
28.8 |
| ‘Increase’ in working capital finance is optimistic. Footnotes ‘@’ and ‘#’ given in Table 1 are applicable here. |
| Table 14: Assessment & Expectation for Availability of Finance (from Internal Accruals) |
| (Percentage responses) |
| Quarter |
Total response |
Assessment |
Expectation |
| Improve |
Worsen |
No change |
Net response |
Improve |
Worsen |
No change |
Net response |
| Q3:2016-17 |
1221 |
21.6 |
11.7 |
66.7 |
9.9 |
25.2 |
5.0 |
69.8 |
20.2 |
| Q4:2016-17 |
1244 |
25.6 |
10.3 |
64.1 |
15.3 |
25.4 |
8.0 |
66.6 |
17.4 |
| Q1:2017-18 |
1250 |
23.5 |
9.5 |
67.0 |
14.1 |
27.5 |
6.2 |
66.3 |
21.3 |
| Q2:2017-18 |
1141 |
23.2 |
9.5 |
67.3 |
13.7 |
26.8 |
6.4 |
66.9 |
20.4 |
| Q3:2017-18 |
1299 |
22.2 |
8.4 |
69.4 |
13.8 |
25.8 |
5.6 |
68.6 |
20.2 |
| Q4:2017-18 |
|
|
|
|
|
26.6 |
5.2 |
68.2 |
21.4 |
| ‘Improvement’ in availability of finance is optimistic. Footnotes ‘@’ and ‘#’ given in Table 1 are applicable here. |
| Table 15: Assessment & Expectation for Availability of Finance (from banks & other sources) |
| (Percentage responses) |
| Quarter |
Total response |
Assessment |
Expectation |
| Improve |
Worsen |
No change |
Net response |
Improve |
Worsen |
No change |
Net response |
| Q3:2016-17 |
1221 |
19.6 |
7.9 |
72.5 |
11.7 |
21.8 |
3.3 |
74.9 |
18.5 |
| Q4:2016-17 |
1244 |
21.3 |
7.6 |
71.1 |
13.7 |
22.5 |
5.6 |
71.9 |
16.9 |
| Q1:2017-18 |
1250 |
21.0 |
6.1 |
72.9 |
14.9 |
24.8 |
4.9 |
70.3 |
19.9 |
| Q2:2017-18 |
1141 |
19.8 |
6.1 |
74.1 |
13.8 |
21.5 |
4.6 |
73.9 |
17.0 |
| Q3:2017-18 |
1299 |
19.8 |
5.8 |
74.4 |
14.0 |
18.6 |
4.5 |
77.0 |
14.1 |
| Q4:2017-18 |
|
|
|
|
|
20.9 |
4.4 |
74.7 |
16.5 |
| ‘Improvement’ in availability of finance is optimistic. Footnotes ‘@’ and ‘#’ given in Table 1 are applicable here. |
| Table 16: Assessment & Expectation for Availability of Finance (from overseas, if applicable) |
| (Percentage responses) |
| Quarter |
Total response |
Assessment |
Expectation |
| Improve |
Worsen |
No change |
Net response |
Improve |
Worsen |
No change |
Net response |
| Q3:2016-17 |
1221 |
9.1 |
4.8 |
86.1 |
4.3 |
10.3 |
2.0 |
87.7 |
8.3 |
| Q4:2016-17 |
1244 |
8.1 |
3.3 |
88.6 |
4.8 |
10.0 |
3.5 |
86.5 |
6.5 |
| Q1:2017-18 |
1250 |
9.5 |
3.7 |
86.8 |
5.8 |
9.8 |
2.8 |
87.4 |
7.0 |
| Q2:2017-18 |
1141 |
8.0 |
3.0 |
89.0 |
5.0 |
10.9 |
3.9 |
85.2 |
7.0 |
| Q3:2017-18 |
1299 |
7.9 |
3.9 |
88.2 |
4.0 |
7.2 |
3.0 |
89.8 |
4.1 |
| Q4:2017-18 |
|
|
|
|
|
9.2 |
2.6 |
88.2 |
6.6 |
| ‘Improvement’ in availability of finance is optimistic. Footnotes ‘@’ and ‘#’ given in Table 1 are applicable here. |
| Table 17: Assessment & Expectation for Cost of Finance |
| (Percentage responses) |
| Quarter |
Total response |
Assessment |
Expectation |
| Decrease |
Increase |
No change |
Net response |
Decrease |
Increase |
No change |
Net response |
| Q3:2016-17 |
1221 |
12.9 |
16.1 |
71.1 |
-3.2 |
9.4 |
16.9 |
73.8 |
-7.5 |
| Q4:2016-17 |
1244 |
15.8 |
16.7 |
67.6 |
-0.9 |
14.5 |
14.8 |
70.8 |
-0.3 |
| Q1:2017-18 |
1250 |
13.6 |
14.8 |
71.6 |
-1.2 |
12.9 |
15.4 |
71.7 |
-2.5 |
| Q2:2017-18 |
1141 |
14.0 |
14.5 |
71.6 |
-0.5 |
10.9 |
14.7 |
74.5 |
-3.8 |
| Q3:2017-18 |
1299 |
11.6 |
14.5 |
73.9 |
-3.1 |
11.9 |
14.1 |
74.0 |
-2.2 |
| Q4:2017-18 |
|
|
|
|
|
9.8 |
13.9 |
76.3 |
-4.1 |
| ‘Decrease’ in cost of finance is optimistic. Footnotes ‘@’ and ‘#’ given in Table 1 are applicable here. |
| Table 18: Assessment & Expectation for Cost of Raw Materials |
| (Percentage responses) |
| Quarter |
Total response |
Assessment |
Expectation |
| Decrease |
Increase |
No change |
Net response |
Decrease |
Increase |
No change |
Net response |
| Q3:2016-17 |
1221 |
6.4 |
44.6 |
48.9 |
-38.2 |
5.5 |
37.4 |
57.1 |
-32.0 |
| Q4:2016-17 |
1244 |
3.5 |
51.4 |
45.0 |
-47.9 |
5.1 |
39.4 |
55.6 |
-34.3 |
| Q1:2017-18 |
1250 |
5.1 |
47.2 |
47.8 |
-42.1 |
4.1 |
42.0 |
54.0 |
-37.9 |
| Q2:2017-18 |
1141 |
5.0 |
46.8 |
48.2 |
-41.8 |
4.0 |
40.4 |
55.6 |
-36.5 |
| Q3:2017-18 |
1299 |
5.2 |
47.9 |
46.9 |
-42.7 |
5.7 |
37.6 |
56.7 |
-31.9 |
| Q4:2017-18 |
|
|
|
|
|
4.3 |
38.3 |
57.4 |
-34.0 |
| ‘Decrease’ in cost of raw materials is optimistic. Footnotes ‘@’ and ‘#’ given in Table 1 are applicable here. |
| Table 19: Assessment & Expectation for Selling Price |
| (Percentage responses) |
| Quarter |
Total response |
Assessment |
Expectation |
| Increase |
Decrease |
No change |
Net response |
Increase |
Decrease |
No change |
Net response |
| Q3:2016-17 |
1221 |
16.9 |
16.2 |
66.9 |
0.7 |
17.2 |
10.4 |
72.4 |
6.8 |
| Q4:2016-17 |
1244 |
21.4 |
13.0 |
65.6 |
8.4 |
16.8 |
10.9 |
72.3 |
5.9 |
| Q1:2017-18 |
1250 |
20.1 |
15.1 |
64.8 |
5.0 |
21.6 |
9.1 |
69.3 |
12.5 |
| Q2:2017-18 |
1141 |
16.1 |
16.2 |
67.6 |
-0.1 |
18.9 |
11.0 |
70.2 |
7.9 |
| Q3:2017-18 |
1299 |
17.7 |
13.2 |
69.1 |
4.5 |
17.5 |
10.6 |
71.9 |
7.0 |
| Q4:2017-18 |
|
|
|
|
|
17.4 |
9.5 |
73.1 |
7.9 |
| ‘Increase’ in selling price is optimistic. Footnotes ‘@’ and ‘#’ given in Table 1 are applicable here. |
| Table 20: Assessment & Expectation for Profit Margin |
| (Percentage responses) |
| Quarter |
Total response |
Assessment |
Expectation |
| Increase |
Decrease |
No change |
Net response |
Increase |
Decrease |
No change |
Net response |
| Q3:2016-17 |
1221 |
15.3 |
28.3 |
56.4 |
-13.0 |
19.5 |
19.4 |
61.2 |
0.1 |
| Q4:2016-17 |
1244 |
16.7 |
27.8 |
55.5 |
-11.1 |
18.5 |
21.3 |
60.2 |
-2.8 |
| Q1:2017-18 |
1250 |
15.7 |
28.2 |
56.0 |
-12.5 |
20.3 |
19.2 |
60.4 |
1.1 |
| Q2:2017-18 |
1141 |
14.5 |
28.5 |
57.1 |
-14.0 |
20.3 |
20.0 |
59.7 |
0.3 |
| Q3:2017-18 |
1299 |
15.4 |
25.4 |
59.2 |
-10.0 |
19.6 |
17.8 |
62.5 |
1.8 |
| Q4:2017-18 |
|
|
|
|
|
18.8 |
18.7 |
62.5 |
0.1 |
| ‘Increase’ in profit margin is optimistic. Footnotes ‘@’ and ‘#’ given in Table 1 are applicable here. |
| Table 21: Assessment & Expectation for Overall Business Situation |
| (Percentage responses) |
| Quarter |
Total response |
Assessment |
Expectation |
| Better |
Worsen |
No change |
Net response |
Better |
Worsen |
No change |
Net response |
| Q3:2016-17 |
1221 |
29.4 |
16.4 |
54.2 |
13.0 |
40.1 |
8.7 |
51.2 |
31.3 |
| Q4:2016-17 |
1244 |
36.3 |
14.3 |
49.5 |
22.0 |
39.4 |
11.5 |
49.1 |
27.9 |
| Q1:2017-18 |
1250 |
34.4 |
13.0 |
52.6 |
21.4 |
43.6 |
7.6 |
48.8 |
36.0 |
| Q2:2017-18 |
1141 |
31.7 |
14.4 |
53.9 |
17.3 |
42.7 |
9.0 |
48.4 |
33.7 |
| Q3:2017-18 |
1299 |
35.1 |
11.2 |
53.7 |
23.9 |
42.9 |
6.0 |
51.1 |
36.9 |
| Q4:2017-18 |
|
|
|
|
|
42.5 |
6.4 |
51.2 |
36.1 |
| ‘Better’ Overall Business Situation is optimistic. Footnotes ‘@’ and ‘#’ given in Table 1 are applicable here. |
| Table 22: Assessment & Expectation for Salary/Other Remuneration |
| (Percentage responses) |
| Quarter |
Total response |
Assessment |
Expectation |
| Increase |
Decrease |
No change |
Net response |
Increase |
Decrease |
No change |
Net response |
| Q3:2016-17 |
1222 |
28.9 |
2.8 |
68.3 |
26.1 |
26.6 |
2.0 |
71.4 |
24.7 |
| Q4:2016-17 |
1244 |
30.0 |
2.7 |
67.3 |
27.3 |
25.0 |
3.3 |
71.8 |
21.7 |
| Q1:2017-18 |
1250 |
42.1 |
2.7 |
55.2 |
39.4 |
38.8 |
2.2 |
59.0 |
36.6 |
| Q2:2017-18 |
1141 |
36.7 |
2.2 |
61.2 |
34.5 |
34.5 |
2.5 |
63.0 |
32.0 |
| Q3:2017-18 |
1299 |
29.4 |
2.2 |
68.4 |
27.2 |
25.9 |
2.0 |
72.1 |
23.9 |
| Q4:2017-18 |
|
|
|
|
|
25.2 |
2.3 |
72.5 |
22.9 |
| ‘Increase in Salary / other remuneration’ is optimistic. Footnotes ‘@’ and ‘#’ given in Table 1 are applicable here. |
| Table 23: Business Expectations Index (BEI) |
| Quarter |
BEI-Assessment Quarter |
BEI-Expectation Quarter |
| Q3:2016-17 |
101.1 |
112.9 |
| Q4:2016-17 |
106.0 |
111.1 |
| Q1:2017-18 |
105.4 |
114.2 |
| Q2:2017-18 |
103.7 |
113.3 |
| Q3:2017-18 |
109.8 |
115.0 |
| Q4:2017-18 |
|
115.8 |
अजीत प्रसाद
सहायक परामर्शदाता प्रेस प्रकाशनी : 2017-2018/1973
|