RbiSearchHeader

Press escape key to go back

पिछली खोज

थीम
थीम
टेक्स्ट का साइज़
टेक्स्ट का साइज़
S1

RbiAnnouncementWeb

RBI Announcements
RBI Announcements

असेट प्रकाशक

109262000

उपभोक्ता विश्वास सर्वेक्षण

आज, रिज़र्व बैंक ने अपने द्विमासिक उपभोक्ता विश्वास सर्वेक्षण (सीसीएस)1 के मार्च 2024 दौर के परिणाम जारी किए। यह सर्वेक्षण 19 प्रमुख शहरों में सामान्य आर्थिक स्थिति, रोजगार परिदृश्य, समग्र मूल्य स्थिति और स्वयं की आय एवं व्यय पर वर्तमान धारणाएं (एक साल पहले की तुलना में) और एक वर्ष आगे की अपेक्षाएं प्राप्त करता है। सर्वेक्षण का नवीनतम दौर 2-11 मार्च, 2024 के दौरान आयोजित किया गया था, जिसमें 6,083 उत्तरदाताओं को शामिल किया गया था। इस सैंपल में महिला उत्तरदाताओं का हिस्सा 50.8 प्रतिशत रहा है।

मुख्य विशेषताएँ:

  1. वर्तमान अवधि में उपभोक्ता विश्वास निरंतर सुधार की राह पर है; उत्तरदाताओं ने सभी सर्वेक्षण मापदंडों में सुधार का आकलन किया; वर्तमान स्थिति सूचकांक (सीएसआई)2 3.4 अंक बढ़कर 98.5 हो गया जो की 2019 के मध्य के बाद से इसका उच्चतम स्तर रहा है (चार्ट 1; टेबल 1, 2, 3, 5 और 6)।

  2. सीसीएस के सभी मापदंडों में उच्च आशावाद के कारण आगामी वर्ष के लिए उपभोक्ता विश्वास में और सुधार हुआ; उच्च आशावाद के परिणामस्वरूप भविष्य की अपेक्षा सूचकांक (एफईआई) 2.1 अंक बढ़कर 125.2 हो गया - यह 2019 के मध्य के बाद से इसका भी उच्चतम स्तर है (चार्ट 1; टेबल 1, 2, 3, 5 और 6)।

  3. सामान्य आर्थिक स्थिति और रोजगार की संभावनाओं पर घरेलू अपेक्षाएं में वर्तमान अवधि के साथ-साथ आगामी वर्ष दोनों के लिए उल्लेखनीय सुधार दर्ज किए गए; समकालिक रूप से, गैर-आवश्यक खर्च पर उनके दृष्टिकोण में सुधार हुआ है (टेबल 1, 2 और 8)।

  4. उत्तरदाताओं ने एक वर्ष पहले की तुलना में बेहतर आय स्थिति का आकलन किया और आने वाले वर्ष में आय में और वृद्धि की अपेक्षाएं की है (टेबल 5)।

Chart 1: Consumer Confidence Indices

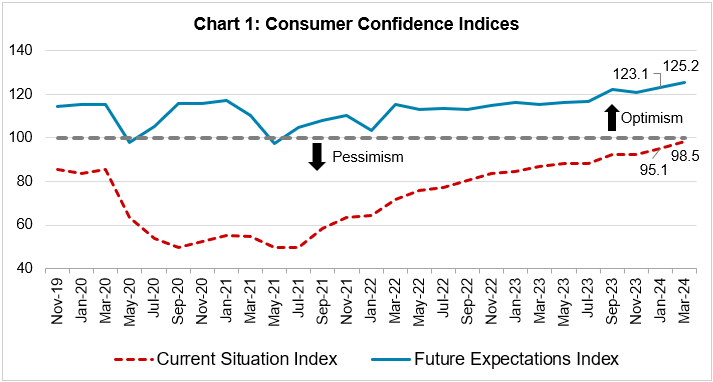
नोट: कृपया समय श्रृंखला डेटा के लिए एक्सेल फ़ाइल देखें3

Summary
 
Table 1: Perceptions and Expectations on the General Economic Situation
(Percentage responses)
Survey Round Current Perception One year ahead Expectation
Increased Remained Same Decreased Net Response Will Increase Will Remain Same Will Decrease Net Response
Mar-23 31.4 16.9 51.7 -20.4 49.9 15.1 35.0 15.0
May-23 32.1 19.0 48.9 -16.8 51.0 15.8 33.2 17.8
Jul-23 30.4 18.5 51.1 -20.7 51.1 15.1 33.8 17.2
Sep-23 36.1 19.9 44.0 -7.9 56.8 15.1 28.1 28.6
Nov-23 33.1 22.5 44.4 -11.3 54.3 17.2 28.5 25.7
Jan-24 37.5 22.3 40.2 -2.7 59.2 15.3 25.5 33.7
Mar-24 41.2 23.1 35.8 5.4 60.7 15.8 23.4 37.3
 
Table 2: Perceptions and Expectations on Employment
(Percentage responses)
Survey Round Current Perception One year ahead Expectation
Increased Remained Same Decreased Net Response Will Increase Will Remain Same Will Decrease Net Response
Mar-23 32.2 19.9 47.9 -15.7 52.9 17.1 30.1 22.8
May-23 32.1 20.2 47.7 -15.6 52.1 18.7 29.2 22.9
Jul-23 30.8 21.0 48.2 -17.5 51.4 18.3 30.3 21.1
Sep-23 34.0 21.8 44.2 -10.2 55.8 18.1 26.2 29.6
Nov-23 32.3 23.0 44.7 -12.4 53.6 19.7 26.8 26.9
Jan-24 35.3 23.4 41.3 -6.0 58.7 17.4 24.0 34.7
Mar-24 38.1 23.8 38.1 0.0 60.0 17.4 22.6 37.4
 
Table 3: Perceptions and Expectations on Price Level
(Percentage responses)
Survey Round Current Perception One year ahead Expectation
Increased Remained Same Decreased Net Response Will Increase Will Remain Same Will Decrease Net Response
Mar-23 93.8 5.2 1.0 -92.9 84.3 9.0 6.7 -77.5
May-23 92.2 6.4 1.4 -90.8 82.7 10.0 7.3 -75.4
Jul-23 92.7 6.0 1.3 -91.4 80.9 10.2 8.9 -72.0
Sep-23 91.8 6.4 1.8 -90.0 78.4 9.9 11.7 -66.8
Nov-23 91.3 7.3 1.4 -89.9 81.0 10.2 8.8 -72.3
Jan-24 90.8 7.2 2.0 -88.9 80.5 10.4 9.1 -71.4
Mar-24 89.2 9.3 1.4 -87.8 78.2 12.5 9.4 -68.8
 
Table 4: Perceptions and Expectations on Rate of Change in Price Level (Inflation)*
(Percentage responses)
Survey Round Current Perception One year ahead Expectation
Increased Remained Same Decreased Net Response Will Increase Will Remain Same Will Decrease Net Response
Mar-23 86.5 10.0 3.5 -82.9 81.4 14.0 4.6 -76.8
May-23 84.0 12.5 3.4 -80.6 81.8 14.1 4.1 -77.8
Jul-23 84.5 11.8 3.7 -80.8 80.8 14.8 4.4 -76.4
Sep-23 82.5 13.4 4.2 -78.3 79.4 15.8 4.8 -74.6
Nov-23 81.8 13.6 4.6 -77.2 80.1 14.7 5.2 -75.0
Jan-24 79.5 15.7 4.8 -74.7 77.2 17.8 5.0 -72.2
Mar-24 77.0 17.6 5.4 -71.6 76.7 18.3 5.0 -71.7
*Applicable only for those respondents who felt price has increased/price will increase.
 
Table 5: Perceptions and Expectations on Income
(Percentage responses)
Survey Round Current Perception One year ahead Expectation
Increased Remained Same Decreased Net Response Will Increase Will Remain Same Will Decrease Net Response
Mar-23 22.2 49.7 28.1 -5.9 54.1 38.4 7.5 46.7
May-23 23.9 49.7 26.3 -2.4 53.8 39.4 6.9 46.9
Jul-23 25.4 49.9 24.8 0.6 54.7 38.6 6.7 48.0
Sep-23 25.0 49.8 25.2 -0.3 55.7 37.8 6.5 49.2
Nov-23 27.2 50.1 22.7 4.5 57.9 36.0 6.1 51.8
Jan-24 26.4 51.5 22.1 4.2 56.3 36.9 6.8 49.4
Mar-24 27.7 50.6 21.7 6.0 56.7 37.2 6.1 50.5
 
Table 6: Perceptions and Expectations on Spending
(Percentage responses)
Survey Round Current Perception One year ahead Expectation
Increased Remained Same Decreased Net Response Will Increase Will Remain Same Will Decrease Net Response
Mar-23 75.0 19.6 5.4 69.6 75.4 19.9 4.6 70.8
May-23 73.4 21.3 5.3 68.1 73.8 21.7 4.6 69.2
Jul-23 74.5 20.5 5.0 69.6 73.8 21.3 4.8 69.0
Sep-23 74.6 20.2 5.2 69.4 75.2 20.3 4.6 70.6
Nov-23 74.8 20.6 4.6 70.1 75.0 21.0 4.1 70.9
Jan-24 73.2 22.3 4.5 68.6 74.2 20.9 5.0 69.2
Mar-24 73.1 23.1 3.8 69.2 73.9 21.7 4.3 69.6
 
Table 7: Perceptions and Expectations on Spending- Essential Items
(Percentage responses)
Survey Round Current Perception One year ahead Expectation
Increased Remained Same Decreased Net Response Will Increase Will Remain Same Will Decrease Net Response
Mar-23 85.3 11.5 3.2 82.1 81.7 14.8 3.5 78.2
May-23 84.0 12.8 3.2 80.8 81.3 15.2 3.5 77.8
Jul-23 85.3 11.8 3.0 82.3 81.0 15.5 3.5 77.5
Sep-23 84.9 11.9 3.2 81.7 82.0 14.4 3.6 78.4
Nov-23 85.7 11.4 2.9 82.7 82.3 14.4 3.4 78.9
Jan-24 84.1 12.9 3.0 81.1 81.8 14.6 3.6 78.2
Mar-24 84.5 13.0 2.5 82.0 82.5 14.5 3.0 79.5
 
Table 8: Perceptions and Expectations on Spending- Non-Essential Items
(Percentage responses)
Survey Round Current Perception One year ahead Expectation
Increased Remained Same Decreased Net Response Will Increase Will Remain Same Will Decrease Net Response
Mar-23 25.2 34.8 40.0 -14.8 34.5 36.8 28.8 5.7
May-23 25.8 38.2 36.1 -10.3 35.3 37.5 27.2 8.2
Jul-23 26.6 36.9 36.5 -10.0 34.8 37.6 27.6 7.3
Sep-23 23.4 38.5 38.2 -14.8 33.0 38.2 28.8 4.2
Nov-23 25.2 36.6 38.2 -13.0 34.1 36.8 29.0 5.1
Jan-24 27.2 36.2 36.6 -9.4 34.6 36.4 29.0 5.5
Mar-24 29.2 37.6 33.2 -4.1 35.7 37.6 26.7 9.0

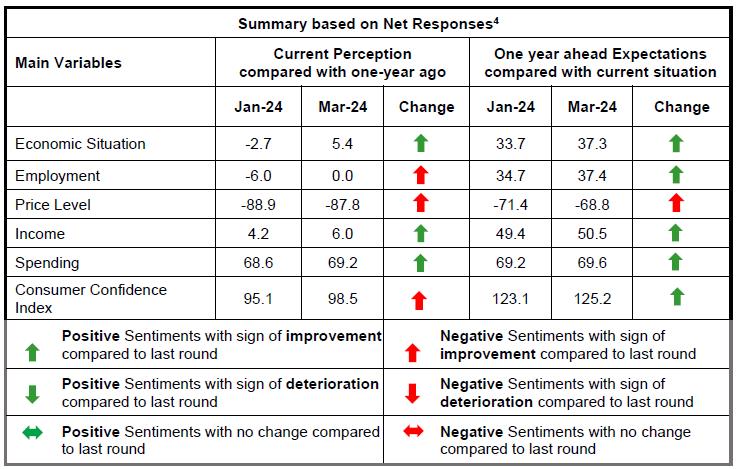
1 सर्वेक्षण के परिणाम उत्तरदाताओं के विचारों को दर्शाते हैं, जो जरूरी नहीं कि रिज़र्व बैंक द्वारा साझा किए गए हों। पिछले सर्वेक्षण चक्र के परिणाम बैंक की वेबसाइट पर फ़रवरी 08, 2024 को जारी किए गए थे।

2 सीएसआई और एफईआई को क्रमशः आर्थिक स्थिति, आय, खर्च, रोजगार और वर्तमान अवधि (एक साल पहले की तुलना में) और एक साल आगे के लिए मूल्य स्तर पर शुद्ध प्रतिक्रियाओं के आधार पर संकलित किया जाता है। सीएसआई और एफईआई = 100 + उपरोक्त मापदंडों की शुद्ध प्रतिक्रियाओं का औसत।

3 सर्वेक्षण के पिछले चक्रों के लिए यूनिट-स्तर के डेटा, बैंक के भारतीय अर्थव्यवस्था पर डेटाबेस (DBIE) पोर्टल (वेबलिंक: https://dbie.rbi.org.in/#/dbie/home) पर 'यूनिट-स्तर डेटा' शीर्षक के अंतर्गत उपलब्ध हैं)|

4 ‘शुद्ध प्रतिक्रिया' आशावाद की रिपोर्ट करने वाले उत्तरदाताओं के प्रतिशत और निराशावाद की रिपोर्ट करने वालों के बीच का अंतर है। यह -100 और 100 के बीच होता है। शून्य से अधिक कोई भी मान विस्तार/आशावाद को दर्शाता है और शून्य से कम मान संकुचन/निराशावाद को दर्शाता है।

RbiTtsCommonUtility

प्ले हो रहा है
सुनें

संबंधित एसेट

आरबीआई-इंस्टॉल-आरबीआई-सामग्री-वैश्विक

RbiSocialMediaUtility

आरबीआई मोबाइल एप्लीकेशन इंस्टॉल करें और लेटेस्ट न्यूज़ का तुरंत एक्सेस पाएं!

Scan Your QR code to Install our app

RbiWasItHelpfulUtility

क्या यह पेज उपयोगी था?