शहरी उपभोक्ता विश्वास सर्वेक्षण
|
आज, रिज़र्व बैंक ने अपने द्विमासिक शहरी उपभोक्ता विश्वास सर्वेक्षण (यूसीसीएस)1 के मई 2025 दौर के परिणाम जारी किए। यह सर्वेक्षण 19 प्रमुख शहरों में सामान्य आर्थिक स्थिति, रोजगार परिदृश्य, समग्र मूल्य स्थिति और स्वयं की आय एवं व्यय पर वर्तमान धारणाएं (एक साल पहले की तुलना में) और एक वर्ष आगे की अपेक्षाएं एकत्रित करता है। सर्वेक्षण का नवीनतम दौर 2-11 मई, 2025 के दौरान आयोजित किया गया था, जिसमें 6,090 उत्तरदाताओं को शामिल किया गया था।
मुख्य विशेषताएँ:
-
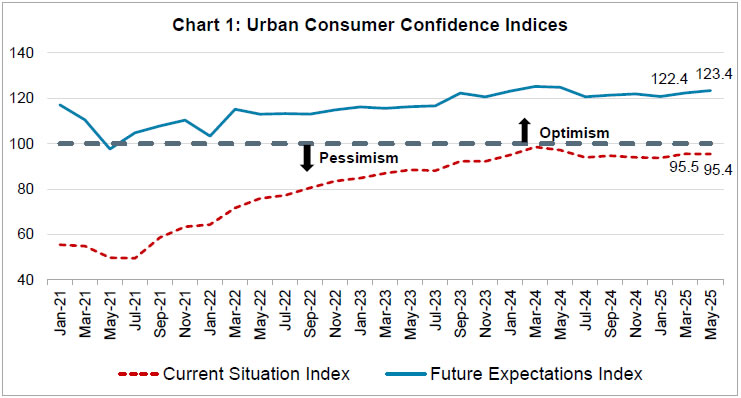
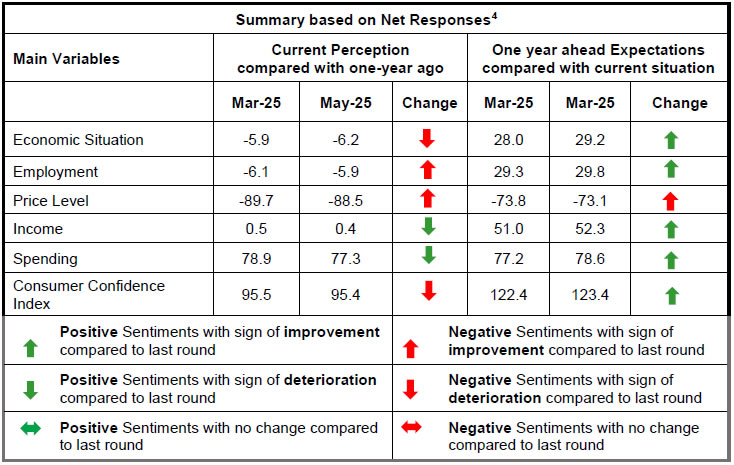
रोजगार और मूल्य स्थितियों में सुधार के बावजूद, अन्य सर्वेक्षण मापदंडों पर भावनाओं में मामूली गिरावट के कारण वर्तमान अवधि के लिए उपभोक्ता विश्वास स्थिर रहा। वर्तमान स्थिति सूचकांक (सीएसआई)2 मई 2025 में 0.1 अंक से घटकर 95.4 हो गया (चार्ट 1; टेबल 1, 2, 3, 5 और 6)।
-
सभी सर्वेक्षण मापदंडों में आशावाद बढ़ने के कारण आगामी वर्ष के लिए उपभोक्ता विश्वास में और सुधार हुआ। नवीनतम सर्वेक्षण दौर में भविष्य की अपेक्षा सूचकांक (एफईआई) 1 अंक से बढ़कर 123.4 हो गया (चार्ट 1; टेबल 1, 2, 3, 5 और 6)।
-
वर्तमान मूल्य स्तर और मुद्रास्फीति के बारे में निराशावाद लगातार दूसरे दौर में कम हुआ है। परिवारों को आगामी वर्ष में मूल्य और मुद्रास्फीति दोनों में दबाव के कमी आने की भी अपेक्षा है (टेबल 3 और 4)।
-
परिवार भविष्य की आय के प्रति दृढ़ता से आशावादी बने हुए हैं, जबकी वर्तमान आय पर उनकी भावना मार्च 2025 के स्तर के आसपास बनी हुई है (टेबल 5)।
नोट: कृपया समय श्रृंखला डेटा के लिए एक्सेल फ़ाइल देखें।3
| Table 1: Perceptions and Expectations on the General Economic Situation |
| (Percentage responses) |
| Survey Round |
Current Perception |
One year ahead Expectation |
| Increased |
Remained Same |
Decreased |
Net Response |
Will Increase |
Will Remain Same |
Will Decrease |
Net Response |
| May-24 |
40.0 |
22.6 |
37.4 |
2.6 |
59.0 |
15.6 |
25.4 |
33.5 |
| Jul-24 |
36.3 |
22.4 |
41.3 |
-5.0 |
55.0 |
16.0 |
29.0 |
26.1 |
| Sep-24 |
37.3 |
21.1 |
41.6 |
-4.4 |
55.5 |
16.0 |
28.6 |
26.9 |
| Nov-24 |
35.8 |
21.3 |
42.9 |
-7.1 |
54.9 |
17.2 |
27.9 |
27.0 |
| Jan-25 |
34.9 |
22.1 |
43.0 |
-8.0 |
55.2 |
15.8 |
29.0 |
26.2 |
| Mar-25 |
34.7 |
24.7 |
40.6 |
-5.9 |
56.6 |
14.9 |
28.5 |
28.0 |
| May-25 |
35.7 |
22.4 |
41.9 |
-6.2 |
57.9 |
13.4 |
28.7 |
29.2 |
| Table 2: Perceptions and Expectations on Employment |
| (Percentage responses) |
| Survey Round |
Current Perception |
One year ahead Expectation |
| Increased |
Remained Same |
Decreased |
Net Response |
Will Increase |
Will Remain Same |
Will Decrease |
Net Response |
| May-24 |
36.8 |
23.0 |
40.2 |
-3.3 |
58.0 |
18.3 |
23.7 |
34.3 |
| Jul-24 |
34.5 |
23.0 |
42.6 |
-8.1 |
54.2 |
18.4 |
27.4 |
26.8 |
| Sep-24 |
35.5 |
21.8 |
42.8 |
-7.3 |
54.2 |
18.9 |
26.9 |
27.3 |
| Nov-24 |
34.6 |
23.0 |
42.4 |
-7.8 |
54.6 |
18.9 |
26.5 |
28.1 |
| Jan-25 |
34.5 |
22.7 |
42.7 |
-8.2 |
54.7 |
18.3 |
27.0 |
27.6 |
| Mar-25 |
35.5 |
23.0 |
41.5 |
-6.1 |
56.4 |
16.5 |
27.1 |
29.3 |
| May-25 |
36.2 |
21.8 |
42.1 |
-5.9 |
56.9 |
16.1 |
27.0 |
29.8 |
| Table 3: Perceptions and Expectations on Price Level |
| (Percentage responses) |
| Survey Round |
Current Perception |
One year ahead Expectation |
| Increased |
Remained Same |
Decreased |
Net Response |
Will Increase |
Will Remain Same |
Will Decrease |
Net Response |
| May-24 |
90.5 |
7.8 |
1.6 |
-88.9 |
79.0 |
10.4 |
10.6 |
-68.4 |
| Jul-24 |
93.3 |
6.0 |
0.7 |
-92.6 |
82.7 |
8.9 |
8.4 |
-74.3 |
| Sep-24 |
93.3 |
5.8 |
0.9 |
-92.4 |
82.0 |
9.5 |
8.6 |
-73.3 |
| Nov-24 |
94.3 |
5.0 |
0.7 |
-93.6 |
82.3 |
9.2 |
8.5 |
-73.8 |
| Jan-25 |
93.0 |
6.1 |
0.9 |
-92.0 |
83.0 |
9.2 |
7.9 |
-75.1 |
| Mar-25 |
91.0 |
7.8 |
1.3 |
-89.7 |
82.2 |
9.4 |
8.4 |
-73.8 |
| May-25 |
90.9 |
6.6 |
2.5 |
-88.5 |
82.5 |
8.1 |
9.4 |
-73.1 |
| Table 4: Perceptions and Expectations on Rate of Change in Price Level (Inflation)* |
| (Percentage responses) |
| Survey Round |
Current Perception |
One year ahead Expectation |
| Increased |
Remained Same |
Decreased |
Net Response |
Will Increase |
Will Remain Same |
Will Decrease |
Net Response |
| May-24 |
77.8 |
15.1 |
7.1 |
-70.6 |
79.1 |
16.0 |
4.9 |
-74.3 |
| Jul-24 |
80.6 |
13.4 |
6.1 |
-74.6 |
79.4 |
16.2 |
4.4 |
-75.0 |
| Sep-24 |
80.7 |
13.0 |
6.2 |
-74.5 |
78.7 |
15.9 |
5.4 |
-73.4 |
| Nov-24 |
82.5 |
12.1 |
5.4 |
-77.2 |
79.3 |
15.1 |
5.7 |
-73.6 |
| Jan-25 |
80.7 |
12.9 |
6.5 |
-74.2 |
79.9 |
14.5 |
5.7 |
-74.2 |
| Mar-25 |
79.4 |
14.0 |
6.7 |
-72.7 |
78.5 |
15.0 |
6.5 |
-72.0 |
| May-25 |
78.0 |
14.8 |
7.2 |
-70.7 |
78.1 |
14.7 |
7.2 |
-70.8 |
| *Applicable only for those respondents who felt price has increased/price will increase. |
| Table 5: Perceptions and Expectations on Income |
| (Percentage responses) |
| Survey Round |
Current Perception |
One year ahead Expectation |
| Increased |
Remained Same |
Decreased |
Net Response |
Will Increase |
Will Remain Same |
Will Decrease |
Net Response |
| May-24 |
25.3 |
52.3 |
22.4 |
2.9 |
56.9 |
36.9 |
6.2 |
50.7 |
| Jul-24 |
24.4 |
50.8 |
24.9 |
-0.5 |
55.9 |
37.3 |
6.8 |
49.1 |
| Sep-24 |
24.1 |
51.6 |
24.3 |
-0.3 |
55.8 |
38.2 |
6.0 |
49.9 |
| Nov-24 |
23.8 |
51.7 |
24.5 |
-0.7 |
56.6 |
37.1 |
6.4 |
50.2 |
| Jan-25 |
22.0 |
55.0 |
23.0 |
-1.0 |
55.9 |
37.4 |
6.8 |
49.1 |
| Mar-25 |
23.8 |
53.0 |
23.3 |
0.5 |
57.5 |
36.0 |
6.5 |
51.0 |
| May-25 |
24.1 |
52.2 |
23.7 |
0.4 |
58.0 |
36.3 |
5.7 |
52.3 |
| Table 6: Perceptions and Expectations on Spending |
| (Percentage responses) |
| Survey Round |
Current Perception |
One year ahead Expectation |
| Increased |
Remained Same |
Decreased |
Net Response |
Will Increase |
Will Remain Same |
Will Decrease |
Net Response |
| May-24 |
76.2 |
20.1 |
3.8 |
72.5 |
77.9 |
18.1 |
4.0 |
73.9 |
| Jul-24 |
78.9 |
18.0 |
3.1 |
75.8 |
79.5 |
16.5 |
3.9 |
75.6 |
| Sep-24 |
80.4 |
16.9 |
2.7 |
77.6 |
79.6 |
16.9 |
3.6 |
76.0 |
| Nov-24 |
80.9 |
17.2 |
1.9 |
79.0 |
80.8 |
16.4 |
2.8 |
78.0 |
| Jan-25 |
79.3 |
19.4 |
1.3 |
77.9 |
78.8 |
18.3 |
2.9 |
75.9 |
| Mar-25 |
80.1 |
18.8 |
1.2 |
78.9 |
79.6 |
18.0 |
2.4 |
77.2 |
| May-25 |
78.7 |
19.9 |
1.4 |
77.3 |
81.1 |
16.4 |
2.5 |
78.6 |
| Table 7: Perceptions and Expectations on Spending- Essential Items |
| (Percentage responses) |
| Survey Round |
Current Perception |
One year ahead Expectation |
| Increased |
Remained Same |
Decreased |
Net Response |
Will Increase |
Will Remain Same |
Will Decrease |
Net Response |
| May-24 |
85.6 |
11.8 |
2.7 |
82.9 |
84.7 |
12.3 |
3.1 |
81.6 |
| Jul-24 |
87.3 |
10.5 |
2.2 |
85.1 |
85.0 |
12.1 |
2.9 |
82.0 |
| Sep-24 |
87.9 |
10.3 |
1.8 |
86.2 |
84.9 |
12.4 |
2.7 |
82.2 |
| Nov-24 |
88.6 |
9.7 |
1.7 |
86.9 |
85.9 |
11.5 |
2.6 |
83.3 |
| Jan-25 |
87.6 |
10.9 |
1.6 |
86.0 |
85.1 |
12.3 |
2.6 |
82.5 |
| Mar-25 |
87.4 |
12.0 |
0.6 |
86.9 |
86.2 |
12.1 |
1.8 |
84.4 |
| May-25 |
87.5 |
11.0 |
1.4 |
86.1 |
86.9 |
11.3 |
1.8 |
85.1 |
| Table 8: Perceptions and Expectations on Spending- Non-Essential Items |
| (Percentage responses) |
| Survey Round |
Current Perception |
One year ahead Expectation |
| Increased |
Remained Same |
Decreased |
Net Response |
Will Increase |
Will Remain Same |
Will Decrease |
Net Response |
| May-24 |
30.5 |
35.4 |
34.1 |
-3.7 |
37.4 |
35.2 |
27.4 |
9.9 |
| Jul-24 |
29.0 |
36.7 |
34.4 |
-5.4 |
37.4 |
35.6 |
27.0 |
10.3 |
| Sep-24 |
27.6 |
40.2 |
32.3 |
-4.7 |
36.4 |
37.8 |
25.8 |
10.6 |
| Nov-24 |
30.2 |
37.2 |
32.6 |
-2.4 |
38.4 |
35.0 |
26.6 |
11.8 |
| Jan-25 |
29.2 |
38.5 |
32.3 |
-3.1 |
37.4 |
36.1 |
26.5 |
11.0 |
| Mar-25 |
28.5 |
40.9 |
30.7 |
-2.2 |
37.7 |
37.7 |
24.6 |
13.1 |
| May-25 |
27.8 |
41.1 |
31.2 |
-3.4 |
38.2 |
37.3 |
24.5 |
13.8 |
|
 IST,
IST,