X.1 The key financial results of the Reserve Bank’s operations during the year are presented in this Chapter.
INCOME AND EXPENDITURE X.2 The gross income, expenditure, appropriations and net disposable income of the Reserve Bank have been evolving over the last five years (Table 10.1).
| Table 10.1: Trends in Gross Income, Expenditure and Net Disposable Income |
| (Rupees crore) |
| Item |
2001-02 |
2002-03 |
2003-04 |
2004-05 |
2005-06 |
| 1 |
2 |
3 |
4 |
5 |
6 |
| Total Income (Gross) |
24,690.34 |
23,185.64 |
14,323.70 |
19,028.28 |
26,320.31 |
| Less transfer to: |
|
|
|
|
|
| |
(i) Contingency Reserve |
6,996.04 |
6,733.92 |
969.47 |
6,125.92 |
10,936.42 |
| |
(ii) Asset Development Reserve |
827.91 |
890.31 |
188.09 |
687.09 |
1,126.79 |
| |
Total (i + ii) |
7,823.95 |
7,624.23 |
1,157.56 |
6,813.01 |
12,063.21 |
| Total Income (Net) |
16,866.39 |
15,561.41 |
13,166.14 |
12,215.27 |
14,257.10 |
| Total Expenditure |
6,542.39 |
6,723.41 |
7,762.14 |
6,811.27 |
5,849.10 |
| Net Disposable Income |
10,324.00 |
8,838.00 |
5,404.00 |
5,404.00 |
8,408.00 |
| |
Less : Transfer to Funds * |
4.00 |
4.00 |
4.00 |
4.00 |
4.00 |
| Surplus Transfer to the Government |
10,320.00 |
8,834.00 |
5,400.00 |
5,400.00 |
8,404.00 |
| * : An amount of Rupees one crore each transferred to the National Industrial Credit (Long Term Operations) Fund, National Rural Credit (Long Term Operations) Fund,
National Rural Credit (Stabilisation) Fund and National Housing Credit (Long Term Operations) Fund during each of the five years. |
Surplus Transferable to Government of India
X.3 The surplus transferable to the Central Government for the year 2005-06 amounted to Rs.8,404.00 crore, inclusive of Rs.2,106.00 crore towards interest differential on special securities converted into marketable securities. The transfer on account of interest differential is intended to compensate the Government for the difference in interest expenditure which the Government had to bear consequent on the conversion.
INCOME
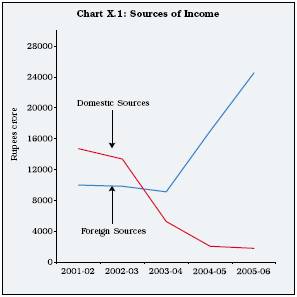
X.4 The gross income of the Reserve Bank for the year 2005-06 was Rs.26,320.31 crore, which was higher by Rs.7,292.03 crore (38.3 per cent) than the previous year’s total income of Rs.19,028.28 crore. There was an increase in income from foreign sources while income from domestic sources declined during the year (Table 10.2 and Chart X.1).
Table 10.2: Gross Income |
(Rupees crore) |
Item |
2001-02 |
2002-03 |
2003-04 |
2004-05 |
2005-06 |
1 |
|
2 |
3 |
4 |
5 |
6 |
A. |
Foreign Sources |
|
|
|
|
|
|
Interest, Discount, Exchange |
9,986.46 |
9,826.65 |
9,103.50 |
16,979.47 |
24,538.03 |
B. |
Domestic Sources |
|
|
|
|
|
|
Interest |
14,492.14 |
13,064.77 |
4,872.41 |
1,607.34 |
1,207.04 |
|
Other Earnings |
211.74 |
294.22 |
347.79 |
441.47 |
575.24 |
Total: Domestic |
14,703.88 |
13,358.99 |
5,220.20 |
2,048.81 |
1,782.28 |
C. |
Total Income (Gross) (A+B) |
24,690.34 |
23,185.64 |
14,323.70 |
19,028.28 |
26,320.31 |
Table 10.3: Contingency and Asset Development Reserves and
Surplus Transfer to the Government |
(Rupees crore) |
Item |
2001-02 |
2002-03 |
2003-04 |
2004-05 |
2005-06 |
1 |
2 |
3 |
4 |
5 |
6 |
Total Income (Gross) |
24,690.34 |
23,185.64 |
14,323.70 |
19,028.28 |
26,320.31 |
Transfer to Contingency Reserve |
6,996.04 |
6,733.92 |
969.47 |
6,125.92 |
10,936.42 |
|
(28.3) |
(29.0) |
(6.8) |
(32.2) |
(41.6) |
Asset Development Reserve |
827.91 |
890.31 |
188.09 |
687.09 |
1,126.79 |
|
(3.4) |
(3.8) |
(1.3) |
(3.6) |
(4.3) |
Surplus Transfer to the Government |
10,320.00 |
8,834.00 |
5,400.00 |
5,400.00 |
8,404.00 |
|
(41.8) |
(38.1) |
(37.7) |
(28.4) |
(31.9) |
Note : Figures in parentheses indicate proportion to total income. |
X.5 The share of transfer to Contingency Reserve, Asset Development Reserve and surplus transferred to Government as a percentage to total income is given in Table 10.3.
Earnings from Foreign Sources
X.6 The Reserve Bank’s earnings from the deployment of foreign currency assets and gold increased by Rs.7,558.56 crore (44.5 per cent) from Rs.16,979.47 crore in 2004-05 to Rs.24,538.03 crore in 2005-06 (Table 10.4). This was mainly on account of increase in the level of foreign currency assets and hardening of global short term interest rates. Before accounting for mark-to-market depreciation on securities, the rate of earnings on foreign currency assets and gold was 4.1 per cent in 2005-06 as against 3.2 per cent in 2004-05. The rate of earnings on foreign currency assets and gold, after accounting for depreciation, increased from 3.1 per cent in 2004-05 to 3.9 per cent in 2005-06.
Table 10.4: Earnings from Foreign Sources |
(Rupees crore) |
Item |
As on |
Variation |
|
June 30, 2005 |
June 30, 2006 |
Absolute |
Per cent |
1 |
2 |
3 |
4 |
5 |
Foreign Currency Assets (FCA) |
5,75,863.66 |
7,18,701.18 |
1,42,837.52 |
24.8 |
Gold |
19,375.10 |
28,478.87 |
9,103.77 |
47.0 |
Special Drawing Rights (SDR) |
18.35 |
2.17 |
(-) 16.18 |
(-) 88.2 |
Reserve Position in the IMF ** |
6,791.43 |
3,518.31 |
(-) 3,273.12 |
(-) 48.2 |
Total Foreign Exchange Reserves (FER) |
6,02,048.54 |
7,50,700.53 |
1,48,651.99 |
24.7 |
Average FCA |
5,51,659.54 |
6,29,067.47 |
77,407.93 |
14.0 |
Earnings (Interest, Discount, Exchange gain/loss, Capital gain / loss on Securities) |
17,889.74 |
25,569.34 |
7,679.60 |
42.9 |
Depreciation on Securities |
(-) 910.27 |
(-) 1,031.31 |
121.04 |
13.3 |
Earnings Net of Depreciation |
16,979.47 |
24,538.03 |
7,558.56 |
44.5 |
Memo : |
|
|
|
|
Unrealised Appreciation on Securities |
900.14 |
194.83 |
(-) 705.31 |
(-) 78.4 |
Earnings as percentage of Average FCA |
3.2 |
4.1 |
|
|
Earnings (net of depreciation) as percentage of Average FCA |
3.1 |
3.9 |
|
|
** : Reserve position in the International Monetary Fund (IMF), which was shown as a memo item from May 23, 2003 to March 26, 2004
has been included in the reserves from the week ended April 2, 2004. |
Table 10.5: Earnings from Domestic Sources |
(Rupees crore) |
Item |
As on |
Variation |
|
|
June 30, 2005 |
June 30, 2006 |
Absolute |
Per cent |
1 |
2 |
3 |
4 |
5 |
Domestic Assets |
106,952.94 |
90,106.99 |
(-) 16,845.95 |
(-) 15.8 |
Weekly Average of Domestic Assets |
99,977.76 |
101,303.96 |
1,326.20 |
1.3 |
Earnings |
2,048.81 |
1,782.28 |
(-) 266.53 |
(-) 13.0 |
|
(8,143.92) |
(7,631.93) |
|
|
of which: |
|
|
|
|
Interest |
1,607.34 |
1,207.04 |
(-) 400.30 |
(-) 24.9 |
(i) |
Profit on Sale of Securities |
4,220.52 |
3,776.20 |
(-) 444.32 |
(-) 10.5 |
(ii) |
Interest on Securities |
(-) 3,272.08 |
(-) 2,834.23 |
437.85 |
13.4 |
(iii) |
Interest on Loans and Advances |
367.35 |
219.27 |
(-) 148.08 |
(-) 40.3 |
(iv) |
Other Interest Receipts |
291.55 |
45.80 |
(-) 245.75 |
(-) 84.3 |
Other Earnings |
441.47 |
575.24 |
133.77 |
30.3 |
(i) |
Discount |
0.01 |
- |
(-) 0.01 |
(-) 100 |
(ii) |
Exchange |
0.04 |
0.05 |
0.01 |
25.0 |
(iii) |
Commission |
381.36 |
395.20 |
13.84 |
3.6 |
(iv) |
Rent Realised and Others |
60.06 |
179.99 |
119.93 |
199.7 |
Memo :
Earnings in percentage terms (on average domestic assets) 2.0 1.8 Earnings in percentage terms (excluding profit on sale of securities) (-) 2.2 (-) 2.0 Note : Figures in parentheses are depreciation on securities. |
Income from Domestic Sources
X.7 Domestic income decreased by Rs.266.53 crore (13 per cent) from Rs.2,048.81 crore in 2004-05 to Rs.1,782.28 crore in 2005-06. The decline in income was mainly on account of reduced profit on sale of securities (from Rs.4,220.52 crore in 2004-05 to Rs.3,776.20 crore in 2005-06) and a decline in interest income on loans due to lower recourse to WMA by Central and State Governments in the face of substantial cash balances (Table 10.5).
EXPENDITURE
X.8 Total expenditure of the Reserve Bank declined by Rs.962.17 crore (14.1 per cent) from Rs.6,811.27 crore in 2004-05 to Rs.5,849.10 crore in 2005-06 (Table 10.6 and Chart X.2).
Interest Payment
X.9 Interest payment increased by Rs.138.13 crore (10 per cent) from Rs.1,386.28 crore in 2004-05 to Rs.1,524.41 crore in 2005-06. The increase was mainly on account of higher payment of interest on cash reserve ratio (CRR) which was due to higher growth in aggregate deposits during the year. The Bank had earmarked certain Government securities from its Investment Account in order to cover the liabilities in Provident Fund, Superannuation Fund and Encashment of Ordinar y Leave Fund. Consequently, interest payments on these funds during 2005-06 (Rs.449.21 crore) have been made from the interest earned on these earmarked securities and hence do not form part of interest payments.
Establishment Expenditure
X.10 Establishment expenditure declined by Rs.733.29 crore (44.4 per cent) from Rs.1,653.17 crore in 2004-05 to Rs.919.88 crore in 2005-06. The decline in establishment expenditure was due to reduction in provision towards Gratuity and Superannuation Fund from Rs.743.06 crore in 2004- 05 to Rs.19.26 crore in 2005-06, which was on account of utilisation of additional provision of Rs.515 crore made in earlier year. The establishment expenditure during 2005-06 comprised of salary (45.8 per cent), allowances (23.3 per cent), funds (7.2 per cent) and miscellaneous expenditure (23.7 per cent).
Table 10.6: Expenditure |
(Rupees crore) |
Item |
2001-02 |
2002-03 |
2003-04 |
2004-05 |
2005-06 |
1 |
2 |
3 |
4 |
5 |
6 |
I. |
Interest Payment |
2,334.99 |
1,990.09 |
1,808.48 |
1,386.28 |
1,524.41 |
|
of which: |
|
|
|
|
|
|
Scheduled Banks |
1,838.57 |
1,483.02 |
1,323.23 |
1,276.83 |
1,523.72 |
II. |
Establishment |
1,304.36 |
1,488.86 |
2,232.99 |
1,653.17 |
919.88 |
III |
Non-Establishment |
2,903.04 |
3,244.46 |
3,720.67 |
3,771.82 |
3,404.81 |
|
of which: |
|
|
|
|
|
|
a) Agency charges |
1,207.84 |
1,352.41 |
1,539.12 |
1,824.17 |
1,833.55 |
|
b) Security printing |
1,304.49 |
1,433.09 |
1,709.56 |
1,443.57 |
1,034.86 |
Total [I+II+III] |
6,542.39 |
6,723.41 |
7,762.14 |
6,811.27 |
5,849.10 |
Non-Establishment Expenditure
X.11 Expenditure on security printing comprising, inter alia, cost of printing currency notes and cheque forms decreased by Rs.408.71 crore (28.3 per cent) from Rs.1,443.57 crore in 2004-05 to Rs.1,034.86 crore in 2005-06 mainly due to lower supply of notes by 478.30 crore pieces. The expenditure incurred for security printing includes a sum of Rs.106.67 crore paid for banknotes supplied during the previous years. 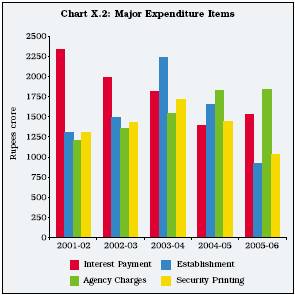
BALANCE SHEET
LIABILITIES
National Industrial Credit (Long Term Operations) Fund
X.12 There were no operations in the National Industrial Credit (Long Term Operations) Fund (established under Section 46 C of the Reserve Bank of India Act, 1934) during 2005-06 except the credit of Rs.1.00 crore to the Fund out of the Reserve Bank’s income.
National Housing Credit (Long Term Operations) Fund
X.13 The National Housing Credit (Long Term Operations) Fund was established by the Reserve Bank in terms of Section 46 D(l) of the Reserve Bank of India Act, 1934 in January 1989. A token contribution of Rs.1.00 crore was made to the Fund out of the Reserve Bank’s income during 2005-06.
Deposits - Banks
X.14 ‘Deposits - Banks’ represent balances maintained by banks in current account with the Reserve Bank mainly for maintaining CRR and as working funds for clearing adjustments.
Deposits - Others
X.15 ‘Deposits - Others’ include deposits from financial institutions, employees’ provident fund deposits, surplus earmarked pending transfer to the Government and sundry deposits.
Other Liabilities
X.16 ‘Other Liabilities’ include the internal reserves and provisions of the Reserve Bank and net credit balance in the RBI General Account. These liabilities have increased by Rs.72,017.53 crore (71.8 per cent) from Rs.1,00,356.27 crore as on June 30, 2005 to Rs.1,72,373.80 crore as on June 30, 2006 mainly on account of increase in the level of Currency and Gold Revaluation Account (CGRA).
X.17 The reserves, viz. Contingency Reserve, Asset Development Reserve, Currency and Gold Revaluation Account and Exchange Equalisation Account reflected in ‘Other Liabilities’ are in addition to the ‘Reserve Fund’ of Rs.6,500.00 crore held by the Reserve Bank as a distinct balance sheet head.
Currency and Gold Revaluation Account (CGRA) and Exchange Equalisation Account (EEA)
X.18 Gains/losses on valuation of foreign currency assets and gold due to movements in the exchange rates and/or prices of gold are not taken to Profit and Loss Account but instead booked under a balance sheet head named as CGRA. The balance represents accumulated net gain on valuation of foreign currency assets and gold. During 2005-06, there was an accretion of Rs.59,882.97 crore in CGRA, thus increasing its balance from Rs.26,906.21 crore as on June 30, 2005 to Rs.86,789.18 crore as on June 30, 2006. The balance in CGRA at the end of June 2006 was equivalent to 11.6 per cent of foreign currency assets and gold holdings of the Reserve Bank, as compared with 4.5 per cent at the end of June 2005. The increase was on account of increase in the level of foreign currency assets during 2005-06, hardening of international gold prices, depreciation of rupee against the US dollar and depreciation of US dollar against other currencies. The balance in EEA represents provision made for exchange losses arising out of forward commitments. The balance in the EEA as on June 30, 2006 stood at Rs.3.28 crore.
Table 10.7: Balances in Currency and |
Gold Revaluation Account and Exchange |
Equalisation Account |
(Rupees crore) |
As on June 30 |
Currency and |
Exchange |
|
Gold Revaluation |
Equalisation |
|
Account |
Account |
1 |
2 |
3 |
2002 |
51,010.77 |
51.50 |
2003 |
51,276.41 |
567.25 |
2004 |
62,283.04 |
5.65 |
2005 |
26,906.21 |
0.50 |
2006 |
86,789.18 |
3.28 |
The balances in CGRA and EEA are grouped under ‘Other Liabilities’ in the balance sheet (Table 10.7).
Contingency Reserve and Asset Development Reserve
X.19 The Reserve Bank maintains a Contingency Reserve (CR) to enable it to absorb unexpected and unforeseen contingencies. The balance in CR has increased from Rs.62,344.68 crore as on June 30, 2005 to Rs.73,281.10 crore as on June 30, 2006. A transfer of Rs.10,936.42 crore was made to CR during 2005-06 from the Reserve Bank’s income. The balance in CR is sufficient to meet contingent liabilities.
X.20 In order to meet the internal capital expenditure and make investments in its subsidiaries and associate institutions, the Reserve Bank had created a separate Asset Development Reserve (ADR) in 1997-98, with the aim of reaching one per cent of the Reserve Bank’s total assets within the overall indicative target of 12 per cent set for CR. In the year 2005-06, an amount of Rs.1,126.79 crore was transferred from income to ADR raising its level from Rs.6,466.03 crore as on June 30, 2005 to Rs.7,592.82 crore as on June 30, 2006. CR and ADR together constituted 10 per cent of total assets of the Bank as on June 30, 2006 (Table 10.8).
Table 10.8: Balances in Contingency Reserve and |
Asset Development Reserve |
(Rupees crore) |
As on |
Balance in |
Balance in |
Total |
Percentage |
June 30 |
CR |
ADR |
|
to total
assets |
1 |
2 |
3 |
4 |
5 |
2002 |
48,434.17 |
4,700.54 |
53,134.71 |
11.7 |
2003 |
55,249.29 |
5,590.85 |
60,840.14 |
11.7 |
2004 |
56,218.76 |
5,778.94 |
61,997.70 |
10.2 |
2005 |
62,344.68 |
6,466.03 |
68,810.71 |
10.1 |
2006 |
73,281.10 |
7,592.82 |
80,873.92 |
10.0 |
ASSETS
Foreign Currency Assets
X.21 The foreign currency assets comprise foreign securities held in Issue Department, balances held abroad and investments in foreign securities held in Banking Department. Such assets rose from Rs.5,75,863.66 crore as on June 30, 2005 to
Table 10.9: Outstanding Foreign Currency and |
Domestic Assets |
(Rupees crore) |
As on June 30 |
Foreign |
Domestic |
|
Currency Assets |
Assets |
1 |
2 |
3 |
2002 |
2,67,333.18 |
1,86,226.62 |
2003 |
3,65,000.98 |
1,54,812.91 |
2004 |
5,24,865.01 |
84,872.74 |
2005 |
5,75,863.66 |
1,06,952.94 |
2006 |
7,18,701.18 |
90,106.99 |
Rs.7,18,701.18 crore as on June 30, 2006. The increase in the level of foreign currency assets was mainly on account of net purchases of US dollars from the market, interest and discount received and revaluation gains (Table 10.9 and Chart X.3).
Investment in Government of India Rupee Securities
X.22 Investment in Government of India Rupee Securities, which was Rs.68,476.48 crore as on June30, 2005 declined by Rs.29,541.98 crore (43.1 per cent) to Rs.38,934.50 crore as on June 30, 2006.
Investments in Shares of Subsidiaries and Associate Institutions
X.23 There was no change in the Reserve Bank’s investments in the shares of its subsidiaries and associate institutions during 2005-06 (Table 10.10).
Other Assets
X.24 ‘Other Assets’ comprise mainly fixed assets, gold holdings in the Banking Department, amounts spent on projects pending completion and staff advances. The level of ‘Other Assets’ has increased by Rs.6,220.23 crore (43.2 per cent) from Rs.14,403.57 crore as on June 30, 2005 to Rs.20,623.80 crore as on June 30, 2006.
Auditors
X.25 The accounts of the Reserve Bank for the year 2005-06 were audited by M/s. Khimji Kunverji & Co., Mumbai, M/s. J.L. Sengupta & Co., Kolkata, M/s. S.N. Nanda & Co., New Delhi, M/s. Rajendra K. Goel & Co., New Delhi, M/s. Ford, Rhodes, Parks & Co., Mumbai and M/s. M.K.Dandeker & Co., Chennai appointed by the Central Government. 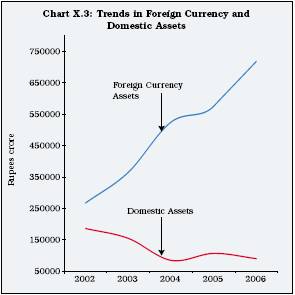
Table 10.10: Investments in Shares of |
Subsidiaries/Associate Institutions |
(Rupees crore) |
|
Institution |
Book value of shares held as on |
|
|
June 30, |
June 30, |
|
|
2005 |
2006 |
|
1 |
2 |
3 |
1. |
Deposit Insurance and Credit |
|
|
|
Guarantee Corporation |
50.00 |
50.00 |
2. |
National Bank for Agriculture |
|
|
|
and Rural Development |
1,450.00 |
1,450.00 |
3. |
State Bank of India |
1,222.73 |
1,222.73 |
4. |
National Housing Bank |
450.00 |
450.00 |
5. |
Bharatiya Reserve Bank |
|
|
|
Note Mudran (Pvt.) Ltd. |
800.00 |
800.00 |
Total |
3,972.73 |
3,972.73 |
|


