|
आज भारतीय रिज़र्व बैंक ने 2024-25 की दूसरी तिमाही के दौरान संचालित सेवा और आधारभूत संरचना परिदृश्य (एसआइओएस) के तिमाही सर्वेक्षण के 42 वें चक्र का परिणाम जारी किया। यह भविष्योन्मुखी सर्वेक्षण1 मांग की स्थिति, मूल्य स्थिति और अन्य व्यावसायिक स्थितियों से संबंधित व्यावसायिक मापदंडों के एक सेट पर सेवाओं और बुनियादी ढांचे क्षेत्रों में लगी भारतीय कंपनियों के गुणात्मक मूल्यांकन और अपेक्षाओं को दर्शाता है। सर्वेक्षण2 के इस चक्र में, 761 कंपनियों ने 2024-25 दूसरी तिमाही के लिए अपना मूल्यांकन और 2024-25 तिसरी तिमाही के लिए अपेक्षाओं के साथ-साथ बाद की दो तिमाहियों के लिए प्रमुख मापदंडों पर अपना दृष्टिकोण प्रदान किया।
विशेष:
A. सेवा क्षेत्र
2024-25 की दूसरी तिमाही के लिए मूल्यांकन
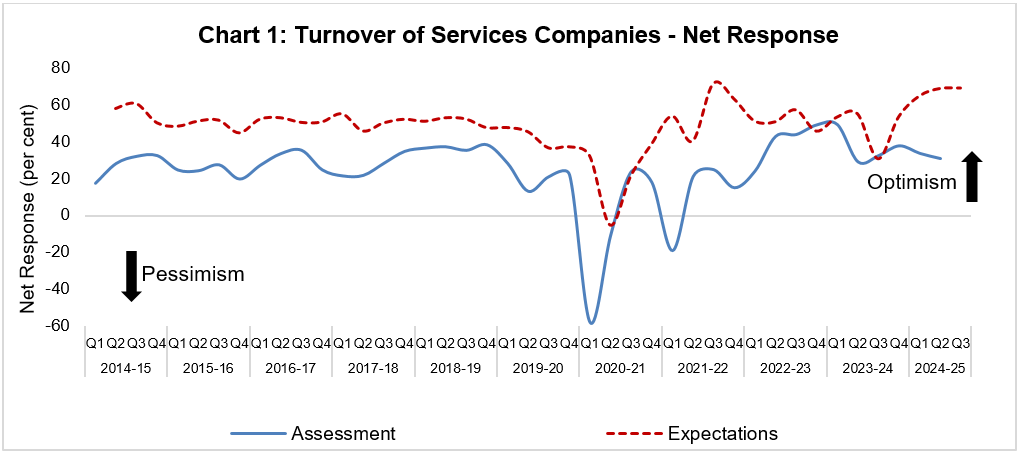
- सेवा क्षेत्र की फर्मों ने 2024-25 की दूसरी तिमाही में अपनी समग्र व्यावसायिक स्थिति, टर्नओवर और रोजगार की स्थिति के बारे में सकारात्मक मूल्यांकन बनाए रखा, जो पिछली तिमाही की तुलना में कुछ कम आशावादी है (चार्ट 1 and तालिका ए)।
- वित्त की लागत, इनपुट कीमतों और वेतन से उत्पन्न दबाव में कमी देखी गई।
- बिक्री मूल्यों और लाभ मार्जिन में वृद्धि पर धारणाएं कम हुईं लेकिन सकारात्मक रहीं (तालिका ए)।
2024-25 की तिसरी तिमाही के लिए अपेक्षाएं
- उत्तरदाता 2024-25 की तीसरी तिमाही में मांग की स्थिति को लेकर अत्यधिक आशावादी रहे, हालांकि समग्र व्यावसायिक स्थिति और नौकरी परिदृश्य के संबंध में उनकी आशावाद पिछली तिमाही की तुलना में कम था (चार्ट 1 and तालिका ए)।
- इनपुट लागत और वित्त लागत से उत्पन्न दबाव 2024-25 की तीसरी तिमाही के दौरान जारी रहने की संभावना है; हालांकि, वेतन व्यय से उत्पन्न दबाव कम होने की उम्मीद है।
- 2024-25 की तीसरी तिमाही में बिक्री मूल्य और लाभ मार्जिन में कम वृद्धि दर्ज होने की उम्मीद है।
2024-25 की चौथी तिमाही और 2025-26 पहिली तिमाही के लिए अपेक्षाएं
- समग्र कारोबारी स्थिति में सुधार की उम्मीद है; कंपनियां टर्नओवर और रोजगार के मामले में अत्यधिक आशावादी बनी हुई हैं (तालिका सी)।
- इनपुट लागत का दबाव जारी रहने की संभावना है और बिक्री मूल्यों में वृद्धि इसके अनुरूप है।
- उत्तरदाता ने बताया कि वे 2024-25 के पहिली दौरान अपने संसाधनों से 11.2 प्रतिशत अतिरिक्त सेवाएँ प्रदान कर सकते हैं (तालिका एस14)।
B. आधारभूत संरचना क्षेत्र
2024-25 की दूसरी तिमाही के लिए मूल्यांकन
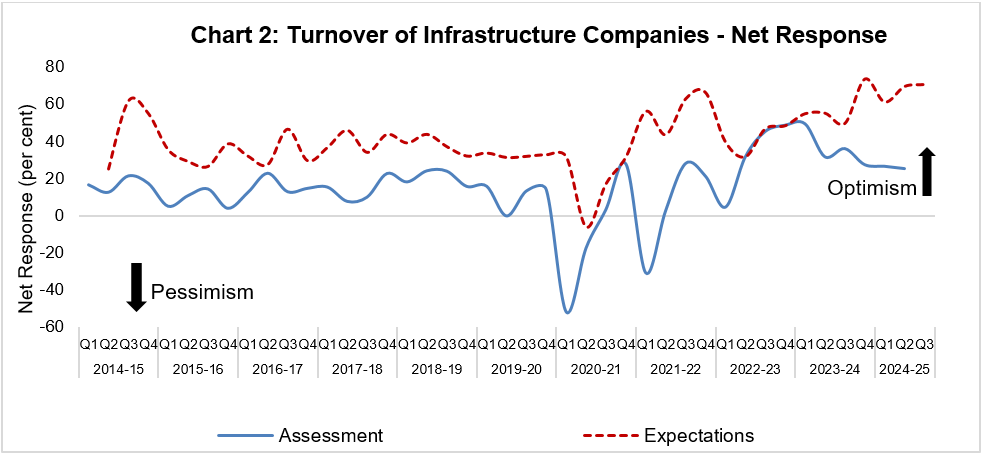
- आधारभूत संरचना कंपनियों ने समग्र व्यावसायिक स्थिति के साथ-साथ अपने टर्नओवर पर सकारात्मक भावनाएं बरकरार रखीं (चार्ट 2 and तालिका बी)।
- उद्यमों ने इनपुट लागत से उच्च लागत दबाव का अनुमान लगाया; हालांकि, वेतन व्यय और वित्त की लागत से दबाव कम होने का आकलन किया गया।
- उत्तरदाताओं ने 2024-25 की दूसरी तिमाही के दौरान बिक्री मूल्यों और लाभ मार्जिन में धीमी वृद्धि का आकलन किया।
2024-25 की तिसरी तिमाही के लिए अपेक्षाएं
- इन्फ्रास्ट्रक्चर फर्मों ने समग्र व्यावसायिक स्थितियों और कारोबार पर अत्यधिक आशावादी दृष्टिकोण के लिए मतदान किया (चार्ट 2 and तालिका बी)।
- आधारभूत संरचना क्षेत्र में इनपुट लागत का दबाव जारी रहने की संभावना है, जिसके कारण बिक्री मूल्यों में वृद्धि होगी; लाभ मार्जिन पर आशावाद कम हुआ है।
2024-25 की चौथी तिमाही और 2025-26 पहिली तिमाही के लिए अपेक्षाएं
- कंपनियों ने 2025-26 की पहली तिमाही तक मांग की स्थिति पर उच्च आशावाद व्यक्त किया (तालिका डी)।
- इनपुट लागत का दबाव निकट भविष्य में जारी रहने की संभावना है तथा बिक्री मूल्यों में निरंतर वृद्धि दर्ज होने की उम्मीद है।
Summary of Net Responses3 on Survey Parameters
|
Table A: Services Sector
|
|
(per cent)
|
|
Parameters
|
Assessment period
|
Expectations period
|
|
Q1:24-25
|
Q2:24-25
|
Q2:24-25
|
Q3:24-25
|
|
Overall Business Situation
|
34.1
|
30.2
|
69.4
|
68.0
|
|
Turnover
|
33.5
|
30.7
|
68.7
|
68.9
|
|
Full-time Employees
|
27.8
|
20.1
|
50.5
|
44.0
|
|
Part-time Employees
|
22.7
|
13.9
|
52.9
|
52.1
|
|
Availability of Finance
|
32.0
|
19.8
|
57.6
|
50.1
|
|
Cost of Finance
|
-35.1
|
-32.3
|
-56.9
|
-54.3
|
|
Salary & Wages
|
-42.6
|
-25.8
|
-53.8
|
-44.5
|
|
Cost of Inputs
|
-44.7
|
-40.6
|
-65.9
|
-64.2
|
|
Selling Price
|
21.7
|
12.1
|
54.1
|
48.0
|
|
Profit Margin
|
10.5
|
4.2
|
45.4
|
38.4
|
|
Inventories
|
24.3
|
18.4
|
52.0
|
46.6
|
|
Technical/Service Capacity
|
26.2
|
18.5
|
57.0
|
58.3
|
|
Physical Investment
|
24.2
|
16.1
|
55.4
|
56.7
|
|
Table B: Infrastructure Sector
|
|
(per cent)
|
|
Parameters
|
Assessment period
|
Expectations period
|
|
Q1:24-25
|
Q2:24-25
|
Q2:24-25
|
Q3:24-25
|
|
Overall Business Situation
|
26.6
|
21.7
|
74.5
|
67.4
|
|
Turnover
|
26.6
|
25.4
|
69.9
|
71.0
|
|
Full-time Employees
|
21.4
|
18.1
|
62.7
|
39.3
|
|
Part-time Employees
|
25.5
|
9.7
|
60.7
|
48.9
|
|
Availability of Finance
|
29.2
|
18.2
|
68.0
|
54.4
|
|
Cost of Finance
|
-29.1
|
-26.6
|
-62.4
|
-60.3
|
|
Salary & Wages
|
-34.4
|
-26.8
|
-70.6
|
-43.1
|
|
Cost of Inputs
|
-36.1
|
-40.8
|
-75.2
|
-70.8
|
|
Selling Price
|
21.5
|
10.9
|
66.7
|
50.0
|
|
Profit Margin
|
16.9
|
5.8
|
61.8
|
40.6
|
|
Inventories
|
29.0
|
20.5
|
70.1
|
56.4
|
|
Technical/Service Capacity
|
31.9
|
19.1
|
79.1
|
72.5
|
|
Physical Investment
|
27.3
|
25.7
|
75.8
|
75.3
|
Expectations of Select Parameters for extended period – Net response (in per cent)
|
Table C: Services Sector
|
|
Parameter
|
Round 41
|
Round 42
|
|
Q2:24-25
|
Q3:24-25
|
Q4:24-25
|
Q1:25-26
|
|
Overall Business Situation
|
69.4
|
68.0
|
69.6
|
69.7
|
|
Turnover
|
68.7
|
68.9
|
70.7
|
70.4
|
|
Full-time Employees
|
50.5
|
44.0
|
45.7
|
44.7
|
|
Part-time Employees
|
52.9
|
52.1
|
51.0
|
50.5
|
|
Cost of Inputs
|
-65.9
|
-64.2
|
-58.6
|
-58.2
|
|
Selling Price
|
54.1
|
48.0
|
50.6
|
51.4
|
|
Table D: Infrastructure Sector
|
|
Parameter
|
Round 41
|
Round 42
|
|
Q2:24-25
|
Q3:24-25
|
Q4:24-25
|
Q1:25-26
|
|
Overall Business Situation
|
74.5
|
67.4
|
71.9
|
71.1
|
|
Turnover
|
69.9
|
71.0
|
74.5
|
72.5
|
|
Full-time Employees
|
62.7
|
39.3
|
45.2
|
42.2
|
|
Part-time Employees
|
60.7
|
48.9
|
62.4
|
61.9
|
|
Cost of Inputs
|
-75.2
|
-70.8
|
-59.8
|
-59.8
|
|
Selling Price
|
66.7
|
50.0
|
57.7
|
60.0
|
Note:Please see the excel file for time series data
Services Sector
| Table S1: Assessment and Expectation for Overall Business Situation |
| (Percentage responses)@ |
|
Quarter
|
Assessment
|
Expectation
|
|
Better
|
No Change
|
Worse
|
Net response#
|
Better
|
No Change
|
Worse
|
Net response
|
|
Q2:23-24
|
48.4
|
37.7
|
14.0
|
34.4
|
62.3
|
31.3
|
6.4
|
56.0
|
|
Q3:23-24
|
47.6
|
40.4
|
12.0
|
35.6
|
51.0
|
41.2
|
7.8
|
43.1
|
|
Q4:23-24
|
48.9
|
39.8
|
11.4
|
37.5
|
59.4
|
36.0
|
4.6
|
54.8
|
|
Q1:24-25
|
43.0
|
48.1
|
8.9
|
34.1
|
68.5
|
28.4
|
3.1
|
65.3
|
|
Q2:24-25
|
41.9
|
46.4
|
11.7
|
30.2
|
71.5
|
26.5
|
2.0
|
69.4
|
|
Q3:24-25
|
|
|
|
|
70.1
|
27.8
|
2.1
|
68.0
|
|
‘Increase’ in Overall business situation is optimistic.
@: Due to rounding off percentage may not add up to 100.
#: Net Response (NR) is the difference of percentage of the respondents reporting optimism and that reporting pessimism. The range is -100 to 100. Any value greater than zero indicates expansion/ optimism and any value less than zero indicates contraction/ pessimism.
|
|
Table S2: Assessment and Expectation for Turnover
|
|
(Percentage responses)
|
|
Quarter
|
Assessment
|
Expectation
|
|
Increase
|
No Change
|
Decrease
|
Net response
|
Increase
|
No Change
|
Decrease
|
Net response
|
|
Q2:23-24
|
43.8
|
41.3
|
14.9
|
28.9
|
59.3
|
36.3
|
4.4
|
54.9
|
|
Q3:23-24
|
48.2
|
35.9
|
15.9
|
32.3
|
40.3
|
49.9
|
9.8
|
30.5
|
|
Q4:23-24
|
51.6
|
34.3
|
14.0
|
37.6
|
59.8
|
33.8
|
6.4
|
53.4
|
|
Q1:24-25
|
45.2
|
43.1
|
11.7
|
33.5
|
70.5
|
23.6
|
5.9
|
64.6
|
| Q2:24-25
|
43.6
|
43.5
|
12.9
|
30.7
|
71.9
|
24.8
|
3.3
|
68.7
|
| Q3:24-25
|
|
|
|
|
71.9
|
25.2
|
3.0
|
68.9
|
|
‘Increase’ in Turnover is optimistic. Footnotes @ and # given in Table S1 are applicable here.
|
|
Table S3: Assessment and Expectation for Full-time Employees
|
|
(Percentage responses)
|
|
Quarter
|
Assessment
|
Expectation
|
|
Increase
|
No Change
|
Decrease
|
Net response
|
Increase
|
No Change
|
Decrease
|
Net response
|
|
Q2:23-24
|
34.3
|
48.7
|
17.0
|
17.3
|
44.7
|
52.6
|
2.7
|
42.0
|
|
Q3:23-24
|
29.9
|
61.6
|
8.5
|
21.4
|
26.4
|
63.7
|
9.9
|
16.5
|
|
Q4:23-24
|
33.9
|
57.1
|
9.0
|
24.8
|
32.4
|
64.0
|
3.6
|
28.8
|
|
Q1:24-25
|
34.8
|
58.2
|
7.0
|
27.8
|
48.4
|
49.5
|
2.1
|
46.3
|
|
Q2:24-25
|
29.0
|
62.0
|
9.0
|
20.1
|
52.2
|
46.0
|
1.7
|
50.5
|
|
Q3:24-25
|
|
|
|
|
45.8
|
52.4
|
1.8
|
44.0
|
|
‘Increase’ in Full-time Employees is optimistic. Footnotes @ and # given in Table S1 are applicable here.
|
|
Table S4: Assessment and Expectation for Part-time Employees
|
|
(Percentage responses)
|
|
Quarter
|
Assessment
|
Expectation
|
|
Increase
|
No Change
|
Decrease
|
Net response
|
Increase
|
No Change
|
Decrease
|
Net response
|
|
Q2:23-24
|
24.4
|
57.5
|
18.1
|
6.2
|
36.7
|
57.9
|
5.3
|
31.4
|
|
Q3:23-24
|
21.5
|
70.3
|
8.2
|
13.2
|
31.0
|
52.3
|
16.7
|
14.4
|
|
Q4:23-24
|
30.2
|
62.4
|
7.5
|
22.7
|
28.8
|
65.4
|
5.8
|
23.1
|
|
Q1:24-25
|
28.9
|
65.0
|
6.1
|
22.7
|
50.8
|
46.7
|
2.5
|
48.3
|
|
Q2:24-25
|
22.2
|
69.6
|
8.3
|
13.9
|
55.4
|
42.1
|
2.5
|
52.9
|
|
Q3:24-25
|
|
|
|
|
54.1
|
43.8
|
2.1
|
52.1
|
|
‘Increase’ in Part-time Employees is optimistic. Footnotes @ and # given in Table S1 are applicable here.
|
|
Table S5: Assessment and Expectation for Availability of Finance
|
|
(Percentage responses)
|
|
Quarter
|
Assessment
|
Expectation
|
|
Improve
|
No Change
|
Worsen
|
Net response
|
Improve
|
No Change
|
Worsen
|
Net response
|
|
Q2:23-24
|
30.6
|
56.8
|
12.6
|
18.0
|
39.5
|
57.0
|
3.5
|
36.0
|
|
Q3:23-24
|
32.3
|
60.3
|
7.4
|
24.9
|
31.5
|
61.1
|
7.3
|
24.2
|
|
Q4:23-24
|
36.3
|
55.3
|
8.4
|
27.8
|
40.4
|
56.7
|
2.9
|
37.4
|
|
Q1:24-25
|
37.9
|
56.2
|
5.9
|
32.0
|
56.4
|
42.5
|
1.1
|
55.3
|
|
Q2:24-25
|
28.5
|
62.8
|
8.7
|
19.8
|
58.8
|
40.0
|
1.2
|
57.6
|
|
Q3:24-25
|
|
|
|
|
51.4
|
47.2
|
1.4
|
50.1
|
|
‘Improve’ in Availability of Finance is optimistic. Footnotes @ and # given in Table S1 are applicable here.
|
|
Table S6: Assessment and Expectation for Cost of Finance
|
|
(Percentage responses)
|
|
Quarter
|
Assessment
|
Expectation
|
|
Increase
|
No Change
|
Decrease
|
Net response
|
Increase
|
No Change
|
Decrease
|
Net response
|
|
Q2:23-24
|
39.0
|
52.1
|
8.9
|
-30.1
|
38.1
|
57.6
|
4.3
|
-33.7
|
|
Q3:23-24
|
36.5
|
59.3
|
4.2
|
-32.3
|
32.8
|
61.0
|
6.2
|
-26.6
|
|
Q4:23-24
|
38.0
|
55.6
|
6.5
|
-31.5
|
38.1
|
58.2
|
3.7
|
-34.4
|
|
Q1:24-25
|
40.0
|
55.1
|
4.9
|
-35.1
|
51.0
|
43.5
|
5.5
|
-45.5
|
|
Q2:24-25
|
36.6
|
59.0
|
4.3
|
-32.3
|
59.4
|
38.0
|
2.6
|
-56.9
|
|
Q3:24-25
|
|
|
|
|
55.9
|
42.5
|
1.6
|
-54.3
|
|
‘Decrease’ in Cost of Finance is optimistic. Footnotes @ and # given in Table S1 are applicable here.
|
|
Table S7: Assessment and Expectation for Salary/Wages
|
|
(Percentage responses)
|
|
Quarter
|
Assessment
|
Expectation
|
|
Increase
|
No Change
|
Decrease
|
Net response
|
Increase
|
No Change
|
Decrease
|
Net response
|
|
Q2:23-24
|
44.5
|
50.3
|
5.3
|
-39.2
|
46.4
|
52.0
|
1.6
|
-44.8
|
|
Q3:23-24
|
42.4
|
53.5
|
4.0
|
-38.4
|
33.6
|
62.3
|
4.1
|
-29.5
|
|
Q4:23-24
|
34.8
|
60.7
|
4.5
|
-30.2
|
38.6
|
59.6
|
1.8
|
-36.8
|
|
Q1:24-25
|
45.3
|
52.0
|
2.7
|
-42.6
|
46.7
|
53.3
|
0.0
|
-46.7
|
|
Q2:24-25
|
29.9
|
66.0
|
4.1
|
-25.8
|
54.5
|
44.9
|
0.7
|
-53.8
|
|
Q3:24-25
|
|
|
|
|
45.0
|
54.5
|
0.5
|
-44.5
|
|
‘Decrease’ in Salary/Wages is optimistic. Footnotes @ and # given in Table S1 are applicable here.
|
|
Table S8: Assessment and Expectation for Cost of Inputs
|
|
(Percentage responses)
|
|
Quarter
|
Assessment
|
Expectation
|
|
Increase
|
No Change
|
Decrease
|
Net response
|
Increase
|
No Change
|
Decrease
|
Net response
|
|
Q2:23-24
|
39.1
|
49.9
|
11.0
|
-28.1
|
47.0
|
46.8
|
6.1
|
-40.9
|
|
Q3:23-24
|
44.6
|
48.6
|
6.8
|
-37.9
|
32.1
|
57.9
|
9.9
|
-22.2
|
|
Q4:23-24
|
46.7
|
49.3
|
4.0
|
-42.8
|
47.4
|
50.9
|
1.7
|
-45.7
|
|
Q1:24-25
|
47.5
|
49.6
|
2.9
|
-44.7
|
57.1
|
42.5
|
0.4
|
-56.7
|
|
Q2:24-25
|
44.4
|
51.8
|
3.8
|
-40.6
|
66.5
|
32.9
|
0.6
|
-65.9
|
|
Q3:24-25
|
|
|
|
|
65.6
|
33.1
|
1.3
|
-64.2
|
|
‘Decrease’ in Cost of Inputs is optimistic. Footnotes @ and # given in Table S1 are applicable here.
|
|
Table S9: Assessment and Expectation for Selling Price
|
|
(Percentage responses)
|
|
Quarter
|
Assessment
|
Expectation
|
|
Increase
|
No Change
|
Decrease
|
Net response
|
Increase
|
No Change
|
Decrease
|
Net response
|
|
Q2:23-24
|
21.9
|
62.7
|
15.4
|
6.5
|
39.5
|
53.7
|
6.8
|
32.7
|
|
Q3:23-24
|
24.3
|
66.6
|
9.2
|
15.1
|
26.4
|
61.5
|
12.1
|
14.2
|
|
Q4:23-24
|
29.9
|
62.6
|
7.5
|
22.4
|
35.3
|
60.0
|
4.7
|
30.7
|
|
Q1:24-25
|
26.9
|
67.9
|
5.2
|
21.7
|
52.4
|
46.0
|
1.6
|
50.8
|
|
Q2:24-25
|
20.5
|
71.1
|
8.4
|
12.1
|
55.5
|
43.2
|
1.4
|
54.1
|
|
Q3:24-25
|
|
|
|
|
50.4
|
47.3
|
2.3
|
48.0
|
|
‘Increase’ in Selling Price is optimistic. Footnotes @ and # given in Table S1 are applicable here.
|
|
Table S10: Assessment and Expectation for Profit Margin
|
|
(Percentage responses)
|
|
Quarter
|
Assessment
|
Expectation
|
|
Increase
|
No Change
|
Decrease
|
Net response
|
Increase
|
No Change
|
Decrease
|
Net response
|
|
Q2:23-24
|
26.3
|
51.8
|
22.0
|
4.3
|
50.3
|
40.6
|
9.1
|
41.2
|
|
Q3:23-24
|
27.1
|
55.5
|
17.4
|
9.7
|
27.3
|
59.2
|
13.5
|
13.8
|
|
Q4:23-24
|
29.6
|
57.0
|
13.3
|
16.3
|
36.1
|
55.2
|
8.6
|
27.5
|
|
Q1:24-25
|
26.5
|
57.5
|
16.0
|
10.5
|
50.6
|
45.1
|
4.2
|
46.4
|
|
Q2:24-25
|
21.0
|
62.1
|
16.8
|
4.2
|
49.6
|
46.3
|
4.2
|
45.4
|
|
Q3:24-25
|
|
|
|
|
42.3
|
53.7
|
3.9
|
38.4
|
|
‘Increase’ in Profit Margin is optimistic. Footnotes @ and # given in Table S1 are applicable here.
|
|
Table S11: Assessment and Expectation for Inventories
|
|
(Percentage responses)
|
|
Quarter
|
Assessment
|
Expectation
|
|
Increase
|
No Change
|
Decrease
|
Net response
|
Increase
|
No Change
|
Decrease
|
Net response
|
|
Q2:23-24
|
30.2
|
56.2
|
13.6
|
16.5
|
40.3
|
54.3
|
5.4
|
34.8
|
|
Q3:23-24
|
29.6
|
62.9
|
7.5
|
22.2
|
34.5
|
53.9
|
11.6
|
22.9
|
|
Q4:23-24
|
32.2
|
60.9
|
6.9
|
25.4
|
34.2
|
60.0
|
5.8
|
28.3
|
|
Q1:24-25
|
31.2
|
62.0
|
6.9
|
24.3
|
50.9
|
45.9
|
3.2
|
47.8
|
|
Q2:24-25
|
24.5
|
69.4
|
6.1
|
18.4
|
54.3
|
43.4
|
2.3
|
52.0
|
|
Q3:24-25
|
|
|
|
|
47.7
|
51.3
|
1.1
|
46.6
|
|
‘Increase’ in Inventories is optimistic. Footnotes @ and # given in Table S1 are applicable here.
|
|
Table S12: Assessment and Expectation for Technical/Service Capacity
|
|
(Percentage responses)
|
|
Quarter
|
Assessment
|
Expectation
|
|
Increase
|
No Change
|
Decrease
|
Net response
|
Increase
|
No Change
|
Decrease
|
Net response
|
|
Q2:23-24
|
28.1
|
69.2
|
2.7
|
25.3
|
51.2
|
47.5
|
1.3
|
49.8
|
|
Q3:23-24
|
22.6
|
75.8
|
1.6
|
21.0
|
41.9
|
56.3
|
1.9
|
40.0
|
|
Q4:23-24
|
29.1
|
66.2
|
4.8
|
24.3
|
34.1
|
65.9
|
0.0
|
34.1
|
|
Q1:24-25
|
29.4
|
67.4
|
3.2
|
26.2
|
54.7
|
45.3
|
0.0
|
54.7
|
|
Q2:24-25
|
23.0
|
72.5
|
4.5
|
18.5
|
57.2
|
42.5
|
0.2
|
57.0
|
|
Q3:24-25
|
|
|
|
|
58.6
|
41.1
|
0.3
|
58.3
|
|
‘Increase’ in Technical/Service Capacity is optimistic. Footnotes @ and # given in Table S1 are applicable here.
|
|
Table S13: Assessment and Expectation for Physical Investment
|
|
(Percentage responses)
|
|
Quarter
|
Assessment
|
Expectation
|
|
Increase
|
No Change
|
Decrease
|
Net response
|
Increase
|
No Change
|
Decrease
|
Net response
|
|
Q2:23-24
|
30.7
|
66.1
|
3.1
|
27.6
|
43.4
|
54.8
|
1.8
|
41.5
|
|
Q3:23-24
|
21.7
|
76.6
|
1.6
|
20.1
|
23.3
|
75.8
|
0.9
|
22.3
|
|
Q4:23-24
|
28.0
|
66.7
|
5.3
|
22.6
|
32.2
|
67.8
|
0.0
|
32.2
|
|
Q1:24-25
|
27.4
|
69.3
|
3.2
|
24.2
|
53.8
|
45.7
|
0.5
|
53.2
|
|
Q2:24-25
|
21.6
|
72.9
|
5.5
|
16.1
|
55.7
|
44.1
|
0.3
|
55.4
|
|
Q3:24-25
|
|
|
|
|
57.0
|
42.7
|
0.3
|
56.7
|
|
‘Increase’ in Physical Investment is optimistic. Footnotes @ and # given in Table S1 are applicable here.
|
| Table S14: Estimated Spare Capacity for the Services Sector |
Survey conducted during |
Reference quarter
|
Response rate for the question on Spare Capacity
(per cent)
|
Spare Capacity
(per cent)
|
|
Q4:2020-21
|
Q3:2020-21
|
73.4
|
13.9
|
|
Q1:2021-22
|
Q4:2020-21
|
25.0
|
13.3
|
|
Q2:2021-22
|
Q1:2021-22
|
69.3
|
24.8
|
|
Q3:2021-22
|
Q2:2021-22
|
64.4
|
11.1
|
|
Q4:2021-22
|
Q3:2021-22
|
40.8
|
13.0
|
|
Q1:2022-23
|
Q4:2021-22
|
58.3
|
17.4
|
|
Q2:2022-23
|
Q1:2022-23
|
79.5
|
13.5
|
|
Q3:2022-23
|
Q2:2022-23
|
25.2
|
12.6
|
|
Q4:2022-23
|
Q3:2022-23
|
63.0
|
13.8
|
|
Q1:2023-24
|
Q4:2022-23
|
79.8
|
13.6
|
|
Q2:2023-24
|
Q1:2023-24
|
84.3
|
12.3
|
|
Q3:2023-24
|
Q2:2023-24
|
74.0
|
11.8
|
|
Q4:2023-24
|
Q3:2023-24
|
74.8
|
11.7
|
|
Q1:2024-25
|
Q4:2023-24
|
78.8
|
11.3
|
|
Q2:2024-25
|
Q1:2024-25
|
71.5
|
11.2
|
Infrastructure Sector
|
Table I1: Assessment and Expectation for Overall Business Situation
|
|
(Percentage responses)@
|
|
Quarter
|
Assessment
|
Expectation
|
|
Better
|
No Change
|
Worse
|
Net response#
|
Better
|
No Change
|
Worse
|
Net response
|
|
Q2:23-24
|
44.2
|
41.3
|
14.4
|
29.8
|
62.6
|
30.8
|
6.6
|
56.0
|
|
Q3:23-24
|
44.2
|
45.8
|
10.0
|
34.2
|
67.3
|
29.8
|
2.9
|
64.4
|
|
Q4:23-24
|
45.0
|
42.5
|
12.5
|
32.5
|
73.1
|
21.8
|
5.0
|
68.1
|
|
Q1:24-25
|
37.7
|
51.3
|
11.0
|
26.6
|
70.3
|
25.4
|
4.2
|
66.1
|
|
Q2:24-25
|
38.4
|
44.9
|
16.7
|
21.7
|
76.5
|
21.6
|
2.0
|
74.5
|
|
Q3:24-25
|
|
|
|
|
70.3
|
26.8
|
2.9
|
67.4
|
|
‘Increase’ in Overall business situation is optimistic.
@: Due to rounding off percentage may not add up to 100.
#: Net Response (NR) is the difference of percentage of the respondents reporting optimism and that reporting pessimism. The range is -100 to 100. Any value greater than zero indicates expansion/ optimism and any value less than zero indicates contraction/ pessimism.
|
|
Table I2: Assessment and Expectation for Turnover
|
|
(Percentage responses)
|
|
Quarter
|
Assessment
|
Expectation
|
|
Increase
|
No Change
|
Decrease
|
Net response
|
Increase
|
No Change
|
Decrease
|
Net response
|
|
Q2:23-24
|
46.2
|
39.4
|
14.4
|
31.7
|
61.1
|
33.3
|
5.6
|
55.6
|
|
Q3:23-24
|
47.9
|
40.3
|
11.8
|
36.1
|
53.8
|
42.3
|
3.8
|
50.0
|
|
Q4:23-24
|
42.5
|
42.5
|
15.0
|
27.5
|
75.6
|
22.7
|
1.7
|
73.9
|
|
Q1:24-25
|
37.7
|
51.3
|
11.0
|
26.6
|
68.4
|
24.8
|
6.8
|
61.5
|
|
Q2:24-25
|
41.3
|
42.8
|
15.9
|
25.4
|
73.2
|
23.5
|
3.3
|
69.9
|
|
Q3:24-25
|
|
|
|
|
73.2
|
24.6
|
2.2
|
71.0
|
|
‘Increase’ in Turnover is optimistic. Footnotes @ and # given in Table I1 are applicable here.
|
|
Table I3: Assessment and Expectation for Full-time Employees
|
|
(Percentage responses)
|
|
Quarter
|
Assessment
|
Expectation
|
|
Increase
|
No Change
|
Decrease
|
Net response
|
Increase
|
No Change
|
Decrease
|
Net response
|
|
Q2:23-24
|
28.8
|
58.7
|
12.5
|
16.3
|
48.9
|
48.9
|
2.2
|
46.7
|
|
Q3:23-24
|
32.5
|
57.3
|
10.3
|
22.2
|
42.3
|
54.8
|
2.9
|
39.4
|
|
Q4:23-24
|
27.5
|
65.0
|
7.5
|
20.0
|
63.2
|
34.2
|
2.6
|
60.7
|
|
Q1:24-25
|
31.2
|
59.1
|
9.7
|
21.4
|
47.5
|
51.7
|
0.8
|
46.6
|
|
Q2:24-25
|
28.3
|
61.6
|
10.1
|
18.1
|
64.7
|
33.3
|
2.0
|
62.7
|
|
Q3:24-25
|
|
|
|
|
41.5
|
56.3
|
2.2
|
39.3
|
|
‘Increase’ in Full-time Employees is optimistic. Footnotes @ and # given in Table I1 are applicable here.
|
|
Table I4: Assessment and Expectation for Part-time Employees
|
|
(Percentage responses)
|
|
Quarter
|
Assessment
|
Expectation
|
|
Increase
|
No Change
|
Decrease
|
Net response
|
Increase
|
No Change
|
Decrease
|
Net response
|
|
Q2:23-24
|
37.9
|
55.2
|
6.9
|
31.0
|
50.9
|
45.3
|
3.8
|
47.2
|
|
Q3:23-24
|
35.8
|
57.5
|
6.6
|
29.2
|
60.3
|
34.5
|
5.2
|
55.2
|
|
Q4:23-24
|
29.2
|
66.3
|
4.5
|
24.7
|
68.3
|
31.7
|
0.0
|
68.3
|
|
Q1:24-25
|
32.8
|
59.9
|
7.3
|
25.5
|
55.8
|
41.9
|
2.3
|
53.5
|
|
Q2:24-25
|
21.5
|
66.7
|
11.8
|
9.7
|
63.7
|
33.3
|
3.0
|
60.7
|
|
Q3:24-25
|
|
|
|
|
54.3
|
40.2
|
5.4
|
48.9
|
|
‘Increase’ in Part-time Employees is optimistic. Footnotes @ and # given in Table I1 are applicable here.
|
|
Table I5: Assessment and Expectation for Availability of Finance
|
|
(Percentage responses)
|
|
Quarter
|
Assessment
|
Expectation
|
|
Improve
|
No Change
|
Worsen
|
Net response
|
Improve
|
No Change
|
Worsen
|
Net response
|
|
Q2:23-24
|
36.5
|
52.9
|
10.6
|
26.0
|
51.1
|
43.3
|
5.6
|
45.6
|
|
Q3:23-24
|
36.7
|
57.5
|
5.8
|
30.8
|
46.6
|
49.5
|
3.9
|
42.7
|
|
Q4:23-24
|
34.7
|
58.5
|
6.8
|
28.0
|
63.0
|
35.3
|
1.7
|
61.3
|
|
Q1:24-25
|
35.1
|
59.1
|
5.8
|
29.2
|
58.6
|
40.5
|
0.9
|
57.8
|
|
Q2:24-25
|
31.4
|
55.5
|
13.1
|
18.2
|
68.0
|
32.0
|
0.0
|
68.0
|
|
Q3:24-25
|
|
|
|
|
55.1
|
44.1
|
0.7
|
54.4
|
|
‘Improve’ in Availability of Finance is optimistic. Footnotes @ and # given in Table I1 are applicable here.
|
|
Table I6: Assessment and Expectation for Cost of Finance
|
|
(Percentage responses)
|
|
Quarter
|
Assessment
|
Expectation
|
|
Increase
|
No Change
|
Decrease
|
Net response
|
Increase
|
No Change
|
Decrease
|
Net response
|
|
Q2:23-24
|
51.0
|
42.7
|
6.3
|
-44.8
|
44.0
|
53.6
|
2.4
|
-41.7
|
|
Q3:23-24
|
38.2
|
55.5
|
6.4
|
-31.8
|
54.2
|
45.8
|
0.0
|
-54.2
|
|
Q4:23-24
|
35.2
|
61.1
|
3.7
|
-31.5
|
61.7
|
37.4
|
0.9
|
-60.7
|
|
Q1:24-25
|
36.4
|
56.3
|
7.3
|
-29.1
|
60.4
|
38.7
|
0.9
|
-59.4
|
|
Q2:24-25
|
38.3
|
50.0
|
11.7
|
-26.6
|
65.1
|
32.2
|
2.7
|
-62.4
|
|
Q3:24-25
|
|
|
|
|
63.5
|
33.3
|
3.2
|
-60.3
|
|
‘Decrease’ in Cost of Finance is optimistic. Footnotes @ and # given in Table I1 are applicable here.
|
|
Table I7: Assessment and Expectation for Salary/Wages
|
|
(Percentage responses)
|
|
Quarter
|
Assessment
|
Expectation
|
|
Increase
|
No Change
|
Decrease
|
Net response
|
Increase
|
No Change
|
Decrease
|
Net response
|
|
Q2:23-24
|
42.7
|
50.5
|
6.8
|
-35.9
|
47.8
|
52.2
|
0.0
|
-47.8
|
|
Q3:23-24
|
44.9
|
50.8
|
4.2
|
-40.7
|
41.2
|
56.9
|
2.0
|
-39.2
|
|
Q4:23-24
|
27.7
|
70.6
|
1.7
|
-26.1
|
59.8
|
39.3
|
0.9
|
-59.0
|
|
Q1:24-25
|
38.3
|
57.8
|
3.9
|
-34.4
|
55.2
|
44.8
|
0.0
|
-55.2
|
|
Q2:24-25
|
31.9
|
63.0
|
5.1
|
-26.8
|
70.6
|
29.4
|
0.0
|
-70.6
|
|
Q3:24-25
|
|
|
|
|
43.1
|
56.9
|
0.0
|
-43.1
|
|
‘Decrease’ in Salary/Wages is optimistic. Footnotes @ and # given in Table I1 are applicable here.
|
|
Table I8: Assessment and Expectation for Cost of Inputs
|
|
(Percentage responses)
|
|
Quarter
|
Assessment
|
Expectation
|
|
Increase
|
No Change
|
Decrease
|
Net response
|
Increase
|
No Change
|
Decrease
|
Net response
|
|
Q2:23-24
|
50.0
|
45.1
|
4.9
|
-45.1
|
51.1
|
44.3
|
4.5
|
-46.6
|
|
Q3:23-24
|
52.1
|
43.6
|
4.3
|
-47.9
|
52.0
|
41.0
|
7.0
|
-45.0
|
|
Q4:23-24
|
52.6
|
43.9
|
3.5
|
-49.1
|
59.1
|
37.4
|
3.5
|
-55.7
|
|
Q1:24-25
|
42.2
|
51.7
|
6.1
|
-36.1
|
63.4
|
36.6
|
0.0
|
-63.4
|
|
Q2:24-25
|
49.2
|
42.3
|
8.5
|
-40.8
|
75.9
|
23.4
|
0.7
|
-75.2
|
|
Q3:24-25
|
|
|
|
|
70.8
|
29.2
|
0.0
|
-70.8
|
|
‘Decrease’ in Cost of Inputs is optimistic. Footnotes @ and # given in Table I1 are applicable here.
|
|
Table I9: Assessment and Expectation for Selling Price
|
|
(Percentage responses)
|
|
Quarter
|
Assessment
|
Expectation
|
|
Increase
|
No Change
|
Decrease
|
Net response
|
Increase
|
No Change
|
Decrease
|
Net response
|
|
Q2:23-24
|
33.7
|
53.3
|
13.0
|
20.7
|
43.4
|
54.2
|
2.4
|
41.0
|
|
Q3:23-24
|
37.0
|
54.0
|
9.0
|
28.0
|
42.4
|
53.3
|
4.3
|
38.0
|
|
Q4:23-24
|
28.9
|
61.1
|
10.0
|
18.9
|
62.0
|
36.0
|
2.0
|
60.0
|
|
Q1:24-25
|
30.8
|
60.0
|
9.2
|
21.5
|
60.7
|
33.7
|
5.6
|
55.1
|
|
Q2:24-25
|
24.5
|
61.8
|
13.6
|
10.9
|
69.8
|
27.1
|
3.1
|
66.7
|
|
Q3:24-25
|
|
|
|
|
52.7
|
44.5
|
2.7
|
50.0
|
|
‘Increase’ in Selling Price is optimistic. Footnotes @ and # given in Table I1 are applicable here.
|
|
Table I10: Assessment and Expectation for Profit Margin
|
|
(Percentage responses)
|
|
Quarter
|
Assessment
|
Expectation
|
|
Increase
|
No Change
|
Decrease
|
Net response
|
Increase
|
No Change
|
Decrease
|
Net response
|
|
Q2:23-24
|
24.5
|
58.8
|
16.7
|
7.8
|
46.1
|
48.3
|
5.6
|
40.4
|
|
Q3:23-24
|
35.0
|
55.0
|
10.0
|
25.0
|
37.3
|
56.9
|
5.9
|
31.4
|
|
Q4:23-24
|
26.1
|
56.3
|
17.6
|
8.4
|
56.3
|
36.1
|
7.6
|
48.7
|
|
Q1:24-25
|
28.6
|
59.7
|
11.7
|
16.9
|
54.7
|
38.5
|
6.8
|
47.9
|
|
Q2:24-25
|
26.8
|
52.2
|
21.0
|
5.8
|
65.1
|
31.6
|
3.3
|
61.8
|
|
Q3:24-25
|
|
|
|
|
45.7
|
49.3
|
5.1
|
40.6
|
|
‘Increase’ in Profit Margin is optimistic. Footnotes @ and # given in Table I1 are applicable here.
|
|
Table I11: Assessment and Expectation for Inventories
|
|
(Percentage responses)
|
|
Quarter
|
Assessment
|
Expectation
|
|
Increase
|
No Change
|
Decrease
|
Net response
|
Increase
|
No Change
|
Decrease
|
Net response
|
|
Q2:23-24
|
42.1
|
52.6
|
5.3
|
36.8
|
36.7
|
60.0
|
3.3
|
33.3
|
|
Q3:23-24
|
41.7
|
53.4
|
4.9
|
36.9
|
60.5
|
36.8
|
2.6
|
57.9
|
|
Q4:23-24
|
34.0
|
62.1
|
3.9
|
30.1
|
75.2
|
23.8
|
1.0
|
74.3
|
|
Q1:24-25
|
34.8
|
59.4
|
5.8
|
29.0
|
58.0
|
39.0
|
3.0
|
55.0
|
|
Q2:24-25
|
30.4
|
59.8
|
9.8
|
20.5
|
71.5
|
27.0
|
1.5
|
70.1
|
|
Q3:24-25
|
|
|
|
|
59.1
|
38.2
|
2.7
|
56.4
|
|
‘Increase’ in Inventories is optimistic. Footnotes @ and # given in Table I1 are applicable here.
|
|
Table I12: Assessment and Expectation for Technical/Service Capacity
|
|
(Percentage responses)
|
|
Quarter
|
Assessment
|
Expectation
|
|
Increase
|
No Change
|
Decrease
|
Net response
|
Increase
|
No Change
|
Decrease
|
Net response
|
|
Q2:23-24
|
38.3
|
59.6
|
2.1
|
36.2
|
51.2
|
48.8
|
0.0
|
51.2
|
|
Q3:23-24
|
39.8
|
55.9
|
4.3
|
35.5
|
66.7
|
33.3
|
0.0
|
66.7
|
|
Q4:23-24
|
32.5
|
64.9
|
2.6
|
29.9
|
75.0
|
25.0
|
0.0
|
75.0
|
|
Q1:24-25
|
36.2
|
59.5
|
4.3
|
31.9
|
66.2
|
32.4
|
1.4
|
64.9
|
|
Q2:24-25
|
30.9
|
57.4
|
11.8
|
19.1
|
79.1
|
20.9
|
0.0
|
79.1
|
|
Q3:24-25
|
|
|
|
|
72.5
|
27.5
|
0.0
|
72.5
|
|
‘Increase’ in Technical/Service Capacity is optimistic. Footnotes @ and # given in Table I1 are applicable here.
|
|
Table I13: Assessment and Expectation for Physical Investment
|
|
(Percentage responses)
|
|
Quarter
|
Assessment
|
Expectation
|
|
Increase
|
No Change
|
Decrease
|
Net response
|
Increase
|
No Change
|
Decrease
|
Net response
|
|
Q2:23-24
|
38.0
|
58.2
|
3.8
|
34.2
|
36.8
|
60.3
|
2.9
|
33.8
|
|
Q3:23-24
|
35.8
|
60.0
|
4.2
|
31.6
|
46.8
|
53.2
|
0.0
|
46.8
|
|
Q4:23-24
|
28.6
|
68.8
|
2.6
|
26.0
|
75.3
|
24.7
|
0.0
|
75.3
|
|
Q1:24-25
|
33.1
|
61.2
|
5.8
|
27.3
|
64.0
|
36.0
|
0.0
|
64.0
|
|
Q2:24-25
|
36.5
|
52.7
|
10.8
|
25.7
|
75.8
|
24.2
|
0.0
|
75.8
|
|
Q3:24-25
|
|
|
|
|
75.3
|
24.7
|
0.0
|
75.3
|
|
‘Increase’ in Physical Investment is optimistic. Footnotes @ and # given in Table I1 are applicable here.
|
[1] सर्वेक्षण के परिणाम उत्तरदाताओं के विचारों को दर्शाते हैं, जिन्हें आवश्यक रूप से रिज़र्व बैंक द्वारा साझा नहीं किया जाता है।
[2] पिछले सर्वेक्षण दौर के परिणाम 08 अगस्त 2024को बैंक की वेबसाइट पर जारी किए गए।
[3] Net Response (NR) is the difference between the percentage of respondents reporting optimism and those reporting pessimism. It ranges between -100 to 100. Positive value indicates expansion/optimism and negative value indicates contraction/pessimism. In other words, NR = (I – D); where, I is the percentage response of ‘Increase/optimism’, D is the percentage response of ‘Decrease/pessimism’ and E is the percentage response as ‘no change/ equal’ (i.e., I+D+E=100). For example, increase in turnover is optimism whereas decrease in cost of inputs is optimism.
|
 IST,
IST,