उपभोक्ता विश्वास सर्वेक्षण
आज, रिज़र्व बैंक ने अपने द्विमासिक उपभोक्ता विश्वास सर्वेक्षण (सीसीएस)1 के मई 2023 दौर के परिणाम जारी किए। सर्वेक्षण में 19 प्रमुख शहरों में सामान्य आर्थिक स्थिति, रोजगार परिदृश्य, समग्र मूल्य स्थिति और स्वयं की आय और व्यय पर वर्तमान धारणाएं (एक साल पहले की तुलना में) और एक वर्ष आगे की अपेक्षाएं प्राप्त की गई हैं। सर्वेक्षण का नवीनतम दौर 2-11 मई, 2023 के दौरान आयोजित किया गया था, जिसमें 6,089 उत्तरदाताओं को शामिल किया गया था। इस सर्वेक्षण में महिला उत्तरदाताओं का 52.3 प्रतिशत हिस्सा रहा है। मुख्य विशेषताएं: -
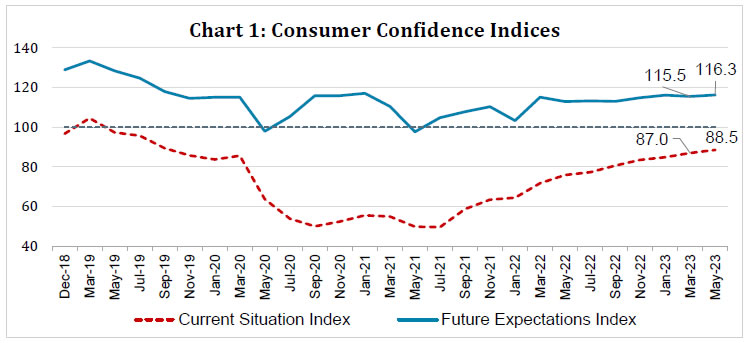
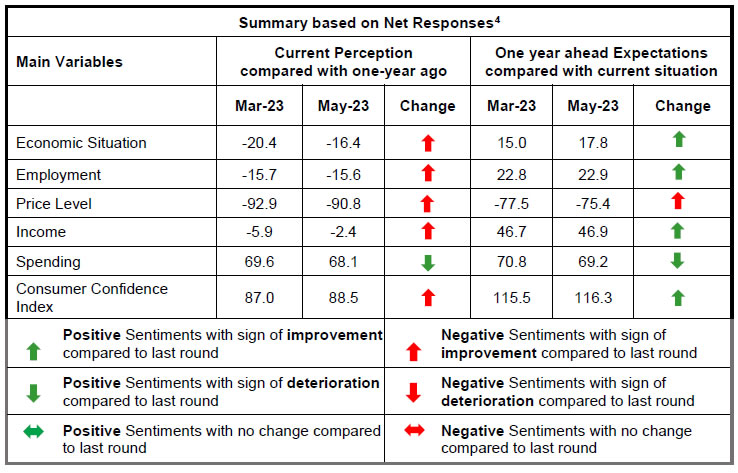
एक साल पहले की तुलना में वर्तमान अवधि के लिए उपभोक्ता विश्वास कोविड-19 महामारी की दूसरी लहर के बाद से बढ़ रहा है; आवश्यक व्यय को छोड़कर, सर्वेक्षण के सभी मापदंडों के लिए बेहतर मूल्यांकन की वजह से पिछले सर्वेक्षण दौर से वर्तमान स्थिति सूचकांक (सीएसआई)2 में 1.5 अंकों का और सुधार हुआ है (चार्ट 1, तालिका 1, 3 और 5)। -
उत्तरदाता आने वाले वर्ष में सामान्य आर्थिक स्थिति पर आशावादी बने हुए हैं। नवीनतम सर्वेक्षण दौर में भविष्य की उम्मीदों के सूचकांक (एफईआई) में भी मामूली सुधार हुआ है (चार्ट 1, तालिका 1 और 3)। -
सितंबर 2022 से सामान्य आर्थिक स्थिति पर परिवारों की वर्तमान धारणा में लगातार सुधार हो रहा है; मार्च 2023 में मामूली गिरावट के बावजूद उनका एक साल आगे का दृष्टिकोण भी ऊपर की ओर बना हुआ है (तालिका 1)। -
मई 2023 में पर्याप्त सुधार के साथ, वर्तमान आय पर परिवारों की भावना तटस्थ क्षेत्र के करीब पहुंच गई और वे अगले एक वर्ष में रोजगार की स्थिति और भविष्य की कमाई को लेकर काफी आशावादी बने हुए हैं। (तालिका 2 और 5)। नोट: कृपया समय श्रृंखला डेटा के लिए एक्सेल फ़ाइल देखें3
| Table 1: Perceptions and Expectations on the General Economic Situation | | (Percentage responses) | | Survey Round | Current Perception | One year ahead Expectation | | Improved | Remained Same | Worsened | Net Response | Will Improve | Will Remain Same | Will Worsen | Net Response | | May-22 | 22.5 | 14.9 | 62.7 | -40.2 | 45.4 | 15.3 | 39.4 | 6.0 | | Jul-22 | 21.6 | 15.4 | 63.0 | -41.5 | 46.4 | 14.9 | 38.8 | 7.6 | | Sep-22 | 26.2 | 14.6 | 59.2 | -33.0 | 46.5 | 15.4 | 38.1 | 8.4 | | Nov-22 | 28.0 | 16.3 | 55.7 | -27.8 | 48.0 | 15.6 | 36.4 | 11.6 | | Jan-23 | 28.3 | 19.6 | 52.1 | -23.7 | 50.2 | 16.6 | 33.2 | 17.0 | | Mar-23 | 31.4 | 16.9 | 51.7 | -20.4 | 49.9 | 15.1 | 35.0 | 15.0 | | May-23 | 32.1 | 19.0 | 48.9 | -16.8 | 51.0 | 15.8 | 33.2 | 17.8 |
| Table 2: Perceptions and Expectations on Employment | | (Percentage responses) | | Survey Round | Current Perception | One year ahead Expectation | | Improved | Remained Same | Worsened | Net Response | Will Improve | Will Remain Same | Will Worsen | Net Response | | May-22 | 27.3 | 17.8 | 54.9 | -27.6 | 51.3 | 16.7 | 32.1 | 19.2 | | Jul-22 | 28.1 | 17.3 | 54.6 | -26.5 | 50.7 | 17.2 | 32.0 | 18.7 | | Sep-22 | 28.4 | 17.6 | 54.0 | -25.7 | 49.4 | 17.3 | 33.3 | 16.1 | | Nov-22 | 31.8 | 18.6 | 49.6 | -17.8 | 51.5 | 18.3 | 30.3 | 21.2 | | Jan-23 | 30.0 | 20.1 | 49.9 | -19.9 | 51.8 | 18.0 | 30.2 | 21.6 | | Mar-23 | 32.2 | 19.9 | 47.9 | -15.7 | 52.9 | 17.1 | 30.1 | 22.8 | | May-23 | 32.1 | 20.2 | 47.7 | -15.6 | 52.1 | 18.7 | 29.2 | 22.9 |
| Table 3: Perceptions and Expectations on Price Level | | (Percentage responses) | | Survey Round | Current Perception | One year ahead Expectation | | Increased | Remained Same | Decreased | Net Response | Will Increase | Will Remain Same | Will Decrease | Net Response | | May-22 | 95.4 | 4.1 | 0.5 | -94.9 | 80.0 | 11.1 | 8.9 | -71.1 | | Jul-22 | 95.2 | 4.0 | 0.9 | -94.3 | 80.4 | 10.9 | 8.8 | -71.6 | | Sep-22 | 94.6 | 4.3 | 1.1 | -93.6 | 79.9 | 11.0 | 9.1 | -70.8 | | Nov-22 | 94.9 | 4.1 | 1.0 | -93.9 | 82.2 | 9.3 | 8.6 | -73.6 | | Jan-23 | 93.6 | 5.0 | 1.3 | -92.3 | 83.0 | 10.1 | 7.0 | -76.1 | | Mar-23 | 93.8 | 5.2 | 1.0 | -92.9 | 84.3 | 9.0 | 6.7 | -77.5 | | May-23 | 92.2 | 6.4 | 1.4 | -90.8 | 82.7 | 10.0 | 7.3 | -75.4 |
| Table 4: Perceptions and Expectations on Rate of Change in Price Level (Inflation)* | | (Percentage responses) | | Survey Round | Current Perception | One year ahead Expectation | | Increased | Remained Same | Decreased | Net Response | Will Increase | Will Remain Same | Will Decrease | Net Response | | May-22 | 91.3 | 7.0 | 1.7 | -89.7 | 81.7 | 14.2 | 4.1 | -77.6 | | Jul-22 | 88.5 | 8.9 | 2.6 | -85.9 | 81.8 | 13.6 | 4.6 | -77.3 | | Sep-22 | 89.6 | 7.8 | 2.6 | -87.0 | 80.6 | 14.5 | 4.9 | -75.7 | | Nov-22 | 87.5 | 9.2 | 3.3 | -84.2 | 82.9 | 13.2 | 3.9 | -79.1 | | Jan-23 | 86.5 | 10.5 | 3.0 | -83.6 | 80.3 | 15.5 | 4.1 | -76.2 | | Mar-23 | 86.5 | 10.0 | 3.5 | -82.9 | 81.4 | 14.0 | 4.6 | -76.8 | | May-23 | 84.0 | 12.5 | 3.4 | -80.6 | 81.8 | 14.1 | 4.1 | -77.8 | | *Applicable only for those respondents who felt price has increased/price will increase. |
| Table 5: Perceptions and Expectations on Income | | (Percentage responses) | | Survey Round | Current Perception | One year ahead Expectation | | Increased | Remained Same | Decreased | Net Response | Will Increase | Will Remain Same | Will Decrease | Net Response | | May-22 | 17.6 | 46.0 | 36.4 | -18.9 | 52.4 | 39.2 | 8.4 | 44.0 | | Jul-22 | 18.2 | 46.0 | 35.9 | -17.7 | 51.6 | 40.0 | 8.4 | 43.3 | | Sep-22 | 20.2 | 45.5 | 34.4 | -14.2 | 51.3 | 39.8 | 8.9 | 42.4 | | Nov-22 | 20.9 | 46.1 | 32.9 | -12.0 | 52.5 | 39.9 | 7.6 | 44.9 | | Jan-23 | 21.4 | 49.0 | 29.6 | -8.3 | 54.5 | 38.7 | 6.9 | 47.6 | | Mar-23 | 22.2 | 49.7 | 28.1 | -5.9 | 54.1 | 38.4 | 7.5 | 46.7 | | May-23 | 23.9 | 49.7 | 26.3 | -2.4 | 53.8 | 39.4 | 6.9 | 46.9 |
| Table 6: Perceptions and Expectations on Spending | | (Percentage responses) | | Survey Round | Current Perception | One year ahead Expectation | | Increased | Remained Same | Decreased | Net Response | Will Increase | Will Remain Same | Will Decrease | Net Response | | May-22 | 69.4 | 22.1 | 8.5 | 60.9 | 72.5 | 21.7 | 5.8 | 66.7 | | Jul-22 | 72.6 | 21.1 | 6.3 | 66.3 | 73.0 | 22.4 | 4.6 | 68.3 | | Sep-22 | 75.9 | 17.5 | 6.6 | 69.2 | 74.2 | 20.7 | 5.2 | 69.0 | | Nov-22 | 74.9 | 19.2 | 5.9 | 69.0 | 75.0 | 20.3 | 4.7 | 70.2 | | Jan-23 | 73.9 | 20.6 | 5.5 | 68.4 | 75.5 | 19.8 | 4.7 | 70.8 | | Mar-23 | 75.0 | 19.6 | 5.4 | 69.6 | 75.4 | 19.9 | 4.6 | 70.8 | | May-23 | 73.4 | 21.3 | 5.3 | 68.1 | 73.8 | 21.7 | 4.6 | 69.2 |
| Table 7: Perceptions and Expectations on Spending- Essential Items | | (Percentage responses) | | Survey Round | Current Perception | One year ahead Expectation | | Increased | Remained Same | Decreased | Net Response | Will Increase | Will Remain Same | Will Decrease | Net Response | | May-22 | 81.7 | 12.8 | 5.5 | 76.2 | 79.9 | 15.7 | 4.4 | 75.4 | | Jul-22 | 82.0 | 13.7 | 4.3 | 77.7 | 80.0 | 16.5 | 3.6 | 76.4 | | Sep-22 | 85.2 | 10.7 | 4.1 | 81.1 | 80.9 | 15.4 | 3.7 | 77.3 | | Nov-22 | 84.7 | 11.6 | 3.7 | 81.0 | 81.1 | 15.4 | 3.5 | 77.7 | | Jan-23 | 84.1 | 12.3 | 3.6 | 80.5 | 81.3 | 15.2 | 3.5 | 77.8 | | Mar-23 | 85.3 | 11.5 | 3.2 | 82.1 | 81.7 | 14.8 | 3.5 | 78.2 | | May-23 | 84.0 | 12.8 | 3.2 | 80.8 | 81.3 | 15.2 | 3.5 | 77.8 |
| Table 8: Perceptions and Expectations on Spending- Non-Essential Items | | (Percentage responses) | | Survey Round | Current Perception | One year ahead Expectation | | Increased | Remained Same | Decreased | Net Response | Will Increase | Will Remain Same | Will Decrease | Net Response | | May-22 | 16.6 | 34.1 | 49.3 | -32.7 | 27.5 | 38.4 | 34.1 | -6.6 | | Jul-22 | 18.7 | 35.9 | 45.5 | -26.8 | 29.3 | 38.5 | 32.2 | -2.9 | | Sep-22 | 20.9 | 32.5 | 46.7 | -25.8 | 29.5 | 37.6 | 33.0 | -3.6 | | Nov-22 | 22.4 | 33.8 | 43.8 | -21.4 | 32.8 | 35.1 | 32.2 | 0.6 | | Jan-23 | 22.1 | 35.2 | 42.8 | -20.7 | 31.9 | 38.4 | 29.8 | 2.1 | | Mar-23 | 25.2 | 34.8 | 40.0 | -14.8 | 34.5 | 36.8 | 28.8 | 5.7 | | May-23 | 25.8 | 38.2 | 36.1 | -10.3 | 35.3 | 37.5 | 27.2 | 8.2 |
|
 IST,
IST,