 IST,
IST,


I Overview
Macroeconomic Developments: 1999-2000
1.1 The financial sector in the Indian economy is undergoing a transformation towards a vibrant, competitive and diversified system, with a multiplicity of financial institutions having different risk profiles intermediating in various segments of the market spectrum. The development of financial markets is a critical element in the agenda of financial sector reforms in India. Macroeconomic policy formulation has imbibed a market orientation to reap the efficiencies associated with the functioning of markets. With the liberalisation of financial markets, policy authorities in India have also had to contend with episodes of financial volatility. Recognising the strong complementarity between financial stability and macroeconomic stability, the operational settings for policies are being geared to dampen excessive volatility and the possible impairment of the ability of financial institutions to handle fluctuations in financial asset prices. Current macroeconomic and financial developments in the Indian economy highlight the evolving role of the financial sector in the functioning of the economy and the growing integration across financial markets.
1.2 During 1999-2000, the Indian economy faced testing challenges on several fronts, which had a bearing on macroeconomic performance. While both global output and trade accelerated in 1999, this growth was lop-sided, driven primarily by the continuing strength of the US economy and the sharp recovery of the Asian economies. The gains from the rebound in global economic activity were considerably eroded by the more than doubling of oil prices during 1999 itself on account of production curbs by the Organisation of the Petroleum Exporting Countries (OPEC). For oil importing developing countries, including India, the oil price surge translated into inflationary pressures, sharp increases in oil import payments and constriction of import puchasing power. The lack of sufficient demand 'pull' characterising the phase of the business cycle through which the domestic economy is transiting, restrained the impulses for accelerating growth. Slippages in budgets of both the Centre and States kept the public sector borrowing requirement high, necessitating tactical conduct of monetary policy in pursuit of a low and stable interest rate regime in support of growth.
1.3 Notwithstanding these challenges, macroeconomic performance continued to be robust in 1999-2000. Overall economic growth, measured in terms of GDP at factor cost at constant prices, was estimated at 6.4 per cent, a little lower than that of 6.8 per cent in the preceding year, but well above the growth rates recorded for the developing countries as a group and even for the emerging market economies of Asia. Moreover, India's growth performance occurred in a stable environment, accompanied, as it were, by average WPI inflation receding to 3.3 per cent from 5.9 per cent in 1998-99, the current account deficit narrowing to less than 1 per cent of GDP, a decline in the external debt/ GDP and debt servicing ratios, a stable exchange rate, orderly financial markets, comfortable food stocks which were well above the minimum buffer stock norms throughout the year and foreign exchange reserves equivalent to over 8 months of imports.
The Real Sector
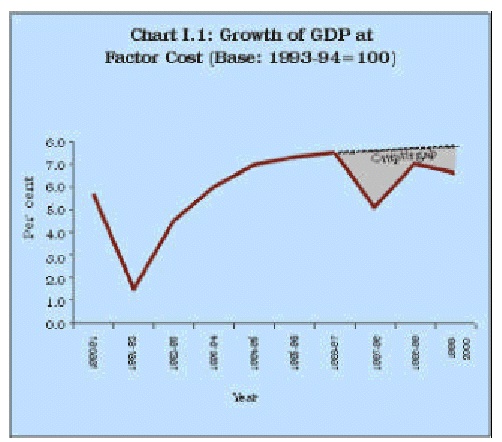
1.4 The Indian economy has undergone significant shifts in the pace of economic growth during the 1990s. A V-shaped recovery from the balance of payments crisis of 1990-91 was followed by a phase of uninterrupted expansion at the average rate of 7.0 per cent per annum during 1993-97. In the following years, this was not sustained and real GDP growth exhibited a moderate degree of variability during the period 1997-2000. As a consequence, even as real GDP growth at 6.4 per cent in 1999-2000 equalled the average achieved in the 1990s (excluding 1991-92, the year of adjustment), an output gap has emerged in terms of the growth rate achieved on a prolonged basis in the preceding period (Chart I.1). Closing the output gap has been the dominant concern driving the deployment of macro-economic policies.
1.5 The principal factor holding down GDP growth from reaching its potential is the halting recovery of aggregate demand. Underlying, and closely co-moving with the variability of output growth is the variability of the rate of gross domestic investment, particularly after reaching a peak of 27.1 per cent in 1995-96, the centre of the high growth phase. Although information on investment activity for 1999-2000 is not yet available, the behaviour of the investment rate can be gauged from indications relating to the movement of its financing components i.e., the gross domestic saving and the net inflow of resources from abroad. In 1999-2000, the rate of financial saving of households is estimated to have dipped to 10.6 per cent of GDP from 10.8 per cent in 1998-99, reversing a trend which was emerging since 1995-96. Fiscal slippages would have resulted in a further decline in the rate of public saving, while no improvement in corporate saving is envisaged to have occurred, given the slowdown of manufacturing activity. At the same time, the net inflow of resources from abroad was lower than in the preceding year as indicated by the narrowing of the current account deficit in 1999-2000. Visceral evidence, therefore, suggests that the gross investment rate might have declined below that of 23.4 per cent in 1998-99. With the emerging trends in private consumption behaviour, aggregate demand would have been buoyed by final consumption expenditures in 1999-2000, although this would not have offset the slackening of investment demand.
1.6 The capacity of the economy to sustain a real growth rate of above 6 per cent in the period 1997-2000 in the face of a decline in the rate of domestic investment and aggregate demand suggests that there are other forces at work. Industry-level evidence indicates a rising rate of productivity growth in the Indian economy particularly in the 1990s. At an aggregative level, evidence of rising productivity as an explanation of the continuing robustness of economic activity is corroborated by the movements in the incremental capital output ratio (ICOR) which reflects the efficiency of capital use in terms of output change associated with each additional unit of capital employed. The ICOR series, smoothed to remove the year to year aberrations, shows that the permanent or 'trend (or filtered)' component of the ICOR declined during the 1990s to 4.2 in 1998-99, indicating productivity improvements. These results could be affected due to a sudden increase in ICOR in a particular year. The actual data on ICOR also shows a decline from 4.8 in 1992-93 to 3.7 in 1998-99 (Chart I.2).
1.7 The overall saving-investment gap has averaged 1.4 per cent of GDP in the 1990s. While the consolidation of the macro-balance in relation to the preceding decade has had salutary effects on the sustainability of the growth process, the widening of the public sector's saving-investment gap in 1998-99, after a period of retrenchment in 1995-98, and the indications of a further expansion in 1999-2000, is a matter of concern. On the other hand, the saving-investment surplus of the non-government sector has tended to grow after reaching a trough in 1995-96. Reducing the public sector's deficit and rekindling private investment, thus, emerge as policy priorities so that the macro-balances are sustainable.
1.8 On the supply side, the growth rate of GDP from 'agriculture and allied activities' decelerated sharply to 1.3 per cent in 1999-2000 from 7.2 per cent in the preceding year (Table 1.1). Industrial growth exhibited signs of revival, driven by an upturn in the manufacturing sector. The growth in intermediate goods and consumer durables led the acceleration of manufacturing output, followed by basic goods. The weakness in aggregate investment demand was reflected in a major slowdown in the performance of the capital goods sector. The service sector GDP growth at 8.7 per cent in 1999-2000 outstripped the average for the 1990s (7.7 per cent) and raised the share of the service sector in GDP from 51.2 per cent in 1998-99 to 52.3 per cent in 1999-2000. The buoyancy in service sector output was concentrated in the new economy sectors such as, computer software, financial and business services. The service sector has emerged as an engine of growth for the Indian economy with 'towing' effects for the other sectors of the economy. There is accumulating evidence that the rising share of services in GDP is an expression of productivity rather than a mutation of the process of growth.
Agriculture
1.9 Agricultural production suffered a setback in 1999-2000 reflecting spatio-temporal disruptions in monsoon and droughts, floods and cyclones across several States in an otherwise normal South-West monsoon season. Nevertheless, the output of rice at 89.5 million tonnes and wheat at 75.6 million tonnes attained all time highs and raised total foodgrains production to a new peak of 208.9 million tonnes in 1999-2000 (Chart I.3 and Table 1.2). Since 1997, India has emerged as the second largest producer of rice and wheat, after China. Sugarcane output also scaled a new peak in 1999-2000 at 299.2 million tonnes. On the other hand, there was a sharp decline in the production of pulses and coarse cereals. Overall non-foodgrains production fared poorly due to declines in the production of two major crops, i.e., oilseeds (particularly groundnut) and cotton, whereas sugarcane and jute and mesta witnessed a rise in production.
Table 1.1: Sectoral Composition and Growth Rates of Real Gross Domestic Product (at 1993-94 prices) |
(Per cent) | |||||||||
Sector | Growth Rate | Share in Real | |||||||
| | | | | | | | GDP | ||
1992-93 | 1998- | 1999- | 1999-2000 | 2000-01 | 1998- | 1999- | |||
to 1999- | 99* | 2000# | 99* | 2000# | |||||
| | 2000** | | | (Q1) | (Q2) | (Q1) | (Q2) | | |
1 | 2 | 3 | 4 | 5 | 6 | 7 | 8 | 9 | 10 |
1. Agriculture, forestry and fishing | 3.8 | 7.2 | 1.3 | 4.9 | 3.5 | 1.3 | 1.0 | 26.8 | 25.5 |
2. Industry | 7.3 | 3.7 | 7.5 | 5.3 | 6.5 | 6.0 | 5.9 | 22.0 | 22.2 |
3. Services @ | 7.7 | 8.0 | 8.7 | 8.6 | 6.1 | 7.9 | 7.9 | 51.2 | 52.3 |
4. Gross domestic product at factor cost | 6.4 | 6.8 | 6.4 | 6.9 | 5.7 | 5.8 | 6.0 | 100.0 | 100.0 |
@ Inclusive of construction. | * Quick Estimates. | # Revised Estimates. | Q : Quarter. |
* * The average growth rate for the year 1992-93 was calculated by using 1980-81 as the base and for the period 1993-94 to 1999-2000 was calculated using 1993-94 as base year. | |||
Source : Central Statistical Organisation (CSO). | |||
Table 1.2: Crop-wise Targets/Achievements in the Kharif and Rabi Season |
(Million tonnes/bales) | |||||||||||
Crop | Kharif | Rabi | Kharif | Rabi | |||||||
1998-99 | 1999-2000 | 1998-99 | 1999-2000 | 2000-01 | 2000-01 | ||||||
| | T | A | T | A | T | A | T | A | T | AE | T |
1 | 2 | 3 | 4 | 5 | 6 | 7 | 8 | 9 | 10 | 11 | 12 |
Rice | 73.20 | 72.66 | 74.50 | 76.71 | 11.00 | 13.36 | 11.50 | 12.77 | 76.30 | 74.07 | 13.70 |
Wheat | - | - | - | - | 70.00 | 71.29 | 74.00 | 75.57 | - | - | 74.00 |
Coarse cereals | 27.80 | 25.06 | 27.00 | 23.23 | 6.50 | 6.29 | 7.50 | 7.24 | 26.62 | 23.11 | 6.33 |
Pulses | 6.10 | 5.13 | 6.10 | 4.92 | 9.40 | 9.75 | 9.40 | 8.44 | 6.00 | 5.50 | 9.00 |
Total Foodgrains | 107.10 | 102.85 | 107.60 | 104.86 | 96.90 | 100.70 | 102.40 | 104.02 | 108.92 | 102.68 | 103.08 |
Oilseeds | 15.90 | 15.80 | 16.50 | 12.33 | 11.10 | 6.93 | 11.50 | 8.54 | 16.50 | 12.11 | 11.50 |
Sugarcane | 300.00 | 288.72 | 305.00 | 299.23 | - | - | - | - | 325.00 | 300.58 | - |
Cotton* | 14.80 | 12.29 | 15.00 | 11.64 | - | - | - | - | 14.50 | 13.16 | - |
Jute & Mesta$ | 9.75 | 9.81 | 11.00 | 10.53 | - | - | - | - | 10.00 | 9.95 | - |
AE Advance Estimates as on September 30, 2000. | T Target | A | Achievement |
* Million bales of 170 kg. each | $ Million bales of 180 kg. each | ||
1.10 Total foodgrains procurement rose by 27.0 per cent in 1999-2000 over the previous year's level. The total off-take of foodgrains rose moderately by 6.9 per cent, mainly due to substantial rise in the off-take under Open Market Sales (OMS) and a moderate rise in off-take under Other Welfare Schemes (OWS). The off-take under Targeted Public Distribution System (TPDS), however, declined by 13.4 per cent. With the substantial rise in procurement levels, the stock of foodgrains at the end of March 2000 increased to 28.0 million tonnes (29.3 per cent) from the previous year's level of 21.7 million tonnes.
Industry
1.11 During 1999-2000, there was an improvement in the performance of the industrial sector alongside a revival in business sentiment and renewed activity in the capital markets. The lagged effects of strong growth of agriculture in the previous year, a rebound in external demand reflected in export growth and a conducive policy environment enabled a hesitant recovery in industrial production from a relatively lower growth of 4.1 per cent in 1998-99 to 6.5 per cent in 1999-2000 in terms of the Index of Industrial Production (IIP; base: 1993-94=100). Manufacturing output growth at 7.1 per cent in 1999-2000 played the lead role, which was 2.7 percentage points higher than that of 4.4 per cent during the previous year. Electricity generation grew by 6.1 per cent in 1999-2000 as against 6.5 per cent during the previous year. In case of mining, however, there was a marginal growth of 1.0 per cent in 1999-2000, reversing the decline of 0.8 per cent during the previous year (Chart I.4).
1.12 Disaggregated analysis of manufacturing activity in 1999-2000 indicates that the upturn was spread over nine out of the 17 industry groups comprising the manufacturing category (Table 1.3). The impetus for higher growth emanated mainly from five industry groups, viz., i) non-metallic mineral products, ii) machinery and equipment other than transport equipment, iii) leather and leather & fur products, iv) wool, silk and man-made fibre textiles and v) basic chemicals and chemical products (except products of petroleum and coal) which accounted for 85.9 per cent of the growth in manufacturing output.
Table 1.3: Classification of Groups of Manufacturing Industries by Growth Performance (Base: 1993-94=100) |
1998-99 | 1999-2000 | ||||
Classification | No. of | Weight | No. of | Weight | |
Industry | in IIP | Industry | in IIP | ||
| | | Groups | | Groups | |
| | 1 | 2 | 3 | 4 | 5 |
1. | Acceleration | 7 | 27.95 | 9 | 55.96 |
2. | Deceleration | 5 | 32.61 | 3 | 9.01 |
3. | Negative | 5 | 18.80 | 5 | 14.39 |
Manufacturing | 1 7 | 79.36 | 17 | 79.36 | |
(Total) | |||||
1.13 Production of intermediate goods rose at the rate of 8.8 per cent in 1999-2000 as against 6.1 per cent in the previous year. In the case of the capital goods sector, there was a slowdown in growth to 6.9 per cent in 1999-2000 from 12.6 per cent in the previous year. For both basic goods and consumer goods, the growth rates in 1999-2000 accelerated from around 2.0 per cent in the preceding year to above 5.0 per cent. Within the consumer goods category, the growth of consumer durables rose at a faster rate of 14.1 per cent than the growth of consumer non-durables at 3.2 per cent (Chart I.5).
1.14 The performance of infrastructure industries also improved during 1999-2000. The overall growth rate of six infrastructure industries, viz., electricity, coal, steel, crude oil, petroleum refinery products and cement, which account for a total weight of 26.68 per cent in the IIP, recorded a higher growth of 6.7 per cent in 1999-2000 than that of 2.8 per cent recorded in the previous year. Petroleum refinery products, steel and cement were the leading performers in the group (Chart I.6).
1.15 The slowdown in capital goods production which has been in evidence since September 1999 needs to be seen in conjunction with the general sluggishness in aggregate demand and the level of capacity utilisation. During 1999-2000, the growth of capital goods production remained subdued due to an inadequate pick up in domestic investment demand partly reflecting large capacity creation out of imports during 1993-96. During this period, imports of capital goods grew at an average of 32 per cent (in dollar terms) while domestic production of capital goods rose by only 3.5 per cent per annum (Chart I.7). In contrast, since 1996-97, capital goods imports recorded absolute declines year after year (except in 1998-99), while domestic production grew at an average annual rate of 9.2 per cent. Thus, with the progressive liberalisation of the economy, domestic investment in capital goods has faced competition from imports and has been held down by excess capacity creation. The alternating patterns of domestic production and imports of capital goods suggest that the current industrial growth is insufficiently supported by capital accumulation. Stepping up the availability of capital goods, both domestic and imported, holds the key to the entrenchment of a broad-based industrial recovery in the near term.
The External Sector
1.16 Significant gains in macro-economic performance during 1999-2000 were registered in the external sector. For the fourth year in succession, the balance of payments recorded an overall surplus, of the order of 1.4 per cent of GDP, enabled by a moderate narrowing of the current account deficit and a rebound in capital flows, particularly in the form of portfolio investment and accretions to non-resident deposits. With the strengthening of the external accounts, India's international reserves were built up to a level of US $ 38 billion by the end of March 2000, equivalent of over 8 months of imports or nearly three and a half years of debt service.
1.17 The movements in the monitoring indicators suggest that the improvement in the balance of payments was driven by the strength of the 'fundamentals', which considerably brightens the near-term external sector outlook. First, the balance of payments outturn occurred in an international environment that turned suddenly adverse by the doubling of international oil prices during the year, blunting the beneficial effects of the resurgence of global output and trade. Secondly, despite the terms of trade shock, a moderate reduction in the current account deficit was accomplished on the back of a surge in the growth of current receipts. Consequently, co-moving with a contraction of the current account deficit from 1 per cent of GDP (US $ 4 billion) in 1998-99 to 0.9 per cent of GDP (US $ 4.2 billion) in 1999-2000, the ratio of current receipts financing current payments exhibited a moderate increase from 93.2 per cent to 93.8 per cent. In the capital account, equity flows regained their share of over 50 per cent of net capital flows after a decline to 28 per cent in the preceding year. Indicators of solvency such as the debt service ratio, the interest service ratio and the debt-GDP ratio moved downwards during 1999-2000 and remained, well below the conventional thresholds of moderate indebtedness. The liquidity indicators such as the reserves cover against short-term debt (by residual maturity) and potentially volatile flows, in general, as also the share of forward commitments in the reserves, improved significantly during the year (Table 1.4).
Current Account
1.18 In the current account, the most significant development in 1999-2000 was the sharp rally in international crude prices which peaked at a nine-year high in March 2000. For India, the sharp rise in international crude prices translated into a spurt in oil import payments by nearly 64 per cent as the oil import bill rose by almost one percentage point of GDP over the year to US $10.5 billion. The adjustment to the oil price shock was enabled by a combination of positive developments which reflect the underlying strength and resilience of the economy. First, India's exports benefited from the robust growth of world trade (Chart I.8) and the bottoming out of the cyclical decline in non-fuel commodity and manufactures prices. The policy environment was supportive of the export effort. Export growth at 11.6 per cent, on balance of payments basis, in 1999-2000 finally reversed a three-year slowdown. As a result, the share of exports in GDP, which had been on a downward drift since 1997-98, revived in 1999-2000. Secondly, in the invisible account, remittances from Indians working overseas (reflected under private transfers) and software exports remained buoyant, propelling increases in foreign exchange earnings under their respective overall categories of the order of US $ 2-2.7 billion. Thirdly, pressures from aggregate demand and their spillover into import demand were not in evidence during 1999-2000, providing a measure of relief in the face of the bulge in oil imports. The weakness in commodity prices also turned out to be fortuitous.
(US $ million) | ||||
Fiscal year (up to September) | ||||
Item | 1999-2000 | 1998-99 | 2000-01 | 1999-2000 |
1 | 2 | 3 | 4 | 5 |
Trade Balance | -17,098 | -13,246 | -9,234 | -7,550 |
Current Account Balance | -4,163 | -4,038 | -3,998 | -2,867 |
Net Capital Flows | 10,242 | 8,565 | 2,786 | 4,290 |
Overall Balance # | 6,402 | 4,222 | -1,434 | 977 |
Reserves and Monetary Gold | -6,142 | -3,829 | 1,460 | -821 |
(Increase - , Decrease +) | | | | |
Memo Items : Key Indicators of BoP | | | | (Per cent) |
CAD / GDP | -0.9 | -1.0 | .. | .. |
Current Receipts @ / | ||||
Current Payments | 93.8 | 93.2 | 90.0 | 91.2 |
Short term Debt | ||||
(by original maturity) / Reserves | 10.6 | 13.5 | 11.6 £ | 13.9 |
Short term Debt | ||||
(by residual maturity) / Reserves | 30.6* | 34.5 | NA | NA |
Debt GDP Ratio | 22.0 | 23.5 | NA | NA |
Debt Service Ratio | 16.0 | 18.0 | 18.3 | 17.8 |
Liability Service Ratio | 16.8 | 19.1 | 20.2 | 18.6 |
Interest / Current Payments | 6.8 | 7.4 | 6.1 | 7.3 |
Import Cover of | ||||
Reserves (in months) | 8.2 | 8.2 | 6.9 | 7.9 |
Outstanding Forward Commitments/Reserves | 1.8 | 2.5 | 6.3 | 3.0 |
NA : Not Available | ||||
# Includes errors and omissions. | ||||
* As on end-December 1999. | ||||
@ Excluding official transfers. | ||||
£ As at end-June 2000. | ||||
Capital Account
1.19 Capital flows into India in 1999-2000 broadly reflected the subdued international patterns. In the absence of any major financing requirement imposed by the current account deficit, net capital flows, higher at US S 10.2 billion (2.3 per cent of GDP) than US $ 8.6 billion (2.1 per cent of GDP) in 1998-99, enabled an accumulation of reserves. Portfolio investment flows at US $ 3 billion regained their dominance over the capital account, benefiting from the renewal of international investor confidence in stock markets in emerging economies. During the year, forward cover for FIIs was enhanced to 15 per cent of their outstanding investment as on March 1999 and all incremental investments thereafter. FIIs were allowed to raise their participation in the equity capital of Indian companies to 40 per cent of the total. They were also allowed to invest in Indian mutual funds and to invest in Indian stock exchanges on behalf of foreign corporates and high net-worth non-residents. Indian companies were allowed to issue ADRs/GDRs without prior approval of the Government. Acquisition of overseas companies by Indian entities through ADR/GDR issues was liberalised. Net inflows in the form of foreign direct investment, however, declined moderately from US $ 2.5 billion to US $ 2.2 billion, reflecting the weakness in domestic investment demand as well as the lack of appetite of direct investors for Asian economies other than those recovering from the financial crises. The policy response was in the form of releasing procedural constraints - establishment of the Foreign Investment Implementation Authority, automatic route approval for all investment proposals except for a short negative list, special economic zones with tax breaks and relative freedom from implementation bottlenecks and opening up new areas for FDI - such as foreign equity participation in insurance up to 26 per cent. In the case of external commercial borrowing (ECB), the policy framework was liberalised during the year in the form of transfer of approval formalities for all ECB up to US $ 100 million to the Reserve Bank, freeing end-use restriction except for real estate and equity market investment, specific incentives for the infrastructure sector in the form of raising equity investment out of ECB in joint ventures in the infrastructure sector and greater flexibility in ECB exposure for infrastructure projects. Prepayment of ECB from funds under EEFC accounts were allowed as a boost to the export sector which is another thrust area in the deployment of ECB policy.
External Debt
1.20 India's external debt remained broadly stable in nominal terms at around US $ 98 billion; however, there has been a steady consolidation of debt over the 1990s. This is reflected in the downward movement of the debt-GDP ratio and the debt service ratio to 22.0 per cent and 16.0 per cent, respectively in 1999-2000. Short-term debt by original maturity accounted for only 4.1 per cent of total debt as at end-March 2000 and 10.8 per cent by residual maturity as at end-December 1999. The ratio of short-term debt to reserves was 10.6 per cent by original maturity and 30.6 per cent by residual maturity as at end-December 1999.
Inflation
1.21 Reflecting the aggregate demand - aggregate supply situation, the year 1999-2000 experienced a generally low order of inflation, except towards the close. Headline inflation, measured by the wholesale price index (WPI) on a point-to-point basis, decelerated from around 4.3 per cent at the beginning of the year to a trough of 1.9 per cent on July 24, 1999, and crossed 5.0 per cent in March 2000. This reflected revisions in the administered prices effected in February and March 2000 mainly on account of cost considerations. The absence of inflationary pressures during 1999-2000 is corroborated by movements in core inflation (excluding administered items) and by the behaviour of inflation measured in terms of the WPI on an average basis (Chart I.9).
1.22 On the demand side, the sluggishness in investment demand and the presence of excess capacity in various industries dampened inflationary pressures. On the supply side, the downward drift in the annual inflation rate during 1999-2000 was primarily driven by significantly lower order of increases in the prices of primary articles and manufactures. On an average basis, 'primary' inflation fell to 1.1 per cent in 1999-2000 as against an increase of 12.0 per cent in 1998-99, mainly on account of a record level of foodgrains production and comfortable buffer stocks. There was also a significant decline in 'manufacturing' inflation to 2.7 per cent from 4.4 per cent in 1998-99, reflecting an improvement in industrial production, particularly manufacturing output growth and the cyclical trough in international prices of manufactures. 'Fuel' inflation, on the other hand, rose to 9.0 per cent in 1999-2000 from 3.2 per cent in 1998-99, mainly due to the upward revision in administered prices of petroleum products.
1.23 Consumer price inflation, measured as the point-to-point variation in the Consumer Price Index for Industrial Workers (CPI-IW) fell to 4.8 per cent from 8.9 per cent in 1998-99. However, on an average basis, CPI inflation showed a sharp decline to 3.4 per cent in 1999-2000 from a high of 13.1 per cent in 1998-99, thereby converging with the average WPI inflation (Chart I.10). This reflected the subdued rise in food prices as a result of better food production and management through the public distribution system (PDS) and timely imports of essential items like sugar and edible oils.
Financial Sector Developments
1.24 Successive rounds of financial sector reforms have been implemented principally through the vehicle of monetary policy, in close coordination with fiscal authorities as well as with international initiatives for a better financial architecture globally. In 1999-2000, monetary policy carried forward the focus on structural measures to strengthen the financial system and to improve the functioning of various segments of the financial markets.
Commercial Banking Survey
1.25 The banking system continues to retain a special position in the institutional structure of the financial system in India. Movements in the balance sheets of commercial banks provide insights into the extent of financial intermediation and the relationship between bank credit and economic growth. They also reveal the impulses in the market for credit which, in turn, provides a conduit for the transmission of monetary policy impulses.
1.26 During 1999-2000, the growth of aggregate deposits (excluding RIBs) of scheduled commercial banks (SCBs) decelerated to 14.3 per cent from 16.3 per cent in the previous year (Chart I.11).
1.27 Despite the slowdown in deposit growth, credit extended by SCBs rose by 18.2 per cent in 1999-2000 as against 13.8 per cent in 1998-99 especially after November 1999 with the revival in industrial activity (Chart I.12). Food credit increase was more than double the increase recorded in the previous year. Non-food credit growth increased to 16.5 per cent from 13.0 per cent in1998-99. On the other hand, scheduled commercial banks' non-SLR investments in the forms of commercial paper, shares, debentures and bonds showed a lower increase of Rs.13,027 crore during 1999-2000 than Rs.15,921 crore during 1998-99. The total flow of resources from scheduled commercial banks to the commercial sector (i.e., non-food credit and non-SLR investments) grew by 17.8 per cent (as compared with 16.4 per cent during 1998-99) and was more or less consistent with the projected growth rate of about 18 per cent set for the year.
1.28 Credit growth to the priority sector at 15 per cent was in line with the pace of expansion of non-food credit during 1999-2000. Credit to medium and large industry and wholesale trade increased robustly in the range of 13 and 20 per cent, respectively. The pick-up in gross non-food credit spanned several sectors like housing, consumer durables, non-banking financial companies, loans to individuals against shares/ debentures/bonds, tourism related credit and non-priority sector personal loans, etc., thereby reflecting a preference for financing the services sector and consumer loans. The petroleum industry accounted for the highest increase in industrial credit, followed by chemical, dyes, paints and engineering. Credit drawn by food processing, cement, automobiles, construction, computer software and gems and jewellery industries increased during 1999-2000, while credit to electricity, iron and steel, vegetable oils, infrastructure industries decelerated and credit to mining, tobacco and tobacco products declined.
Financial Performance
1.29 The impact of the financial sector reforms is reflected in an improvement in the financial performance of the various constituents of the financial sector in India. Operating profits of scheduled commercial banks (SCBs) reversed the decline of 5.7 per cent recorded in 1998-99 and increased by 33.4 per cent in 1999-2000 (i.e., to Rs.18,423 crore). The ratio of net profits to total assets increased by 19 basis points to 0.66 per cent as against a decline of 35 basis points in the preceding year. Relatively higher growth in interest income as well as in other income and a deceleration in operating expenses improved the profitability of SCBs. Besides the factors generally contributing to improve profitability in the banking system, public sector banks (PSBs) reaped capital gains in their treasury operations. The private sector banks recorded the maximum gains in profitability in terms of growth rates. Net profits of financial institutions showed a decline during 1999-2000 due to a pronounced rise in expenditure. The ratio of net profits to total assets fell to 1.24 per cent in 1999-2000 from 1.57 per cent in the preceding year.
1.30 Aggregate financial assets of financial institutions grew at 11.4 per cent during 1999-2000. Resources from internal sources constituted 50 per cent of total sources of funds while the share of external resources (borrowings by way of bonds, debentures, external commercial borrowing) was about 27 per cent. Fresh deployments comprised 56 per cent of total use of funds while repayments accounted for 18 per cent.
1.31 At end-March 1999, the public deposits of NBFCs stood at Rs.20,429 crore or 2.6 per cent of deposits of SCBs with indications of a decline in 1999-2000. Aggregate assets, as on March 31, 1999, constituted approximately 5 per cent of the total assets of SCBs. Public deposits expressed as a multiple of net owned funds declined from 1.6 at the end of March 1998 to 1.2 at the end of March 1999.
Financial Market Behaviour
1.32 Financial markets in India remained generally stable during 1999-2000, reflecting, to a large extent, an improvement in international financial market conditions. Within the market continuum, however, short-term rates rose in response to heightened activity in the government securities market, a rise in the demand for bank credit and sporadic volatility in the foreign exchange market during the first half of the year. During the year, different segments of financial markets exhibited a growing tendency towards integration viewed in terms of the movements in prices and turnover. Market participants tended to arbitrage funds from the money market to the foreign exchange market and the Government securities market (Chart I.13).
Call Money Market
1.33 While generally comfortable liquidity conditions prevailed during a greater part of the rate, the inter-bank call money rate hardened from the average of 8.13 per cent during 1998-99 to 9.09 per cent in 1999-2000. The divergence between average daily high and low rates remained narrow, corroborated by indicators like coefficient of variation and standard deviation (Table 1.5). In general, the market conditions remained orderly barring brief periods of volatility during mid-August 1999, mid-October 1999, mid-February 2000 and end-March 2000.
1.34 With the introduction of the ILAF, call rates tended to move above the Bank Rate at which refinance was available. The call rates, however, rose sharply in October 1999 and February 2000 even beyond the informal ceiling set by the tier II refinance rate for the better part of the year. In general, money market conditions were modulated by discretionary liquidity management through the ILAF.
Table 1.5: Average Daily Inter-bank Call Money Lending Rates |
2000-01 | 1999-2000 | 1998-99 | |
(up to | |||
| | October 2000) | | |
1 | 2 | 3 | 4 |
Intra-day Minimum (%) | 7.97 | 8.39 | 3.05 |
Intra-day Maximum (%) | 10.65 | 9.51 | 21.75 |
Average (%) | 9.47 | 9.09 | 8.13 |
SD(%) | 2.86 | 1.90 | 2.10 |
CV | 0.30 | 0.21 | 0.26 |
Government Securities Market
1.35 The Government securities market witnessed generally buoyant conditions particularly at the long end of the spectrum. Market preference strengthened for medium and longer maturity paper, given the easing of inflationary expectations, stable call money market conditions and absence of major domestic and international uncertainties. As a consequence, interest rates at the long end of the yield curve declined. The strong increase in the demand for Government securities facilitated (a) meeting of a higher order of Central Government's gross borrowing requirement at Rs.99,630 crore, including 364-day Treasury Bills, notwithstanding a lower support by the Reserve Bank at Rs.29,267 crore; (b) elongation in the maturity profile of marketable debt of the Central Government from 7.7 years in 1998-99 to 12.6 years in 1999-2000; and (c) a reduction in weighted average cut-off yield on the Central government market borrowing from 11.86 per cent in 1998-99 to 11.77 per cent in 1999-2000.
1.36 Higher demand for Government securities in 1999-2000 led to a sharp increase in turnover in the secondary market for Government securities. The turnover in the secondary market registered a 137 per cent increase over the previous year to Rs.5,35,602 crore, with outright transactions contributing to around 85 per cent of turnover. The turnover ratio in dated securities (ratio of total turnover to total outstanding securities) accordingly increased to 3.2 as on March 31, 2000 from 1.7 as on March 31,1999. The demand-led rally in the secondary market facilitated lowering of interest rates in all segments of the yield curve. On a point-to-point basis, the yield on 10-year security declined by 120 basis points between end-March 1999 and end-March 2000 setting the tenor for yields on even longer dated securities. At the short to medium end, the decline was of a lower order. As a result, the yield spread between 5-year and 10-year securities diminished from 55 basis points at end-March 1999 to 34-basis points at end-March 2000. The yield curve shifted downward with a flattening shape (Chart I.14).
Foreign Exchange Market
1.37 The foreign exchange market exhibited excess supply conditions during 1999-2000 except for episodes of volatility in June-October 1999. Recovery in export growth and renewal of portfolio investment flows enabled easy supply conditions. The exchange rate of the rupee traded in a narrow range of Rs.42.4-43.6 per US dollar in the spot market. Trading activity, however, remained subdued due to the continuing restrictions on rebooking of cancelled forward contracts and splitting of forward and spot legs. The average monthly turnover declined from US $ 109 billion in 1998-99 to US $ 95 billion in 1999-2000 with merchant turnover moving in the range of US $ 15-27 billion and the inter-bank turnover ranging between US $ 62-94 billion (Chart I.15). Forward premia ruled easy for the greater part of the year. During 1999-2000, the average three month forward premia moved down from 7.2 per cent to 4.5 per cent. Outstanding forward sale commitments declined from US $ 732 million at the beginning of the year to US $ 675 million at the end of March 2000.
Capital Market
1.38 Overall resource mobilisation in the new issues market declined during 1999-2000, although the number of new issues floated increased sharply. Resources raised from the private placement market, however, increased sharply. Total resource mobilisation by way of prospectus and rights issues at Rs.7,704 crore during 1999-2000, was lower by 17.7 per cent as compared with Rs.9,365 crore mobilised during the previous year, even as the number of new capital issues increased to 83 from 51. This was due entirely to a sharp decline in resources mobilised by banks and financial institutions in the public sector. Resources mobilised by non-Government public limited companies (private sector) at Rs.5,153 crore through 79 issues registered an increase of 2.8 per cent from Rs.5,013 crore through 48 issues in the previous year. Resources mobilised by way of equity accounted for 53.4 per cent (from 69 issues) of total resource mobilisation by the private sector as against 51.1 per cent (from 33 issues) last year. The equity issues were well received by the market, as the share of premium in the total amount mobilised by equity issues increased to 78.8 per cent from 51.7 per cent in 1998-99. In particular, 35 issues accounting for Rs.631 crore were floated by companies in the IT, media and telecom sectors during 1999-2000 as against 4 issues for a total of Rs.39 crore in the previous year. The resource mobilisation from the private placement market during 1999-2000 increased by 23.3 per cent to Rs.61,259 crore. Of this 68.3 per cent was accounted for by the public sector entities. Financial intermediaries accounted for 47.1 per cent of total resources mobilised through private placement.
1.39 After two consecutive years of subdued performance, resource mobilisation by mutual funds witnessed a turnaround during 1999-2000. Net resource mobilisation by all mutual funds increased more than six-fold to reach the highest ever figure of Rs.21,971 crore in any single year as compared with Rs.3,611 crore mobilised during 1998-99. Growth in resource mobilisation during 1999-2000 was contributed mainly by private sector funds, which witnessed an inflow of the order of Rs.17,171 crore as against Rs.2,519 crore during the previous year, followed by the UTI (Rs.4,548 crore as against Rs.170 crore). The net inflow to the public sector mutual funds, however, declined from Rs.922 crore to Rs.253 crore. Improved resource mobilisation by mutual funds could be attributed mainly to tax benefits announced in the Union Budget for 1999-2000 as also to buoyant stock market conditions during the larger part of the 1999-2000. During 1999-2000, financial assistance sanctioned and disbursed by all-India financial institutions at Rs.1,03,567 crore and Rs.67,335 crore rose by 26.5 per cent and 19.6 per cent, respectively.
1.40 The BSE Sensex (Base: 1978-79=100), on a point-to-point basis, registered a gain of 1261 points (33.7 per cent) during 1999-2000. On an average basis, it increased by 41.4 per cent in comparison with a decline of 13.6 per cent in the previous year. The S&P CNX Nifty (NSE-50) Index (Base: November 3, 1995=1000) showed a movement similar to the BSE Sensex; the average index for 1999-2000 increased by 43.3 per cent as compared with a decline of 12.2 per cent in the previous year.
The Conduct of Monetary Policy
1.41 In 1999-2000, monetary policy was confronted with the conflict between the need to regenerate growth through the provision of adequate bank credit on the one hand, and the need to restrain the growth of overall liquidity so as to ensure price stability on the other. Careful balancing of these conflicting pulls necessitated a flexible and pro-active monetary stance. The objectives assumed by monetary policy for the year were provision of reasonable liquidity, stable interest rates with a preference for softening, debt management, orderly development of financial markets and carrying forward the process of financial sector reform. Broad money (M3) growth was projected at 15.5-16.0 per cent, consistent with a GDP growth of 6.0-7.0 per cent and inflation rate of about 5.0 per cent. The tuning of monetary policy operations to financial market conditions was guided by the behaviour of multiple indicators - money supply, money market rates, exchange rates, foreign exchange reserve movements, fiscal developments and credit to various sectors.
1.42 Debt management operations were sought to be conducted through a combination of auctions, private placement and open market operations with a view to maintaining a stable interest rate environment. With regard to the management of the exchange rate, the primary objective of monetary policy was to ensure the maintenance of orderly conditions in the foreign exchange markets, meeting temporary supply demand mismatches and curbing destabilising speculative activities.
1.43 The indicators of monetary conditions suggest that monetary policy was broadly on course in terms of its stated objectives during 1999-2000 (Chart I.16). While the fiscal year M3 growth rate dipped to 13.9 per cent, this was largely statistical and associated with year-end balance sheet adjustments, with the monthly average year-on-year M3 (excluding RIBs) growth working out to 16.6 per cent (Table 1.6). While currency demand decelerated reflecting the slowdown in agricultural activity in the latter half of the year aggregate deposit growth of scheduled commercial banks was of the order of 13.9 per cent as against the projected growth rate of 16.5 per cent. Commercial bank time deposits decelerated to 16.8 per cent (net of RIBs), on fortnightly average basis, from 20.0 per cent, mainly on account of migration of private saving to mutual funds. Net bank credit to Government increased by 14.2 per cent mainly reflecting commercial bank investments enabled by the release of resources on account of the reduction in the cash reserve requirements. Bank credit to the commercial sector accelerated to 16.6 per cent during 1999-2000 from 14.5 per cent during 1998-99. Non-food credit of scheduled commercial banks (inclusive of non-SLR investments) increased by 17.7 per cent, in line with the projected growth rate. The resource flow to the commercial sector from bank and non-bank sources, inclusive of capital issues, GDRs/ FCCBs, CPs subscribed by non-banks and borrowings from as well as bills rediscounted with financial institutions increased by Rs.1,51,886 crore during 1999-2000 as compared with Rs.1,27,952 crore during the preceding year (Table 1.7).
Reserve Money
1.44 Reserve money decelerated to 8.1 per cent (by Rs.20,969 crore) during 1999-2000 from 14.6 per cent during 1998-99, primarily reflecting the reduction in reserve requirements. Adjusting bank reserves for the first round release of lendable resources, incremental primary liquidity worked out to about 13.0 per cent. This was essentially driven by the accretion of Rs.27,382 crore (adjusted for revaluation) to the Reserve Bank's foreign currency assets. The liquidity generated by CRR cuts and capital flows fostered market demand for government paper, which facilitated a decline in the net RBI credit to the Central government (by Rs.5,587 crore) -for the first time since 1977-78 - despite a sharp increase in the Centre's gross fiscal deficit.
(Per cent) | |||||||
Fiscal year | Fiscal year so far (up | ||||||
| | to December 29) | ||||||
Variable | 1999-2000 | 1999- | 1998-99 | 2000-01 | 1999-2000 | ||
(point to | 2000 | (point to | (point to | (point to | |||
point basis) | (average | point | point | point | |||
| | | | basis) | basis) | basis) | basis) | |
1 | | 2 | 3 | 4 | 5 | 6 | |
I. | Reserve Money | 8.1 | 11.9 | 14.6 | 1.9 | 2.1 | |
II. | Narrow Money (M1) | 10.2 | 14.7 | 15.4 | 7.1 | 7.3 | |
III. | Broad Money (M3) | 13.9 | 17.1 | 19.4 | 12.9 | 11.3 | |
III.1 M3, net of RIBs | 16.6 | 17.3 | |||||
III.2 M3, net of IMDs | 10.7 | ||||||
III.3 NM3 | 14.8 | 17.3 | 18.0 | 9.0 $ | 9.6 $ | ||
IV. | Components of Broad Money | ||||||
a) Currency with the Public | 11.7 | 16.3 | 16.1 | 8.4 | 13.9 | ||
b) Aggregate Deposits (i+ii) | 14.5 | 17.4 | 20.2 | 14.0 | 10.9 | ||
i) Demand Deposits | 9.1 | 13.0 | 14.9 | 6.0 | -0.3 | ||
ii) Time Deposits | 15.6 | 18.2 | 21.4 | 15.5 | 13.1 | ||
V. Sources of Broad Money | |||||||
a) Net Bank Credit to the Government (i+ii) | 14.2 | 15.1 | 17.0 | 11.3 | 14.2 | ||
i) Net Reserve Bank Credit | |||||||
to the Government | -2.8 | 5.3 | 12.9 | -0.5 | 3.1 | ||
Of which: to Centre | -3.8 | 4.3 | 8.8 | 2.2 | 5.2 | ||
ii) Other Banks' Credit to the Government | 25.3 | 21.7 | 19.8 | 17.2 | 21.5 | ||
b) Bank credit to Commercial Sector | 16.6 | 16.2 | 14.5 | 11.5 | 10.3 | ||
Of which: | |||||||
Scheduled Commercial Banks' | |||||||
Non-food Credit | 16.5 | 15.5 | 13.0 | 11.6 | 10.7 | ||
c) Net Foreign Exchange Assets of | |||||||
| | the Banking Sector | 15.6 | 21.1 | 28.8 | 13.9 | 5.9 | |
Data are provisional. |
$ Relates to November 17, 2000 and November 19, 1999, as the case may be. |
Table 1.7 : Total Flow of Non-Food Resources to Commercial Sector |
(Rupees crore) | ||||||||||
Fiscal year so far | ||||||||||
(Up to December) | ||||||||||
| | | Item | 1999-2000P | 1998-99 | 2000-01 | 1999-2000 | ||||
| | | 1 | 2 | 3 | 4 | 5 | ||||
I. | Scheduled Commercial Banks (I.1+I.2) | 71,274 | 56,349 | 53,321 | 47,041 | |||||
I.1. | Non-food credit | 58,246 | 40,428 | 47,530 | 37,558 | |||||
I.2. | Other Investments (2.1+2.2+2.3) | 13,028 | 15,921 | 5,790 | 9,483 | |||||
2.1. Commercial Paper | 1,060 | 1,563 | 1,208 | 1,875 | ||||||
2.2. Bonds/Debentures/Preference Shares issued by | 10,469 | 13,488 | 4,268 | 7,242 | ||||||
2.2.1 Public Sector Undertakings | 6,413 | 5,407 | 3,929 | 3,567 | ||||||
2.2.2 Private Corporate Sector | 5,056 | 8,081 | 339 | 3675 | ||||||
2.3 Equity Shares issued by PSUs and Private Corporate Sector | 499 | 870 | 314 | 366 | ||||||
II. | Other Banks | 12,408 | 13,735 | 8,011 | 7,534 | |||||
III. | From Other Sources | |||||||||
(III.1+III.2+III.3+III.4+III.5) | 68,204 | 57,868 | 47,830 | 36,630 | ||||||
III.1 | Bills rediscounted with Financial Institutions | -96 | 187 | 636 | 368 | |||||
III.2 | Capital Issues # (2.1+2.2) | -472 | -2,312 | 2,257 | -949 | |||||
2.1 Non-Government Public Companies | -472 | -3,664 | 2,257 | -949 | ||||||
2.1.1 Debentures and Preference Shares (2.1.1+2.1.2) | -2,655 | -5,631 | 287 | -1,802 | ||||||
2.1.2 Equity shares | 2,183 | 1,967 | 1,970 | 852 | ||||||
2.2 Public Sector Undertakings and Government | ||||||||||
Companies | 0 | 1,352 | 0 | 0 | ||||||
III.3 | Global Depository Receipts (GDRs) and Foreign | |||||||||
Currency Convertible Bonds (FCCBs) Deposits | 1,675 | 2,105 | 3,859 | 482 | ||||||
III.4 | Issue of Commercial Paper (CP) # | -167 | 1,7.7 | 1,472 | 1,158 | |||||
III.5 | Borrowings from Financial Institutions ## | 67,264 | 56,181 | 39,606 | 35,572 | |||||
| | Total Flow of Non-food Resources (I+II+III) | 1,51,886 | 1,27,952 | 1,09,162 | 91,204 | |||||
| | Memo Items | | | | | |||||
1. | Loans to Corporates against shares | -44 | 20 | -5 | -15 | |||||
| | 2. | Private Placements | 61,259 | 49,679 | 25,215@ | 26,965@ | ||||
Data are provisional. $ Adjusted for banks' investments in shares and debentures. | # Excluding CPs issued to banks. | |||
# # | Excludes bills rediscounted with FIs. | @ | Up to September. | |
1.45 During 1999-2000, the Reserve Bank strategically offset changes in autonomous liquidity with changes in discretionary liquidity in order to stabilise money market conditions (Chart I.17).
Fiscal Policy
1.46 Finances of both the Centre and the States suffered a deterioration during 1999-2000 on account of slippages in budgeted revenues and expenditures. The gross fiscal deficit of the Centre in the revised estimates for 1999-2000, at Rs.1,08,898 crore or 5.6 per cent of GDP, exceeded the budget estimates by 1.6 per cent of GDP. In the States, expenditure overruns representing lagged effects of Fifth Pay Commission revisions and the costs associated with natural calamity management took the consolidated fiscal deficit of States to 4.9 per cent of GDP in the revised estimates for 1999-2000, nearly 1 per cent of GDP above the budget estimates. The combined fiscal deficit of the Centre and States rose to 9.9 per cent of GDP, the highest level in the 1990s. All measures of the deficit exceeded projections (Chart I.18). The financing requirements of the budgetary operations of the Centre and States brought upward pressures to bear on financial markets and, therefore, the Reserve Bank had to engage in active debt management and fine tuning operations to ensure appropriate monetary conditions for accelerating growth.
Central Finances
1.47 In 1999-2000, there was a revenue shortfall of 1.8 per cent in the revised estimates over the Central Government's budget target. This was primarily on account of custom and excise duty collections falling below budget projections on account of low non-oil import demand and rate reductions. Corporation tax also fell short, reflecting the fragility of the industrial upturn. Other taxes on income brought in improved collections while non-tax revenue recorded a modest growth. Expenditures of the central Government overshot the budget estimates due to the impact of cyclones and floods, remaining effects of pay revisions and the Eleventh Finance Commission's award of special short-term fiscal assistance to States. The rise in interest and pension payments in the revenue account accounted for over 38.3 per cent of the increase in total expenditures. Capital outlays rose by about 3 per cent. Disinvestment proceeds fell short of the target; only a fourth of the projected amount of Rs.10,000 crore could be raised during 1999-2000. Consequently, net market borrowings at Rs.73,077 crore (as per RBI records) exceeded the budget estimates by Rs.15,616 crore. The Reserve Bank's support to the borrowing programme by way of devolvements/private placements amounted to Rs.29,267 crore. The average utilisation of WMA remained well below the agreed limits of Rs.11,000 crore for the first half and Rs.7,000 crore for the second half of 1999-2000. Other liabilities and external assistance filled in the remaining fiscal gap.
State Finances
1.48 In case of the States, the revenue shortfall was modest at 0.3 per cent of GDP mainly due to lower realisation of taxes on commodities in the transition towards a uniform VAT. The States' own tax revenues fell short of the budget estimates due to lower realisations of taxes on property, commodities and services. Revenue expenditure exceeded the budget estimates by nearly 4 per cent. Non-plan revenue expenditures, mainly consisting of wages and salaries, pensions and interest payments constituted 83.9 per cent of revenue expenditures in 1999-2000 (RE). Additional expenditure on natural calamities, compensations etc. to local bodies also contributed to the expenditure overrun. As a consequence, the revenue deficit of States exceeded projections by 40 per cent, forming 60 per cent of the gross fiscal deficit of States. The primary deficit expanded from the budgeted 1.6 per cent of GDP to 2.5 per cent of GDP in 1999-2000.
Public Debt
1.49 The high levels of fiscal deficit have led to steady accumulation of debt, as reflected in the rise in the domestic debt-GDP ratio of the Central government from 50.6 per cent as at end-March 1999 to 52.9 per cent as at end-March 2000 and of State Governments from 19.4 per cent to 21.5 per cent of GDP during the same period (Charts I.19 and I.20). As a result, the combined domestic debt of the Government sector reached 60.7 per cent of GDP at end-March 2000 as against 55.5 per cent at end-March 1999 and 56.2 per cent at end-March 1991. The nominal stock of domestic debt of the combined Government sector has been growing at a rate of about 16 per cent during the later part of the 1990s. The rate of debt growth remained below the rate of nominal GDP growth during the first half of the 1990s; however, it generally exceeded the nominal GDP growth since 1997-98, posing challenges for medium-term fiscal stability.
Mid-term Review: 2000-2001
1.50 Macroeconomic developments during the current financial year have necessitated a revision in the outlook for the year. The persistent hardening of international crude oil prices has imparted an upward drift to inflation and may lead to a widening of the current account deficit in the balance of payments. Volatility in the foreign exchange market and the large government borrowing programme warranted a shift in the operation of monetary policy away from its primary objectives of ensuring non-inflationary expansion of credit towards ensuring orderly conditions in the financial markets.
1.51 The real GDP growth in the first quarter of 2000-01 decelerated to 5.8 per cent from 6.9 per cent in the corresponding quarter of 1999-2000 mainly on account of poor performance in 'agriculture and allied activities', decline in growth of 'mining and quarrying' and slowdown in 'manufacturing', 'construction', 'financing, insurance, real estate and business services' and 'community, social and personal services'. In the second quarter, real GDP grew by 6.0 per cent as compared with 5.7 per cent in the corresponding quarter of 1999-2000 mainly due to a strong revival of 'mining and quarrying' and the improved performance of 'trade, hotels, transport and communication' and 'community, social and personal services' (Table 1.1).
Agriculture
1.52 GDP growth in 'agriculture and allied activities' which had decelerated to 1.3 per cent in the first quarter of 2000-01 slowed down further to 1.0 per cent in the second quarter. Although the South-West monsoon season in 2000 was normal with precipitation up to 92 per cent of the Long Period Average, spatially and temporally uneven distribution of rainfall caused some moisture stress in Madhya Pradesh, Rajasthan, Orissa, Gujarat and floods in West Bengal and Andhra Pradesh. Kharif foodgrains output is likely to reach 102.68 million tonnes as against 104.86 million tonnes in 1999-2000 (Table 1.2). It is expected that the shortfall in production from kharif targets would be bridged by better rabi production. Cumulative rainfall in the North-East monsoon season was excess/normal in 4 out of 35 sub-divisions up to December 27, 2000 as compared with 24 sub-divisions in the corresponding period of the previous year.
1.53 During the current financial year, the procurement of rice and wheat up to January 1, 2001 has risen by 14.6 per cent. The total off-take of foodgrains during 2000-01 (up to end-November, 2000) declined by 22.0 per cent on account of a substantial decline in the off-take under TPDS to 7.7 million tonnes from 10.8 million tonnes in the corresponding period of the previous year, as a consequence of the increase in Central Issue Prices (CIP) under PDS. As a result of the fall in off-take and enhanced procurement, the stocks of foodgrains rose to the level of 45.5 million tonnes (43.4 per cent) up to end-November 2000, as compared with 31.7 million tonnes in the previous year.
Industry
1.54 Industrial production (as measured by the IIP) fractionally decelerated to 6.0 per cent in April-November 2000-01 from 6.2 per cent in the first eight months of 1999-2000. Manufacturing and electricity generation both slowed down (Table 1.8). Among the 17 groups of manufacturing industries, only two industry groups, i.e., metal products and parts (except machinery and equipment) and leather and leather and fur products registered double digit growth. In terms of the use-based classification, the growth of consumer goods continued to be high at 8.8 per cent, mainly driven by consumer durables. Capital goods production decelerated to 3.7 per cent. The overall growth rate of the infrastructure industries decelerated to 8.5 per cent in April-November 2000-01 from 9.0 per cent in the corresponding period of the previous year. Petroleum refinery products registered the highest growth (28.0 per cent), followed by steel (14.6 per cent) and coal (6.8 per cent). Production of crude petroleum remained constant while there was a deceleration in the growth of cement and electricity.
External Sector
1.55 The balance of payments data for the first half of 2000-01 point to a widening of the current account deficit to US $ 4.0 billion from US $ 2.9 billion during the corresponding period of last year. The trade deficit expanded by US $ 1.7 billion to US $ 9.2 billion on account of a large rise in oil imports which was partly offset by the buoyancy in export growth. The surplus in the invisible account increased from US $ 4.7 billion in April-September 1999 to US $ 5.2 billion mainly due to higher private transfers, partly offset by lower net earnings from services and higher investment income payments. The net capital flows declined from US $ 4.3 billion to US $ 2.8 billion mainly on account of lower foreign investment flows.
1.56 The stubborn rise in international oil prices has continued to impact adversely on the external sector. Provisional data released by the Ministry of Commerce indicate that PoL imports rose by 84.5 per cent to US $ 11.4 billion during April-November 2000. Non-oil imports, on the other hand, declined by 2.6 per cent. Despite robust export growth at 18.2 per cent, the trade deficit increased marginally to US $ 6.1 billion from US $ 6.0 billion in April-November 1999.
1.57 In the capital account, foreign investment inflows were lower at US $ 2.0 billion during the first seven months of 2000-01 (up to October) than US $ 2.6 billion during the corresponding period of the previous year, on account of sluggish portfolio inflows. Net FIIs flows were uneven, registering an outflow of US $ 421 million during the first seven months of 2000-01 as against an inflow of US $ 854 million during the corresponding period of 1999-2000. Direct investment inflows were, however, marginally higher during 2000-01 (April-October) at US $ 1.6 billion as against those of US $ 1.2 billion in the corresponding period of the previous year. Net NRI deposit inflows amounted to US $ 1.3 billion during 2000-01 (up to October 2000) as against US $ 1.2 billion during 1999-2000 (up to October 1999) (Chart I.21). The normal capital flows were bolstered by proceeds of about US $ 5.5 billion raised under the IMD scheme launched during October-November 2000.
Table 1.8: Month-wise Growth of Index of Industrial Production - General Classification |
(Base : 1993-94 = 100) |
(Per cent) | ||||||||
General | Manufacturing | Mining | Electricity | |||||
(100.00) | (79.36) | (10.47) | (10.17) | |||||
Period | 1999-2000P | 2000-01P | 1999-2000P | 2000-01P | 1999-2000P | 2000-01P | 1999-2000P | 2000-01P |
1 | 2 | 3 | 4 | 5 | 6 | 7 | 8 | 9 |
April | 4.7 | 6.5 | 5.1 | 7.1 | -1.2 | 4.0 | 6.0 | 3.7 |
May | 7.4 | 6.0 | 8.8 | 6.2 | 0.7 | 2.6 | 3.3 | 6.4 |
June | 4.8 | 5.9 | 5.6 | 6.1 | -1.5 | 4.4 | 4.1 | 5.0 |
July | 6.2 | 5.0 | 6.9 | 5.7 | 0.0 | 2.0 | 6.2 | 2.6 |
August | 7.3 | 5.0 | 7.4 | 5.5 | 2.2 | 4.0 | 10.9 | 1.0 |
September | 7.3 | 6.5 | 6.4 | 7.1 | 5.2 | 5.1 | 16.7 | 2.2 |
October | 8.4 | 6.6 | 9.4 | 6.1 | -1.3 | 5.7 | 9.9 | 11.5 |
November | 3.8 | 6.5 | 3.7 | 6.5 | 0.1 | 4.8 | 8.5 | 7.8 |
April-November | 6.2 | 6. 0 | 6. 6 | 6.3 | 0.5 | 4.1 | 8.2 | 4.9 |
P Provisional | ||||||||
Figures in brackets are weights in IIP. | ||||||||
Source: Central Statistical Organisation | ||||||||
1.58 The foreign exchange reserves declined by US $ 3.1 billion from US $ 38.0 billion at end-March 2000 to US $ 34.9 billion at end-October 2000, reflecting the Reserve Bank's net foreign currency sales to authorised dealers and thereafter rose by US $ 5.2 billion in the subsequent two months reflecting IMD inflows. As a result, foreign exchange reserves amounted to US $ 40.1 billion as at end-December, 2000 or an increase of US $ 2.1 billion during the current year so far.
Price Situation
1.59 The average WPI inflation has trended upwards in fiscal 2000-01 so far, largely on account of direct and indirect effects of the administered price revisions effected during the close of the previous year and again in September 2000. The WPI inflation rate stood at 4.5 per cent during 2000-01 (up to December 30, 2000) as compared with 2.9 per cent during the corresponding period of last year. On an average basis, 'fuel' inflation jumped to 25.7 per cent during the current financial year (up to December 30) from 6.7 per cent a year ago. 'Primary' inflation accelerated to 3.2 per cent from 1.3 per cent during the corresponding period of the previous year. However, manufacturing inflation, at 2.6 per cent, was comparable to the previous year's level of 2.5 per cent. The annual point-to-point inflation as on December 30, 2000, accelerated to 8.2 per cent from 3.0 per cent as on January 1, 2000. The core rate of inflation as on December 30, 2000 (excluding administered items) worked out to 3.5 per cent, on a point-to-point basis, as against the headline rate of 8.2 per cent.
1.60 On an weighted average basis, the fuel group contributed the maximum to inflation during 2000-01 (up to December 30, 2000), with a share of 64.3 per cent, which was substantially higher than that of 35.2 per cent during the corresponding period of the preceding year. This was followed by the manufactured products and primary articles groups' contributions at 24.9 per cent and 12.0 per cent as against 54.2 per cent and 11.6 per cent respectively, a year ago.
1.61 The inflation rate at the retail level, as measured by the annual variation in consumer price index for industrial workers (CPI-IW) on a point-to-point basis, increased to 2.7 per cent by end-November 2000 as compared with a negligible increase during the same period of the preceding year, reflecting mainly the upward trend in the prices of non-food articles. On a monthly average basis, however, CPI-IW inflation has remained below 4.0 per cent during 2000-01 (up to November), in contrast tp the preceding year, when it ranged between 6-13 per cent.
Scheduled Commercial Bank Survey
1.62 Aggregate deposits of scheduled commercial banks increased by 14.5 per cent during 2000-01 so far (up to December 29, 2000) as against 10.9 per cent during the corresponding period in 1999-2000. The higher growth of deposits during the current financial year so far is partly a reflection of the shifting of the year-end bunching of 1999-2000 to the beginning of the current year and partly because of inflow of Rs.25,662 crore in the form of India Millennium Deposits (IMD) mobilised from abroad. The year-on-year growth of aggregate deposits, excluding the IMD inflows, works out lower at 14.5 per cent during 2000-01 (up to December 29, 2000) than the growth of 16.7 per cent registered a year ago.
1.63 There has been a significant pick-up in bank credit which grew by 13.6 per cent during 2000-01 (up to December 29, 2000) from 12.6 per cent, a year ago. While growth of food credit was lower during 2000-01 so far at 45.8 per cent (against 52.2 per cent, a year ago), non-food credit increased to 11.6 per cent from 10.7 per cent. A sectoral deployment analysis of the behaviour of non-food gross bank credit of 50 reporting banks, as on September 22, 2000, shows a pick up in credit for exports, petroleum, infrastructure, chemical group and electricity (Table 1.9). There was a significant pick-up in working capital financing for bills receivables. To some extent this was because credit was directed towards inventory build-up especially in fertiliser, sugar, petroleum and automobiles industries.
1.64 The investments by scheduled commercial banks in non-SLR securities and government and other approved securities recorded lower increases of Rs. 5,790 crore (up to December 29, 2000) and Rs. 46,726 crore (up to December 15, 2000), respectively, than Rs.9,483 crore and Rs.47,170 crore, respectively, deployed during the corresponding periods of 1999-2000.
Financial Markets
1.65 During 2000-01 (upto December), money market conditions were influenced by short-term developments in the currency market and policy interventions of the Reserve Bank aimed at promoting stability in the entire financial market spectrum including the money market. The developments in the money market during 2000-01 (up to December) can broadly be classified into three distinct phases, viz., April- May 2000, June-August 2000 and September-December 2000.
1.66 Easy liquidity conditions in the first phase limited movements of rates in the range of 6.84-7.64 per cent. During the second phase, the movements of the call rates were strongly influenced by short-term developments in the foreign exchange market and the response of the Reserve Bank to assuage market pressure. In June 2000, liquidity remained tight on account of advance tax payments (around Rs.10,000 crore) and volatility in the foreign exchange market, countered by increased spot sales by the Reserve Bank. In order to maintain orderly conditions in the money market, the Reserve Bank injected liquidity through newly introduced reverse repo auctions under the Liquidity Adjustment Facility (LAF), with rates ranging from 9 to 14 per cent. The call rates closely tracked the reverse repo rate throughout the month. On one occasion, i.e. June 16, the call rates shot up to 32.0 per cent following non-acceptance of any reverse repo bid by the Reserve Bank. The liquidity position improved considerably in July 2000 following redemptions and coupon payments. The foreign exchange market, after remaining stable during the first half of July 2000, turned uncertain. Responding to these developments, the Reserve Bank tightened monetary conditions and supplemented these measures by multiple day repo auctions since August 3, 2000. The average daily repo outstanding during August 2000 amounted to Rs.7,264 crore. The average call rates hardened from 7.88 per cent in July to 13.09 per cent in August 2000. In the third phase, inter-bank call money lending rates exhibited some softening following gradual restoration of stability in the foreign exchange market and facilitating a reduction in repo cut-off rates. The call rates gradually settled at 8.79 per cent in December 2000 from the average of 13.09 per cent in August 2000. The call rates firmed up during the first half of November 2000 following the auction of dated Government securities and strong interest in sales of Government paper under OMO conducted by the Reserve Bank. Upward pressure on call rates was assuaged through reverse repo operations. The liquidity position improved considerably in the second half of the month as the IMD funds flowed into the banking system and coupon inflows poured in. The liquidity situation remained generally easy for the most part of December with call rates hovering around the Bank Rate. Liquidity operations tempered a month-end spike and the weighted average call money lending rate ruled at 9.18 per cent during end-December 2000.
Table 1.9: Sectoral and Industry-wise Deployment of Gross Bank Credit of Scheduled Commercial Banks (Variations) |
Variations as on September | Variations as on | |||
24, 1999 over March 26, | September 22, 2000 | |||
Sector/Industry | 1999 | over March 24, 2000 | ||
Absolute | Per cent | Absolute | Per cent | |
| | (Rupees crore) | | (Rupees crore) | |
1 | 2 | 3 | 4 | 5 |
Priority Sector# | 3,349 | 2.9 | 7,153 | 5.4 |
Industry (Medium and Large) | -2,126 | -1,6 | 11,234 | 7.6 |
Whole Sale Trade (Other than food procurement) | 810 | 5.8 | 721 | 4.3 |
Other sectors | 3,710 | 5.6 | 2,771 | 3.5 |
Export Credit | -1,052 | -2.9 | 891 | 2.3 |
Petroleum | 644 | 11.7 | 2,916 | 32.5 |
Infrastructure | 800 | 13.5 | 1,561 | 21.6 |
Chemical Group | 484 | 2.4 | 1,870 | 8.0 |
Electricity | -185 | -2.7 | 1,560 | 21.0 |
# Excluding investments in eligible securities. | ||||
Note : Data are provisional and relate to 50 scheduled commercial banks. | ||||
1.67 The recently introduced LAF has facilitated the maintenance of orderly market conditions (Chart 1.22). For instance, during June 2000, the reverse repo auctions were actively employed to inject liquidity when the liquidity conditions were tight. In contrary circumstances, such as in end-July and August 2000, the repo auctions were put to use to drain out liquidity from the system with a view to squelch any arbitrage opportunities emanating from the currency market. As the foreign exchange market stabilised, the repo rates declined from the peak of 15.0 per cent in August 2000 to 10.0 per cent by September 10, 2000 and further to 8.0 per cent by end-October 2000. Injections of liquidity through reverse repos in November 2000 helped to soothe the call money market. During December 2000, liquidity conditions were easy except for few days around December 26. Reverse repo bids were received and accepted at a cut-off rate of 10 per cent.
1.68 The Government securities market during 2000-01 (up to December) has largely been influenced by the behaviour of the currency market and the size of the Government borrowing programme. The yield curve in general shifted upwards and became steeper. The net market borrowings of the Central Government amounted to Rs.65,526 crore constituting around 86 per cent of the budgeted amount as against the corresponding figure of Rs.64,577 crore and 88 per cent of budgeted amount during the previous year. The initial support of the Reserve Bank to the market borrowing programme of Central Government by way of private placement and devolvement has also been a shade higher at Rs.32,978 crore as against Rs.29,267 crore in the corresponding period of the previous year.
1.69 The year 2000-01 started off with a small rally in the secondary Government securities market across the different maturity segments facilitated by the announcement of April 1, 2000 monetary measures. A downward shift in the yield curve was more pronounced in the short and medium end as the issuance of long tenor securities by the Reserve Bank somewhat contained the price increase at the long end. The turnover in Central Government securities during this period registered a significant increase (Chart I.23). The yield curve, thereafter, progressively edged up with firming of short-term rates, fluctuations in the currency market and July 21, 2000 monetary measures of the Reserve Bank. The upward shift in the yield curve, in general, was more pronounced at the medium and short ends vis-a-vis the long end during April to August 2000. The yield spread between the medium and short ends of the yield curve (10 years over 1 year) registered a progressive increase, barring July 2000. During July 2000, the prices of Government securities including the long tenor securities went up, till the announcement of July 21, 2000 monetary measures of the Reserve Bank. Higher inflows from coupon payments and redemption of Government securities, reduction in volatility in foreign exchange market coupled with improvement in the market sentiments facilitated a small rally in Government securities market which lasted till the mid of July 2000. Resurgence of volatility in the currency market during the second half of July was tackled with monetary measures of July 21, 2000. These measures were supplemented with higher levels of repo auctions, which, inter alia, influenced the upward shift of the yield curve. This phase continued till August 2000. In September-December 2000, the yield curve registered a downward shift with a gradual softening in cut-off yield of repo rates and reduction in volatility in currency markets. The downward shift in the yield curve was more pronounced at the short to medium end (Chart I.24). During September-October 2000, the improved market sentiment and decline in the repo rates steepened the yield curve, with yields declining in the shorter ends. As proceeds of the IMDs entered the system in mid-November 2000 and currency and oil markets stabilised, the yields at the longer end crashed in the face of the bullish rally in prices of government securities. With aggressive auctioning of government dated securities, the rally in the gilts market was arrested as market participants booked profits and subscribed to the auctions later. In December 2000, the gilt market rally resumed due to improved sentiment on account of a stable rupee, declining oil prices and expectations of cut in international interest rates.
1.70 During April-November 2000, total resource mobilisation by way of public and rights issues, at Rs.4,000 crore declined by 13.6 per cent. On the other hand, resource mobilisation by the private sector increased sharply by 9.6 per cent to Rs.3,289 crore. Of the total 122 issues, 11 issues for an aggregate amount of Rs.1,434 crore were floated using the book building method.
1.71 During April-September 2000, the private placement market witnessed subdued activity with total resources mobilised aggregating Rs.25,215 crore, registering a decline of 6.5 per cent as compared with Rs.26,965 crore raised during April-September 1999. Resources mobilised by the private sector at Rs.10,074 crore witnessed an increase of 14.2 per cent while those by the public sector at Rs.15,141 crore declined by 16.6 per cent.
1.72 The pace of resource mobilisation by mutual funds also moderated during April-November 2000. In particular, resource mobilisation by UTI during April-November 2000, at Rs.3,175 crore, was 35.0 per cent lower as compared with Rs.4,888 crore during the corresponding period of the previous year.
1.73 Sanctions and disbursements by the term-lending institutions continued to display strong growth during the current financial year. The financial assistance sanctioned and disbursed by AIFIs during April-November 2000 at Rs.70,534 crore and Rs.40,242 crore registered an increase of 12.3 per cent and 12.0 per cent, respectively, as compared with 10.7 per cent and 13.3 per cent, respectively, during April-November 1999.
1.74 The uptrend in equity prices witnessed in 1999-2000 could not be sustained during April-December 2000. The 30-scrip BSE Sensex declined by 1,029.2 points (20.6 per cent) to 3,972.12 as at end-December 2000 over the end-March 2000 level. The monthly average of BSE Sensitive Index which stood at 5,261.77 in March 2000, declined to touch 4,081.41 by December 2000, registering a decline of 1,180.36 points (22.4 per cent). Substantial slowdown in net FII investment to Rs.2,158.36 crore (US $ 480.95 million) during April-November 2000 as compared with Rs. 3,886.13 crore (US $ 904.55 million) during the corresponding period of the preceding year, contributed to the decline in share prices. The sharp decline in the BSE Sensex was contributed mainly by the steep fall in IT stocks during the period. Slowdown in the industrial growth, volatility in the foreign exchange market, bearishness in the international stock markets and rising international oil prices were some of the other reasons that affected market sentiment.
1.75 The decline in IT stocks, in turn, was influenced by the trends at the NASDAQ. The NASDAQ Composite Index declined by 46.0 per cent as at end-December 2000 over the end-March 2000 level as compared with a decline of 20.6 per cent in the case of BSE Sensex during the same period. However, the volatility in share prices represented by the BSE Sensex, as measured by the coefficient of variation, declined to 9.0 per cent during April-December 2000 from 10.6 per cent during the corresponding period of the previous year.
1.76 The exchange rate of the rupee vis-à-vis the US dollar has traded within a range of Rs. 43.61-46.89 during the current year so far (up to January 19, 2001). The foreign exchange market was affected by considerable uncertainty during the first half of 2000-01, prompting the Reserve Bank to undertake a number of measures to curb volatility in the markets between June 2000 and October 2000. These measures were supported by sales and purchases of foreign currency by the Reserve Bank. For the period April-October 2000, gross purchases amounted to US $ 13.1 billion while gross sales amounted to US $ 16.3 billion. Thus, the net sales during April-October 2000 amounted to US $ 3.2 billion. The sales by the Reserve Bank during this period were to meet excess demand in currency markets, particularly on account of oil imports.
Monetary Policy
1.77 The April 2000 monetary and credit policy was framed in the context of easy liquidity conditions, although it was recognised that the outlook could 'change dramatically within a relatively short period of time'. The Reserve Bank continued to emphasise the need to meet legitimate requirements for bank credit while guarding against inflationary pressures due to excess demand. The M3 growth rate during 2000-01 was projected at about 15.0 per cent, which was deemed consistent with a rate of inflation of about 4.5 per cent and a GDP growth rate of about 6.5-7.0 per cent. The GDP growth projection was revised to 6-6.5 per cent in October 2000 but the M3 projection remained unchanged.
1.78 M3 recorded a higher growth of 12.9 per cent during 2000-01 (up to December) than 11.3 per cent during the corresponding period of 1999-2000 because of inflows under India Millennium Bonds (Rs.25,662 crore). The Reserve Bank's Working Group on Money Supply (Chairman: Dr. Y.V. Reddy) recommended that money supply be compiled on residency basis by not directly reckoning banks' non-resident repatriable foreign currency fixed deposit liabilities. The monetary effect of such capital flows would, therefore, depend on their net effect on the monetary base. The year-on-year M3 (net of IMDs) growth rate fell to 13.2 per cent as on December 29, 2000 from 17.7 per cent as on December 31, 1999. The monthly average year-on-year M3 (net of RIBs/IMDs) growth rate decelerated to 15.3 per cent as on December 29, 2000 from 17.1 per cent as on December 31, 1999 and 18.0 per cent as on January 1, 1999. Currency with the public decelerated to 8.4 per cent during 2000-01 (up to December 29) partly driven by a slowdown in agricultural activity. Aggregate deposits recorded a strong accretion of 14.0 per cent as compared with 10.9 per cent during the corresponding period of the previous year.
1.79 Domestic credit (adjusted for scheduled commercial banks' investments in non-SLR securities) increased by 11.3 per cent during 2000-01 (up to December 29) as compared with 12.4 per cent during 1999-2000 (up to December 31, 2000). Net bank credit to the Government decelerated to 11.3 per cent from 14.2 per cent last year, partly because of an improvement in the Centre's fiscal deficit. Bank credit to the commercial sector accelerated to 11.5 per cent during 2000-01 (up to December 29, 2000) from 10.3 per cent during the corresponding period of the previous year. The total resource flow from bank and non-bank sources, inclusive of capital issues, GDRs/FCCBs, CPs subscribed by non-banks and borrowings as well as bills rediscounted with financial institutions amounted to Rs. 1,09,162 crore during 2000-01 (up to December) as compared with Rs. 91,204 crore during the corresponding period of the previous year.
1.80 Reserve money increased by 1.9 per cent (Rs.5,317 crore) during 2000-01 (up to December 29, 2000) as compared with 2.1 per cent during the corresponding period of 1999-2000. The net RBI credit to the Centre decelerated to 2.2 per cent (Rs.3,041 crore) during 2000-01 (up to December 29, 2000) from 5.2 per cent (Rs.7,572 crore) during the corresponding period of 1999-2000, mainly on account of the Reserve Bank's net subscription to the Centre's fresh dated securities (Rs.29,504 crore at face value) partly offset by net open market sales (Rs.19,090 crore, of which Rs.11,388 crore were to commercial banks). The Reserve Bank's foreign currency assets increased by Rs.12,900 crore (adjusted for revaluation) during 2000-01 (up to December 29, 2000) as compared with an increase of Rs.11,922 crore (adjusted for revaluation) during the corresponding period of 1999-2000, mainly on account of IMD inflows. The monetary impact of IMDs was, by and large, offset by market offtake of government paper via auctions and the Reserve Bank's OMO window and net sales to authorised dealers.
1.81 Monetary management during 2000-01 could be analytically viewed in terms of three phases, viz., April 2000, May-November 3, 2000 and November 3, 2000 onwards, as the Reserve Bank had to balance the domestic and external sources of monetisation in order to maintain orderly conditions in the money and foreign exchange markets (Chart I.25).
1.82 In the first phase, easy liquidity conditions prevailed as a result of capital flows. With stability returning to the foreign exchange market as a result of sustained excess supply conditions, the Reserve Bank continued to ease monetary conditions by reducing by one percentage point i) the CRR to 8.0 per cent in two equal stages effective April 8 and April 22, 2000 augmenting the lendable resources with commercial banks by Rs.7,200 crore, ii) the Bank Rate to 7.0 per cent effective the close of business on April 1, 2000 and iii) the fixed rate repo rate to 5.0 per cent effective April 3, 2000. The Reserve Bank also cut the savings deposit rate of scheduled commercial banks by 0.5 percentage point to 4.0 per cent, effective April 3, 2000. The increase in the Centre's monetised deficit (Rs.11,785 crore) was offset by the reduction in the Reserve Bank's credit to commercial banks and primary dealers (Rs.11,172 crore).
1.83 The situation changed dramatically in the second phase beginning May 2000, with the return of excess demand conditions in the foreign exchange market, as a result of a sharp increase in the oil import bill and the drying up of capital flows. The Reserve Bank's foreign currency assets declined by Rs.10,676 crore (adjusted for revaluation) between April 21-November 3, 2000, essentially on account of net sales to authorised dealers. With monetary policy action in the form of a 0.5 per cent CRR hike (impounding banks' lendable resources by about Rs. 3,800 crore) and a cut in banks' refinance facility, together sucking out about Rs.7,000 crore, the liquidity gap was met by a sharp increase in the net RBI credit to the Centre (Rs.17,783 crore). In fact, the Centre's monetised deficit hit a historic peak at Rs. 29,568 crore on November 3, 2000.
1.84 The Reserve Bank announced measures on May 25, 2000 to contain the ensuing volatility in the exchange rate through measures to reduce the demand supply gap in the foreign exchange market. First, an interest rate surcharge of 50 per cent of the lending rate on import finance was imposed with effect from May 26, 2000 as a temporary measure. Essential categories, such as export related imports, bulk imports in respect of crude oil, petroleum products, fertilisers, edible oil and other essential commodities imported through Government agencies were exempted from interest surcharge. Secondly, the Reserve Bank indicated that it would meet partially or fully the Government debt service payments directly as considered necessary. Thirdly, it was decided to make arrangements to meet fully or partially the foreign exchange requirements for import of crude oil by the Indian Oil Corporation. Fourthly, the Reserve Bank also announced that it would continue to sell US dollars through the State Bank of India in order to augment supply in the market or intervene directly as considered necessary to meet any temporary demand-supply imbalances. Fifthly, exporters were advised not to delay repatriation of export proceeds beyond the due date. In order to discourage any delay in realisation of export proceeds, it was decided that in respect of overdue export bills, banks would charge interest at 25 per cent per annum (minimum) from the date the bill falls due for payment. Sixthly, the Reserve Bank reiterated that authorised dealers acting on behalf of FIIs were free to approach it to procure foreign exchange at the prevailing market rate. Depending on market conditions, the Reserve Bank would either sell the foreign exchange directly or advise the concerned bank to buy it in the market. Finally, banks were advised to enter into transactions in the forex market only on the basis of genuine requirements and not for the purpose of building up speculative positions. The RBI also indicated that it would monitor the position closely. In response to these measures, the rupee regained stability and traded within a narrow range of Rs.44.57 - Rs.44.79 per US dollar during June 2000.
1.85 The Reserve Bank modulated liquidity conditions with a view to maintaining interest rates at levels sufficiently high to discourage spill overs from the money market to the foreign exchange market and at the same time to avoid excessive pressure on interest rates in the context of the Government borrowing programme. Tight money market conditions in the face of exchange market volatility drove up banks' and PDs' recourse to the Reserve Bank by Rs.7,236 crore between April 21-June 30, thereby nudging up call rates above the Bank Rate especially during the second half of May and June 2000. The Reserve Bank accepted private placements/devolvements of dated securities amounting to Rs.6,961 crore during this period to ease pressure on domestic interest rates. The introduction of the Liquidity Adjustment Facility (LAF) effective June 5, 2000 allowed the Reserve Bank an additional lever for influencing short-term liquidity conditions. With the decline in foreign currency assets by Rs. 5,798 crore (adjusted for revaluation) between May 19 - June 30, 2000, the Reserve Bank conducted reverse repo auctions, averaging about Rs.3,000 crore, at interest rates which were gradually scaled down with the return of stability in the foreign exchange market.
1.86 The exchange rate of the Indian rupee depreciated to Rs.45.02 per US dollar on July 21, 2000 after trading in the range of Rs.44.68-44.74 per US dollar during the first half of July 2000. On a review of developments in the international and domestic financial markets including the foreign exchange market, the Reserve Bank tightened monetary conditions through a package of measures on July 21, 2000. First, the Bank Rate was increased by 1 percentage point from 7 per cent to 8 per cent as at the close of business on July 21, 2000. Secondly, the Cash Reserve Ratio (CRR) was increased by 0.5 percentage point from 8 per cent to 8.5 per cent in two stages by 0.25 percentage point each effective July 29, 2000 and August 12, 2000. Thirdly, the limits available to banks for all refinance facilities including the collateralised lending facility (CLF) were reduced temporarily to the extent of 50 per cent of the eligible limits in two equal stages: effective from July 29, 2000 and August 12, 2000. The balances in Exchange Earners' Foreign Currency (EEFC) accounts were required to be scaled down to 50 per cent of the amount held on August 11, 2000 by August 23, 2000. Future accretions to EEFC accounts were restricted to 50 per cent of existing limits and were required to be maintained in liquid form as current/savings accounts. Credit facilities available against EEFC accounts were held in abeyance till further notice. In the Mid-term Review of Monetary and Credit Policy for the year 2000-01 the EEFC entitlements were restored to their earlier levels. It was also decided that the EEFC accounts would henceforth be held in the form of current accounts and no credit facilities would be provided by banks against the EEFC balances.
1.88 The Reserve Bank continued to modulate liquidity conditions to counterbalance the further reduction in its net foreign assets (Rs.4,239 crore, adjusted for revaluation) between June 30 - November 3, 2000. The Reserve Bank's net primary subscription to Government during this period amounted to Rs.21,543 crore while net open market sales amounted to Rs.4,328 crore (of which Rs.632 crore to commercial banks). The monetary impact of the monetisation of the fiscal deficit was contained by repo operations (which peaked at Rs.19,115 crore as on September 5, 2000) under the Liquidity Adjustment Facility at higher interest rates. Daily repo rates were hiked from 8.0 per cent as on August 1, 2000 to 15.5 per cent as on August 9, 2000 and subsequently brought down to 8.0 per cent by October 25, 2000.
1.89 The third phase witnessed an accretion to the Reserve Bank's foreign currency assets with gradual inflows of India Millennium Deposits. The Reserve Bank was able to contain the monetary impact of the accretion to its foreign currency assets by divesting its net domestic assets with the revival of market interest in government paper. As a result, the Reserve Bank's net credit to the Centre declined by Rs.26,527 crore during 2000-01. During November-December, 2000, while the repo rate was 8.0 per cent, the reverse repo rate was 10.0 per cent.
Public Finances
1.90 The developments in Central government finances during the first eight months of the current fiscal year, i.e., April-November 2000 reveal a relatively better fiscal performance as compared with the previous year. Some of the important positive trends during the current fiscal year so far have been continued buoyancy in revenue collections and containment of the fiscal deficit. The gross fiscal deficit (GFD) at Rs.64,269 crore or 3.0 per cent of GDP (April-November 2000) was lower by 0.3 per cent over the corresponding period of last year. The revenue deficit, at Rs.42,662 crore, in the first eight months showed a decline of 6.2 per cent over last year (Rs.45,492 crore). The primary deficit at Rs.7,188 crore was much lower than that in April-November 1999. Revenue receipts during 2000-01 (April-November) registered a growth of 16.1 per cent (14 per cent in April-November 1999) which has been above the projected revenue growth of 13.5 per cent for the full fiscal year 2000-01. Of the non-debt capital resources, revenue mobilisation from disinvestment budgeted at Rs.10,000 crore for this year is nil so far. The aggregate expenditure during 2000-01 (up to November 2000) was higher by 8.8 per cent over the level of April-November 1999 whereas the expenditure growth remained negative till July this year. The agreed limit of Centre's Ways and Means Advances (WMA) for the first and second half of 2000-01 remained same as in the last year, i.e. , Rs.11,000 crore (April-September) and Rs. 7,000 crore (October-March) respectively. During the first nine month s (April- December 2000) the average utilisation of WMA was Rs.6,061 crore, higher than the same period of the previous year (Rs.5,710 crore). The average incremental net RBI credit to the Centre was higher than the level of the same period of last year.
1.91 During 2000-01, net market borrowings provisionally allocated for all States amounted to Rs. 10,830 crore and after taking into account the repayments, the gross borrowings are placed at Rs. 11,250 crore. At this level it would show 18 per cent decline over the gross borrowings of Rs. 13,706 crore raised during the previous year. During the current fiscal year so far (up to December 2000) the aggregate market borrowings of States amounted to Rs.10,083 crore constituting 89.6 per cent of their gross market borrowing programme (provisional) for the full fiscal year. The interest rate on State borrowings began to firm up in tandem with the market conditions.
1.92 The debt management strategy of lengthening the maturity structure of government loans continued during the current fiscal year. The maturity of Central Government loans issued ranged between 2 years 11 months to 20 years as against the maturity range of 5 years 3 months to 19 years 8 months for the loans issued during 1999-2000. During the current financial year 2000-01 (as on December 22, 2000) State Governments' outstanding WMA including overdrafts from Reserve Bank amounted to Rs. 4,305 crore which was substantially higher than Rs. 2,997 crore for the similar period of the previous year.
1.93 Against the backdrop of economic and financial conditions of the Indian economy set out in this chapter, the Report now turns to its theme.
* | This chapter is based on information up to December 2000 wherever available. For the rest of the Report data generally pertain to the period up to March 2000, updated up to September 2000 wherever feasible. |

ఈ పేజీని షేర్ చేయండి:


భారతీయ రిజర్వ్ బ్యాంక్ మొబైల్ అప్లికేషన్ను ఇన్స్టాల్ చేయండి మరియు తాజా వార్తలకు త్వరిత యాక్సెస్ పొందండి!
మా యాప్ను ఇన్స్టాల్ చేయడానికి QR కోడ్ను స్కాన్ చేయండి


పేజీ చివరిగా అప్డేట్ చేయబడిన తేదీ:


