 IST,
IST,


III. Capital Formation in India - The Role of States
1. Introduction 3.1 Capital formation refers to the process by which resources are invested in assets like plants, equipment, machinery, transportation assets, electricity and other physical assets as well as in human capital through education, health, skill development, scientific advancement, and research. These investments increase the economy’s productive capacity, ensure fuller absorption of unutilized labour and other natural resources, and promote efficiency-raising innovation. Endogenous growth theory holds that investment in human capital, innovation and knowledge is a key contributor to economic growth. Empirical evidence reveals that an increase in physical capital affects the stock of human capital and vice versa (Amir et al., 2017). 3.2 As government institutions play an essential role in catalysing investment in education, skill development, healthcare, infrastructural capacity, and research and development (R&D), this Chapter examines the role played by State governments in India in shaping capital formation. Section 2 delves into trends in capital expenditure by States and presents stylized facts relating to the expenditure quality of the States. A composite index of States’ quality of expenditure helps in this assessment. The impact of States’ capex on social services and infrastructure on sectoral productivity growth is analysed in Section 3, while Section 4 probes into physical capital formation by States. Policy incentives and governance reforms to attract private and foreign capital are discussed in Section 5. Horizontal spillovers of each State’s capex on other’s are explored in Section 6. Section 7 concludes with key findings. 2. Capital Expenditure by States 3.3 India has one of the highest investment rates in the world (World Indicator Database of the World Bank). India’s capital investment/GDP ratio of 31.2 per cent in 2021 is higher than other BRICS nations (Chart III.1a). 3.4 Sectoral decomposition of investment reveals that the households and private corporations together accounted for more than 70 per cent of gross capital formation in India, whereas the share of general government, i.e., the Central and the State governments taken together remained in the range of 10-12 per cent during the period 2016-17 to 2019-20 (Chart III.1b). Public sector enterprises accounted for around 10 per cent of total capital formation in the economy. During the last three years, there has been a distinct shift in the compositional pattern of government expenditure in India in favour of capex. As against the 30-year average of States’ capital outlays (CO) at 1.9 per cent of GDP (as against 1.4 per cent for the Centre), Central and State capital outlays reached 2.3 per cent and 2.7 per cent of GDP, respectively, in 2021-22 (RE) (Chart III.2). Adjusting for the Centre’s capital outlay towards defence, the States’ share in general government capital outlay has averaged at around 70 per cent. Empirical evidence points to higher multipliers of State capex relative to that of the Centre (Jain and Kumar, 2013). 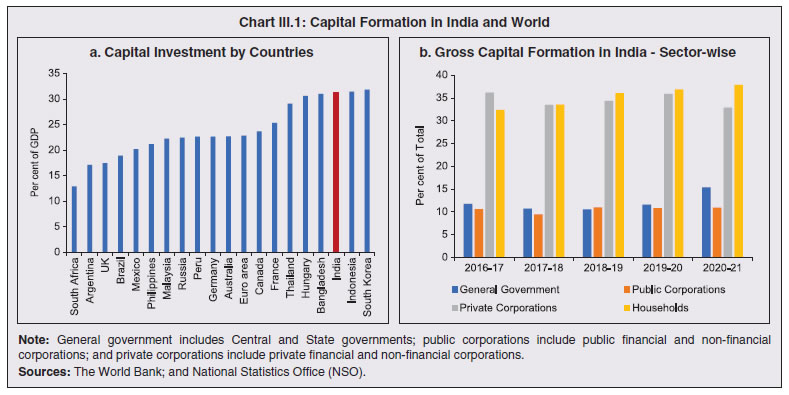 3.5 It has also been observed that it is capital spending which has a stronger impact on medium to long-term growth (RBI, 2019). The sharp rise in capex growth during 2021-22 and 2022-23 (BE) has raised the share of capital outlay in States’ gross fiscal deficit (GFD), which reflects an improvement in the quality of expenditure (Chart III.3a and III.3b; Box III.1). This has brought down the revenue expenditure to capital outlay (RECO) ratio for the States to a multi-year low in 2022-23 (BE) (Chart III.3c). With such an aggressive capex boost, the general government’s relative share in total gross fixed capital formation (GFCF) has also gone up since 2020-21 (Chart III.3d). 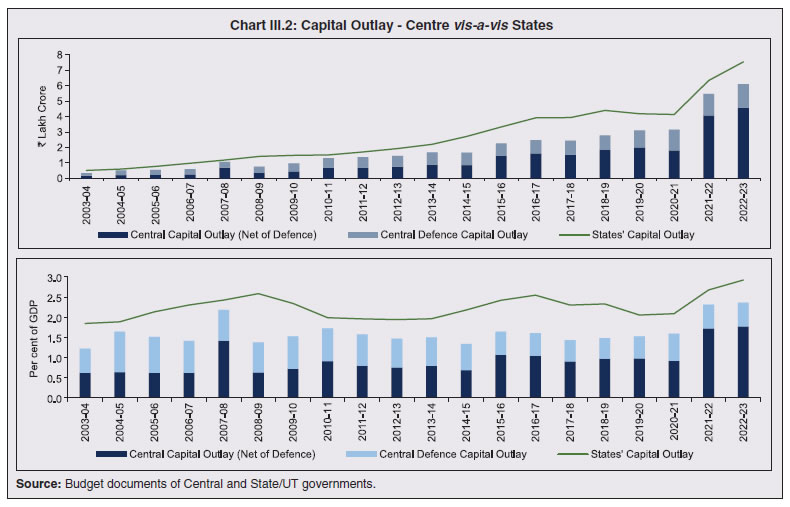 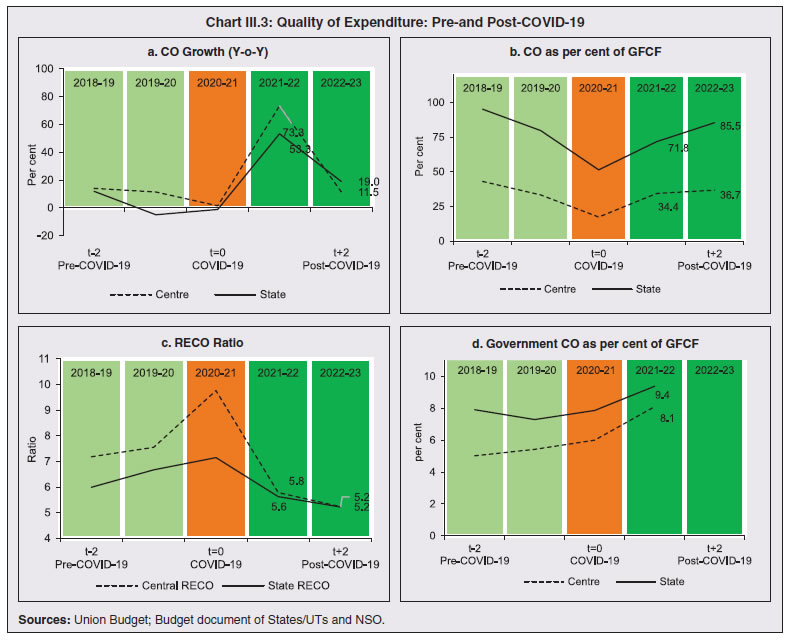
3.6 Generally, the actual capital outlay of States during a year is considerably lower than the budget estimates made at the beginning of the year (Chart III.4a). In 2020-21, States were able to execute only 69 per cent of their budgeted capital outlays. The deviation from budgetary targets is comparably much smaller for revenue expenditure, which is mostly committed in nature (Chart III.4b). State governments in India often sacrifice capital outlays during business cycle downturns to contain overall spending for achieving their deficit targets (Mukherjee, 2013). 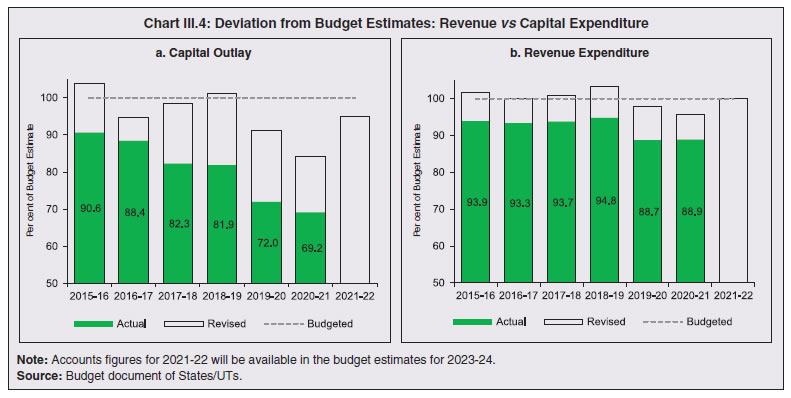 3.7 Fiscal marksmanship relating to capital outlay varies significantly across States. While the average capex cut vis-à-vis budget estimates for the 3-year period from 2017-18 to 2019-20 was 21.3 per cent (cumulatively for all States), States and UTs like Jammu and Kashmir, Goa, Tripura, Punjab, Andhra Pradesh and Delhi have cut their budgeted capex by more than 40 per cent (Chart III.5). 3.8 The highly skewed monthly distribution of capital outlay by States poses another cause for concern (Chart III.6). During the last five years, on average, States were able to spend only a third of their full year spending during H1, with more than a quarter of the total spending being undertaken in the last month i.e., March. This suggests a residual approach to spending. 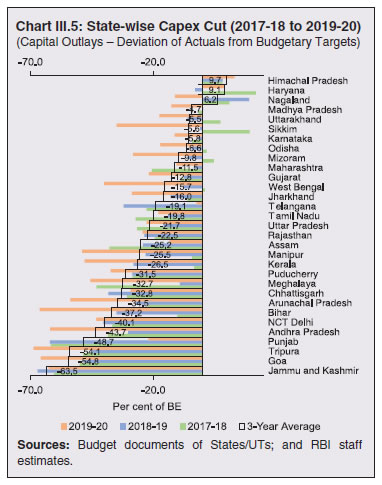 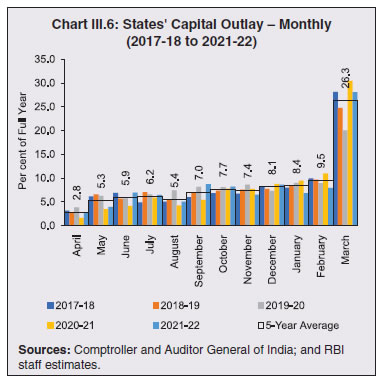 3.9 At a disaggregated level, Uttar Pradesh, Maharashtra, Madhya Pradesh, Karnataka and Tamil Nadu together account for more than 40 per cent of the combined capital outlay undertaken by all States (Chart III.7a). States like Uttar Pradesh, Odisha, Assam and Jharkhand have a relatively higher share of capital outlays in comparison to the size of their economies (Chart III.7b). Furthermore, States’ quality of expenditure, measured in terms of RECO ratio, appears to be inversely related to their level of indebtedness (Chart III.7c). 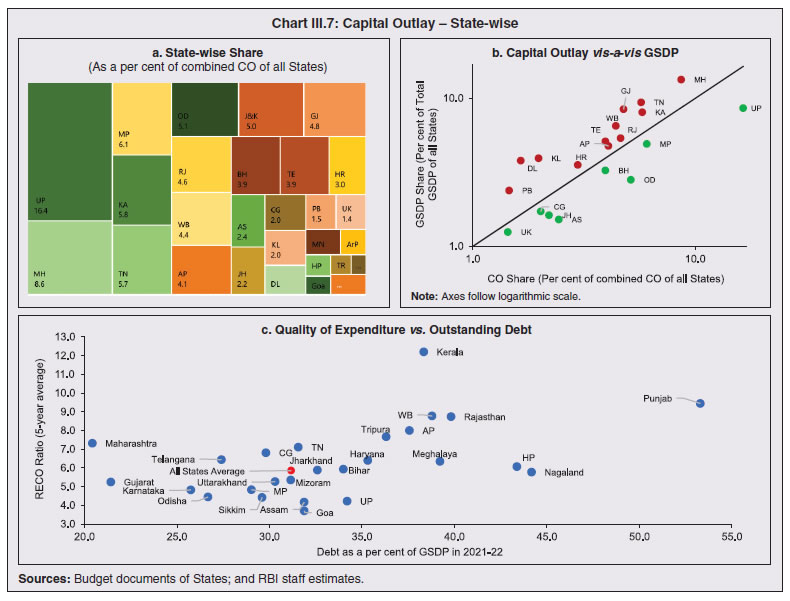 3. Human Capital Formation: Spending on Education and Health 3.10 Education and health play a critical role in building human capital, with a positive impact on economic growth through an increase in labour productivity (Hosoya, 2012) (Box III.2). In India, both the government and the private sectors are involved in providing health and education services to the people. Divergences in economic growth among Indian States are found to be related to the differences in spending on education and health as well as the creation of physical infrastructure that promote growth (Nauriyal and Sahoo, 2010; World Bank, 2006).
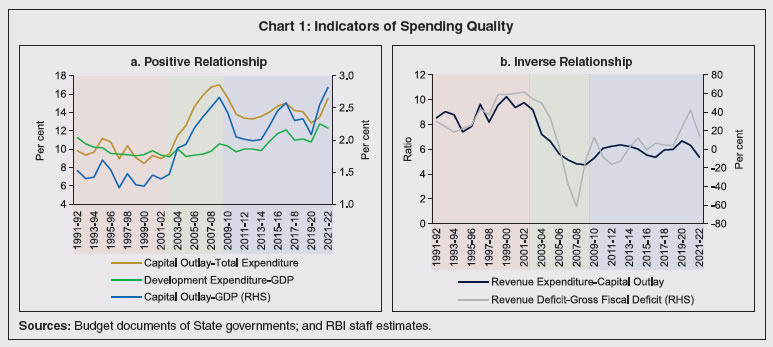
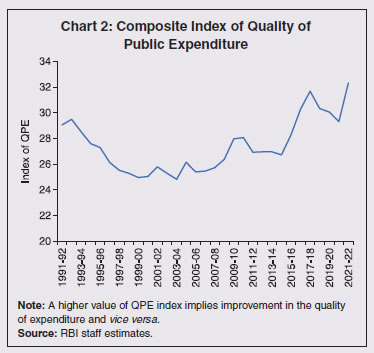
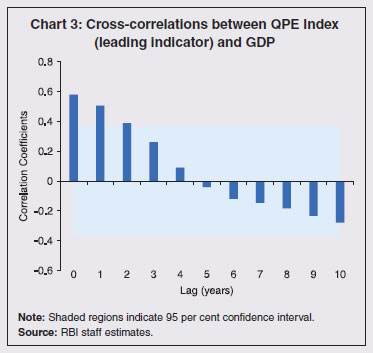
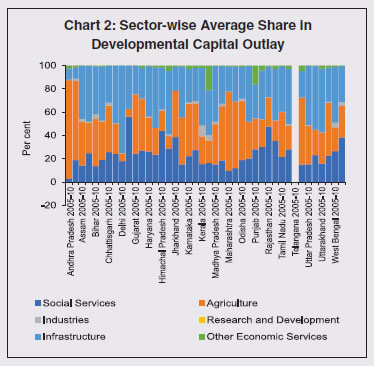
3.11 Education was a subject under the State list4 at the time of framing of the Indian Constitution before it was shifted to the Concurrent list5 by a constitutional amendment in 1976. Currently, the provision of elementary education to children, promotion and safeguarding of cultural interest of minorities, and development of higher education are the joint responsibilities of the Union and State governments, with funds provided by both for their own educational institutions as well as institutions set up by the private individuals or societies in the form of grants-in-aid (Verghese and Tilak, 1991). 3.12 Under the Indian Constitution, health is a subject categorised under the State list6 (public health, sanitation, hospitals and dispensaries are covered in this list). On the other hand, the Central government is entrusted in the Union list7 with subjects such as port quarantine, including hospitals connected therewith, marine hospitals and union agencies for professional training and research. Additionally, various items related to health having wider ramifications at the national level are included in the concurrent list such as family welfare, population control, medical education, prevention of food adulteration and quality control in the manufacture of drugs. The methods adopted by the governments to deliver these services include framing of policies, execution of legislation and implementation of programmes (Kishore, 2012). 3.13 Of the total capital outlay, States spend 94 per cent on developmental expenditure (Chart III.8a), with a third for provisioning of social services like health, education, housing and urban development, and social security and the rest on economic services. Health and education together constitute around 63 per cent of the total capital outlay for social services, with the former receiving special attention since the COVID-19 period. After contracting in 2019-20, the capital outlay for health grew by 34 per cent in 2020-21. States have continued with the capex push in favour of health, with y-o-y growth of 79 per cent in 2021-22, and 23 per cent budgeted for 2022-23 (Chart III.8b). 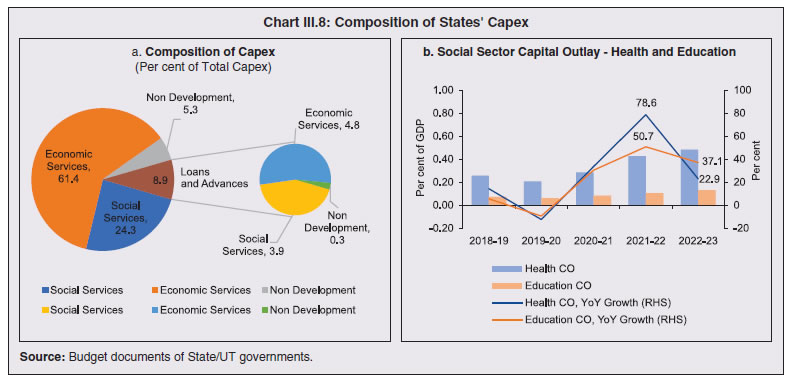 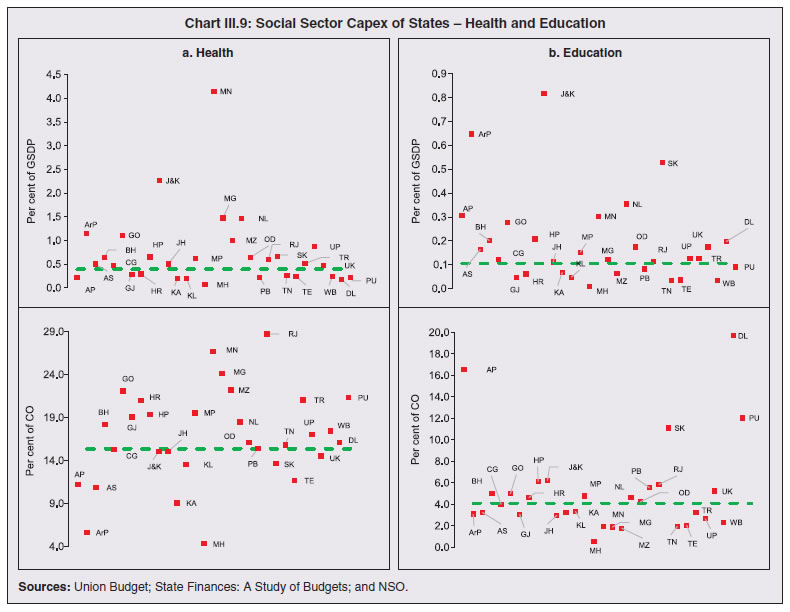 3.14 The pattern of capital investment in health and education varies across States. For healthcare, the north-eastern and hilly States stand out with the highest capital spending. Delhi, Andhra Pradesh and Punjab have the highest share of education in their total capital outlay (Chart III.9). 4. Investment in Infrastructure 3.15 Growth in infrastructure capacity is directly correlated with real positive economic output (Ilori, 2004). Apart from positively influencing economic growth, investment in infrastructure can also improve the quality of life of the people, create higher job opportunities, and encourage efficient use of financial resources (Dhir, 2018). Public spending on infrastructure can also crowd in private sector investment. This assumes significance because physical infrastructural projects involve large lump sum expenditures as well as protracted gestational time, which may deter private investment. 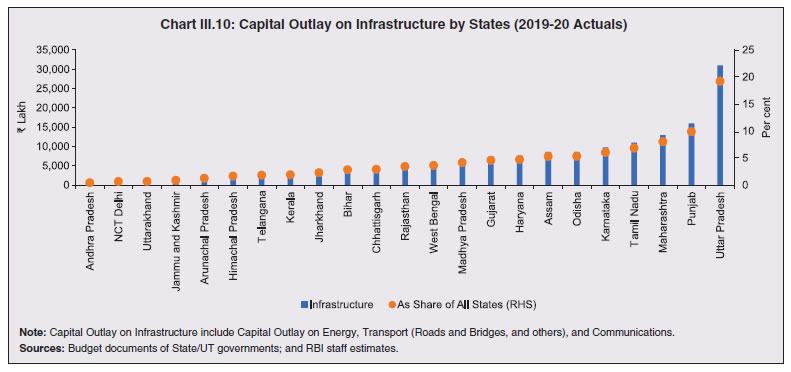 3.16 In an emerging economy like India with a federal set up, both the Central and State governments have a significant role to play in the development of physical infrastructure such as power, transportation, communication, and logistics (Chart III.10). Public private partnership (PPP) has emerged as a preferred arrangement wherein the private sector gets its normal financial rates of return while the public sector partner provides concessional funding, based on the long term direct and indirect benefits to the economy. The government has also introduced innovative financial instruments such as viability gap funding (VGF) through special purpose vehicles (SPV) for funding mega infrastructure projects. In October 2021 the Union government launched Gatishakti – National Master Plan for Multi-modal Connectivity programme. It would integrate the infrastructure schemes of various ministries and State governments like Bharatmala, Sagarmala, inland waterways, dry/land ports and UDAN (GoI, 2022). 3.17 In order to mitigate the adverse impact of climate change on human life, more than 70 countries have set net zero targets, covering about 76 per cent of global emissions. The Indian government has also committed toward reaching net zero emissions by 2070 and reducing cumulative emissions by 1 billion tonne by 2030. In order to make this transition feasible, the State governments in India need to step up investment in these areas and create a conducive policy environment for the private sector to invest in renewable and green energy sources. 5. Policy Incentives and Governance Reforms by States 3.18 States have a central role in designing the institutional environment which determines the incentive structure, regulatory barriers, entry-exit costs, operational and production costs, and level of entrepreneurship and skills. Typically, States offer a bouquet of incentives to the private sector such as financial assistance in the form of interest subvention schemes, one-time financial grants, credit-linked capital subsidies, partial/full reimbursement of registration fees/ stamp duty on sale/lease deeds of land, reimbursement of State Goods and Service Tax (SGST), operational assistance like reimbursement of electricity duty, subsidy on power tariff, water tariff, transportation subsidy and the like to encourage private investments for industrial development. Other incentives can include employment generation subsidy, reimbursement of employer’s contribution to Employee Provident Funds (EPF) and Employees’ State Insurance (ESI) Scheme, and subsidy on training of employees. The States may also allow certain investors some relaxation on adherence of various labour and industrial laws to ease their compliance costs and burden. Many States have set up Investment Promotion Boards to advice, guide and facilitate investment in infrastructure. Some States have developed dedicated industrial parks with plug and play infrastructure which includes road connectivity, transport and logistic facilities, assured water and power supply, common facilities such as warehousing, information and communication technology (ICT), and waste handling. 3.19 In recent times, several States have taken initiatives to encourage investments in sunrise sectors. For instance, States such as Chhattisgarh, Goa, Haryana, Maharashtra, Kerala, Punjab, and Rajasthan are providing a wide range of incentives for hand-holding start-ups to promote the manufacturing of Electric Vehicles (EVs). Bihar, Goa, Karnataka, Uttar Pradesh and Delhi have also policies in place to nurture a start-up environment, including common infrastructural facilities, co-working spaces, research and development and testing labs, incubators and accelerator programmes and financial assistance such as one-time seed funding support, grants for repayment of interest on loans, and reimbursement of patent fees (Table III.1). Haryana and Uttar Pradesh have formulated policies to encourage the establishment of their data centre industry by providing various forms of incentives to subsidise capital, reduce operational costs and stimulate employment generation. 3.20 Gujarat has the Atmanirbhar Gujarat Policy for assistance to mega industries in sectors such as green energy ecosystem, mobility, capital equipment, metal and minerals, and gems and jewellery. Other sectors which have received special policy attention include manufacturing of electronics (Andhra Pradesh, Jharkhand, Madhya Pradesh, Odisha and Uttar Pradesh), manufacturing of semi-conductors (Chhattisgarh and Gujarat), development of the aerospace sector (Karnataka, Maharashtra, and Tamil Nadu), and development of the animation, visual effects, gaming and comics (AVGC) sector (Karnataka, and Telangana). 3.21 Such policies can also play an important role in attracting foreign direct investment (FDI) flows to States. Currently, the lion’s share of FDI flows go to Maharashtra, Karnataka, and Delhi (Chart III.11a). Sector-wise, computer hardware and software, automobile industry and the services sector are drawing most of the FDI flows (Chart III.11b). While it is common for States to offer incentives to Information Technology/ Information Technology Enabled Services (IT/ ITeS), biotechnology, tourism and the micro, small and medium enterprise (MSME) sectors, special incentives are also being offered to industries such as textile, food, fisheries, film, healthcare and electricity generation. Most of the sector-specific incentives for FDI in India take the form of exemption from stamp duty, registration fee, electricity duty and various types of taxes. Exemption of entertainment taxes is common for the tourism sector (Mukherjee, 2011). 3.22 Policies for facilitating investment in infrastructure should be supplemented by administrative and governance reform (Lall and Mengistae, 2005). The Department for Promotion of Industry and Internal Trade has been developing business reform action plans (BRAP) for States. These action plans bring to the centre-stage ‘measurability’ and ‘comparability’ as far as ease of doing business in different States is concerned. It is notable that within a short span of two years, the majority of States have drastically improved their ease of doing business scores (Chart III.12). Much of this progress is on account of a multitude of State-level administrative reforms. 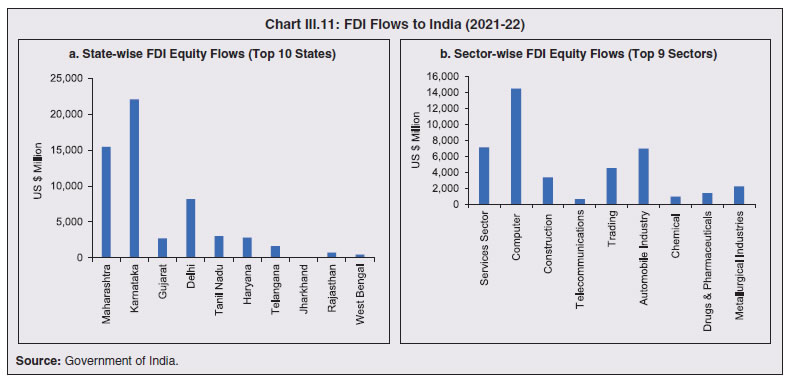 3.23 The India Innovation Index, a comprehensive tool for the evaluation and development of the country’s innovation ecosystem, ranks States and Union Territories on their innovation performance. In 2021, Karnataka, Manipur and Chandigarh occupied top positions (Chart III.13). 3.24 The Logistics Ease Across Different States (LEADS), 2022 survey assesses the logistics infrastructure across States through an indigenous data-driven index. States’ infrastructure, service delivery and regulatory environment determine the broad contours of their logistics ecosystem. Based on the survey outcomes, the States are graded into three categories. The “Achievers” are States which have shown exemplary logistics ecosystems with exceptional infrastructure and transparent regulatory processes. The “Fast Movers” are States which are moving towards becoming “Achievers” by notifying progressive policy and legislatives initiatives along with new infrastructure projects. Finally, the “Aspirers” are States which have initiated their journey towards logistics ease and excellence by adopting national best practices to further improve their contribution towards India’s emerging position as a global manufacturing and logistics hub (Chart III.14). 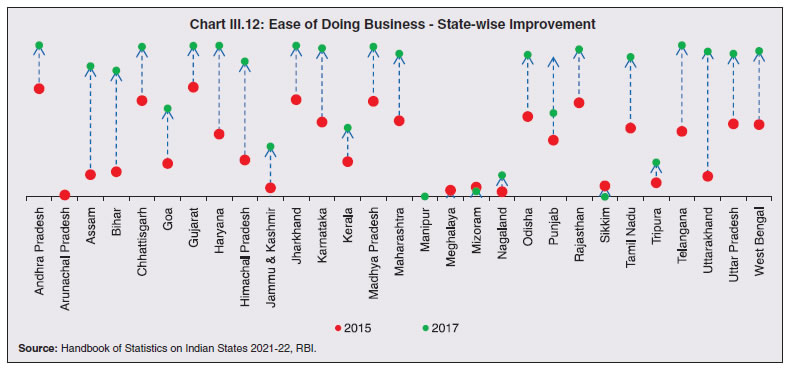 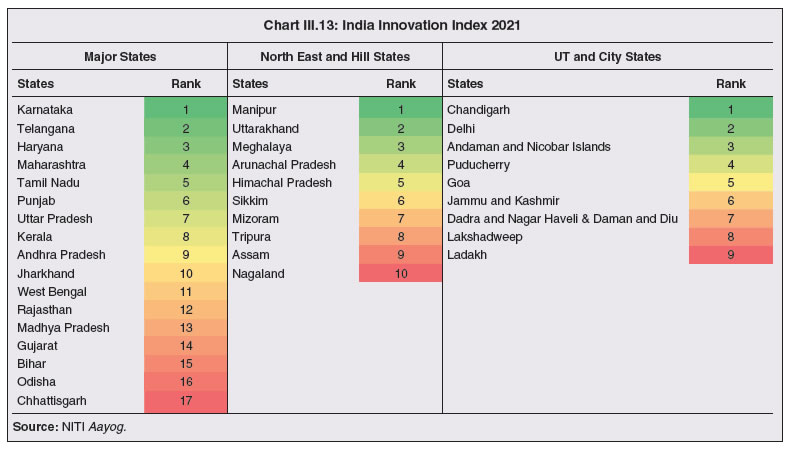 3.25 Unlike actual developmental spending, a vast majority of governance/administrative/legal reforms do not pose significant fiscal costs and can be undertaken over a relatively short period of time. 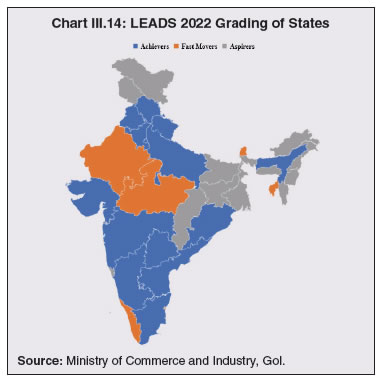 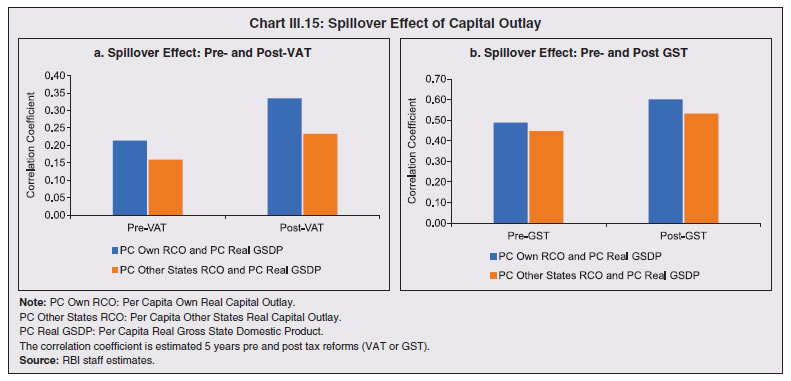 6. Spillover Effects of State Capex 3.26 In the presence of economic interconnections among States in India, the positive impact of capital outlay of one State can also spill over to other States through various demand and supply channels. Per capita real capital outlay of other States is found to have a positive correlation with the per capita real GSDP of each individual State. These positive spillovers have increased in the post-GST period (Chart III.15). 3.27 In an empirical exercise, a panel vector autoregression (PVAR) is used with three variables: real per capita GSDP; per capita own real capital outlay; and per capita real capital outlay of other States8. The impulse response function (IRF) plot generated from the PVAR shows that a positive shock on per capita own real capital outlay leads to increased real per capita GSDP. Own real capital outlay has a persistent positive impact on future per capita GSDP. The positive impact of own capital outlay on per capita GSDP tends to persist for at least four years (Chart III.16a). At the same time, per capita capital outlay by other States also has a positive impact on the State’s own per capita GSDP. The positive impact on GSDP persists for at least two years. In the long run, the cumulative impact of the capital outlay on GSDP tends to be higher (Chart III.16b). Further, the impact of own capital outlay on GSDP is found to be more persistent than the impact of capital outlay by the other States. The magnitude of spillover may vary across States depending on the relative size of the capex, location of the State in the value chain, interstate trade flows, interstate migrations and interstate financial flows. Thus, a State may benefit from positive spillovers from capex by other States, but impact of its own capex dominates. 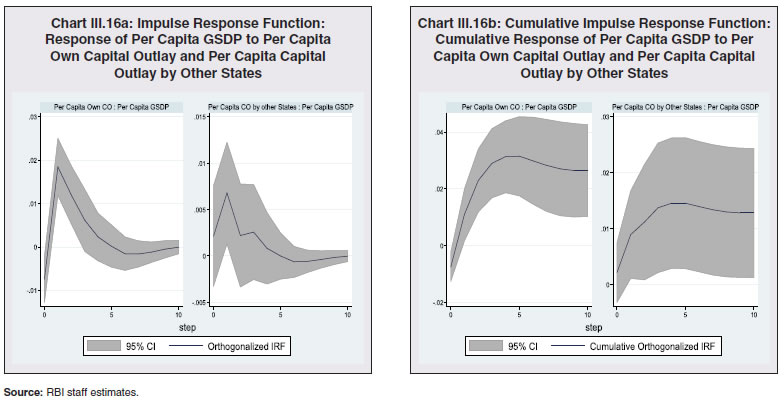 3.28 Over the years, considerable progress has been made in terms of creation of infrastructure, both physical and social, through several government initiatives. In particular, the post-pandemic economic recovery in India has been supported by enhanced public capex by both the Central and State governments. As a result, fiscal stimulus by design emphasized sustainable and non-inflationary normalization of economic activity. Since capital expenditure by sub-national governments in India is more than two thirds of the total capital expenditure incurred by the general government, it is imperative for all the States to continue with the current capex push, to sustain the quality of expenditure and maintain capital assets so that their longevity improves. In addition, States should also step up capex in areas like research and development and green energy. States can also realize the full benefit of positive spillover effects by facilitating higher inter-state trade and businesses. Going ahead, all tiers of government must engage along with private participation to create world-class capital assets in India. 1 Dynamic factor models (DFMs) are based on the idea that a small number of unobserved (or latent) factors, which change over time, are responsible for the shared dynamics of a large number of time series variables. DFMs are dimension reduction models for multivariate time series in which the observed endogenous variables are linear functions of exogenous covariates and unobserved factors, which have a vector autoregressive structure. The parameters of DFMs are estimated by maximum likelihood (ML) in state-space form by using the Kalman filter to derive and implement the log likelihood. 2 A composite index of the quality of State government expenditure was also constructed earlier in the Bulletin article on ‘Fiscal Framework and Quality of Expenditure in India’ (June 2021), which used principal component analysis (PCA) to obtain the composite index. In this Report, dynamic factor model (DFM) has been used to construct the composite index for expenditure quality of State governments, which is a more robust technique. The results obtained are broadly in line with the earlier study. Additionally, in this Report, it is shown that an improvement in the index value is associated with higher GDP. 3 Sectoral labour productivity is estimated as sectoral GVA per worker. Sectoral workers are estimated using the National Sample Survey Organisation’s (NSSO) Employment & Unemployment Survey Reports; National Institution for Transforming India (NITI Aayog); and Periodic Labour Force Survey (PLFS), NSO. 4 In case of subjects listed under State list, the State governments have the exclusive right to enact legislation. 5 In case of subjects listed under ‘Concurrent list’, the Central government and State governments enjoy equal power of legislation, subject to a provision which protects and upholds the supremacy of the Central government in the event of a conflict between the Central and State legislation. 6 So far as the Indian constitution is concerned, nowhere the term ‘health’ or ‘right to health’ has been defined in it. However, judicial interpretation has observed that ‘right to life’ also includes ‘right to health’ and thus it is a fundamental right (Chatterjee, 2016). 7 In case of subjects listed under ‘Union list’, the Central government has the exclusive right to enact legislation. 8 All the variables are detrended and checked for stationarity. Based on the model selection criteria with smallest MBIC, MAIC and MQIC panel VAR with 3 lags is selected. Panel VAR with real per capita GSDP, per capita own real capital outlay and per capita real capital outlay of other States is fitted using generalised method of moments (GMM) estimation. The fitted model satisfied all the stability criteria. |

ఈ పేజీని షేర్ చేయండి:


భారతీయ రిజర్వ్ బ్యాంక్ మొబైల్ అప్లికేషన్ను ఇన్స్టాల్ చేయండి మరియు తాజా వార్తలకు త్వరిత యాక్సెస్ పొందండి!
మా యాప్ను ఇన్స్టాల్ చేయడానికి QR కోడ్ను స్కాన్ చేయండి


పేజీ చివరిగా అప్డేట్ చేయబడిన తేదీ:


